

Although currency bulls pushed the euro against the greenback to the highest levels since mid-October in the previous week, their rally to the north was stopped and the currency pair returned below the previously-broken resistances. What can be the consequences of this event?
- EUR/USD: short (a stop-loss order at 1.1593; the initial downside target at 1.1337)
- GBP/USD: short (a stop-loss order at 1.2968; the initial downside target at 1.2630)
- USD/JPY: none
- USD/CAD: none
- USD/CHF: none
- AUD/USD: short (a stop-loss order at 0.7288; the initial downside target at 0.7055)
EUR/USD
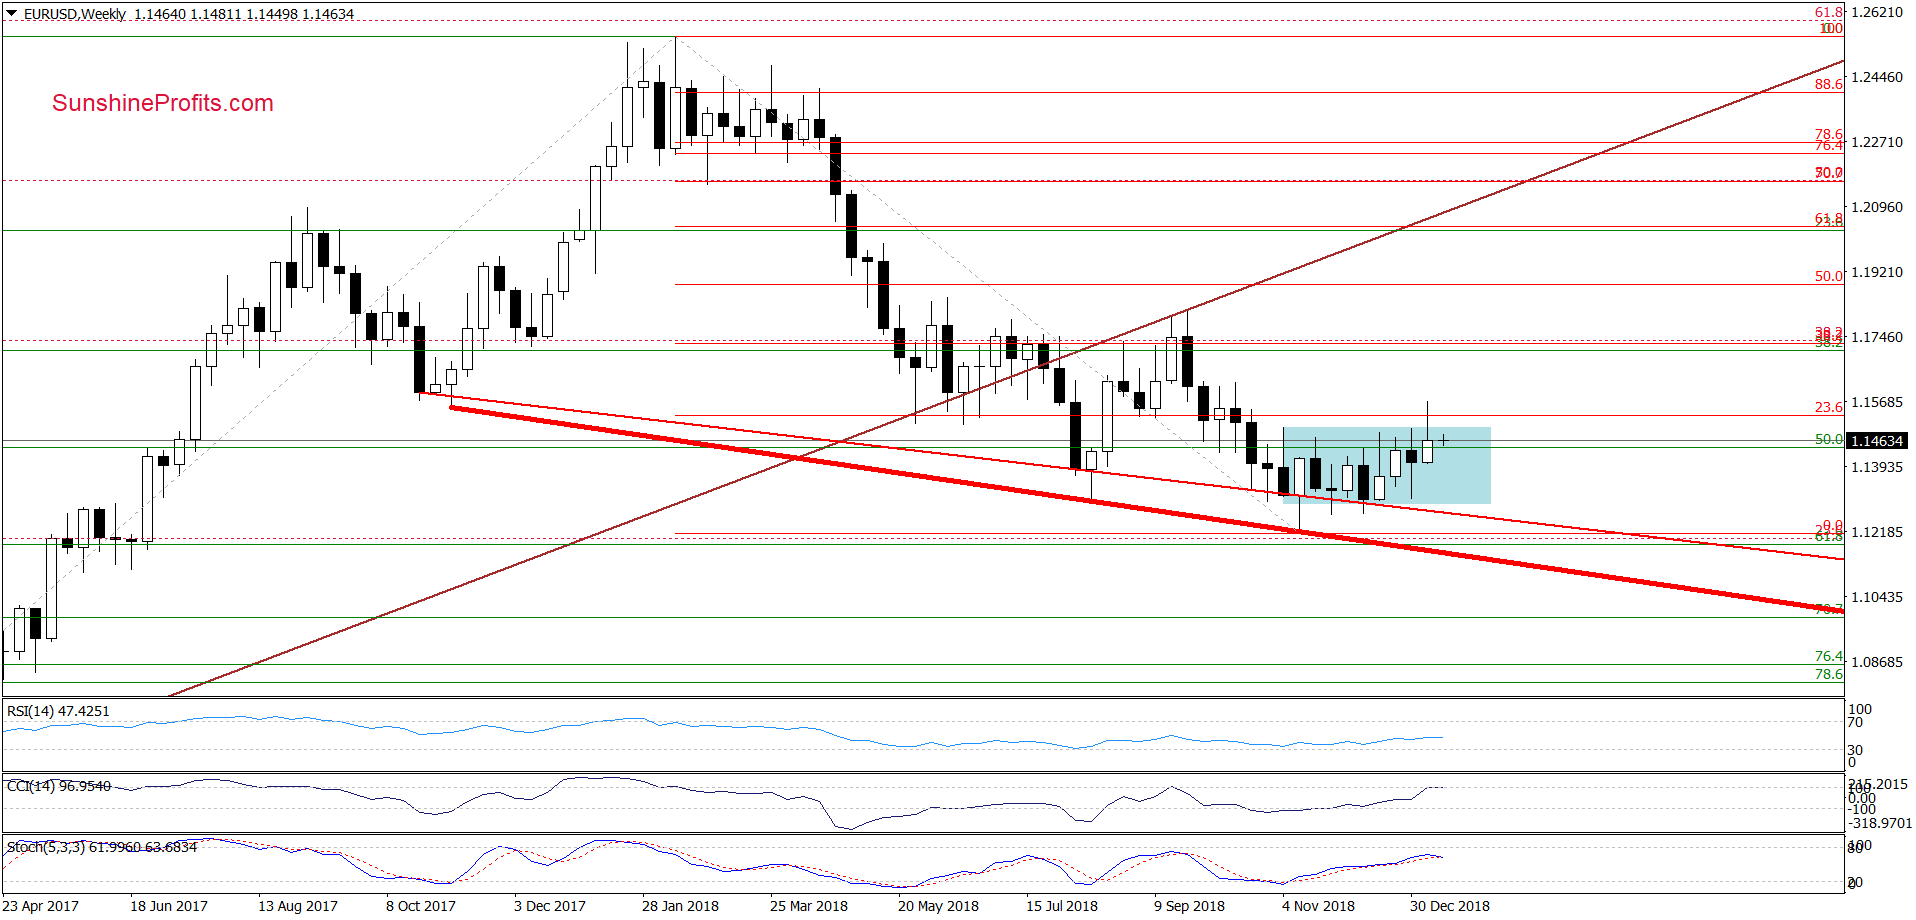
From today’s point of view, we see that EUR/USD moved higher and broke above the upper border of the blue consolidation in the previous week, but despite this improvement currency bulls didn’t manage to hold gained levels.
As a result, the pair pulled back and invalidated the earlier breakout not only above the consolidation, but also the 23.6% Fibonacci retracement, which together with the current position of the indicators suggests that lower values of the exchange may be just around the corner.
How did this move affect the very short-term chart? Let’s check below.
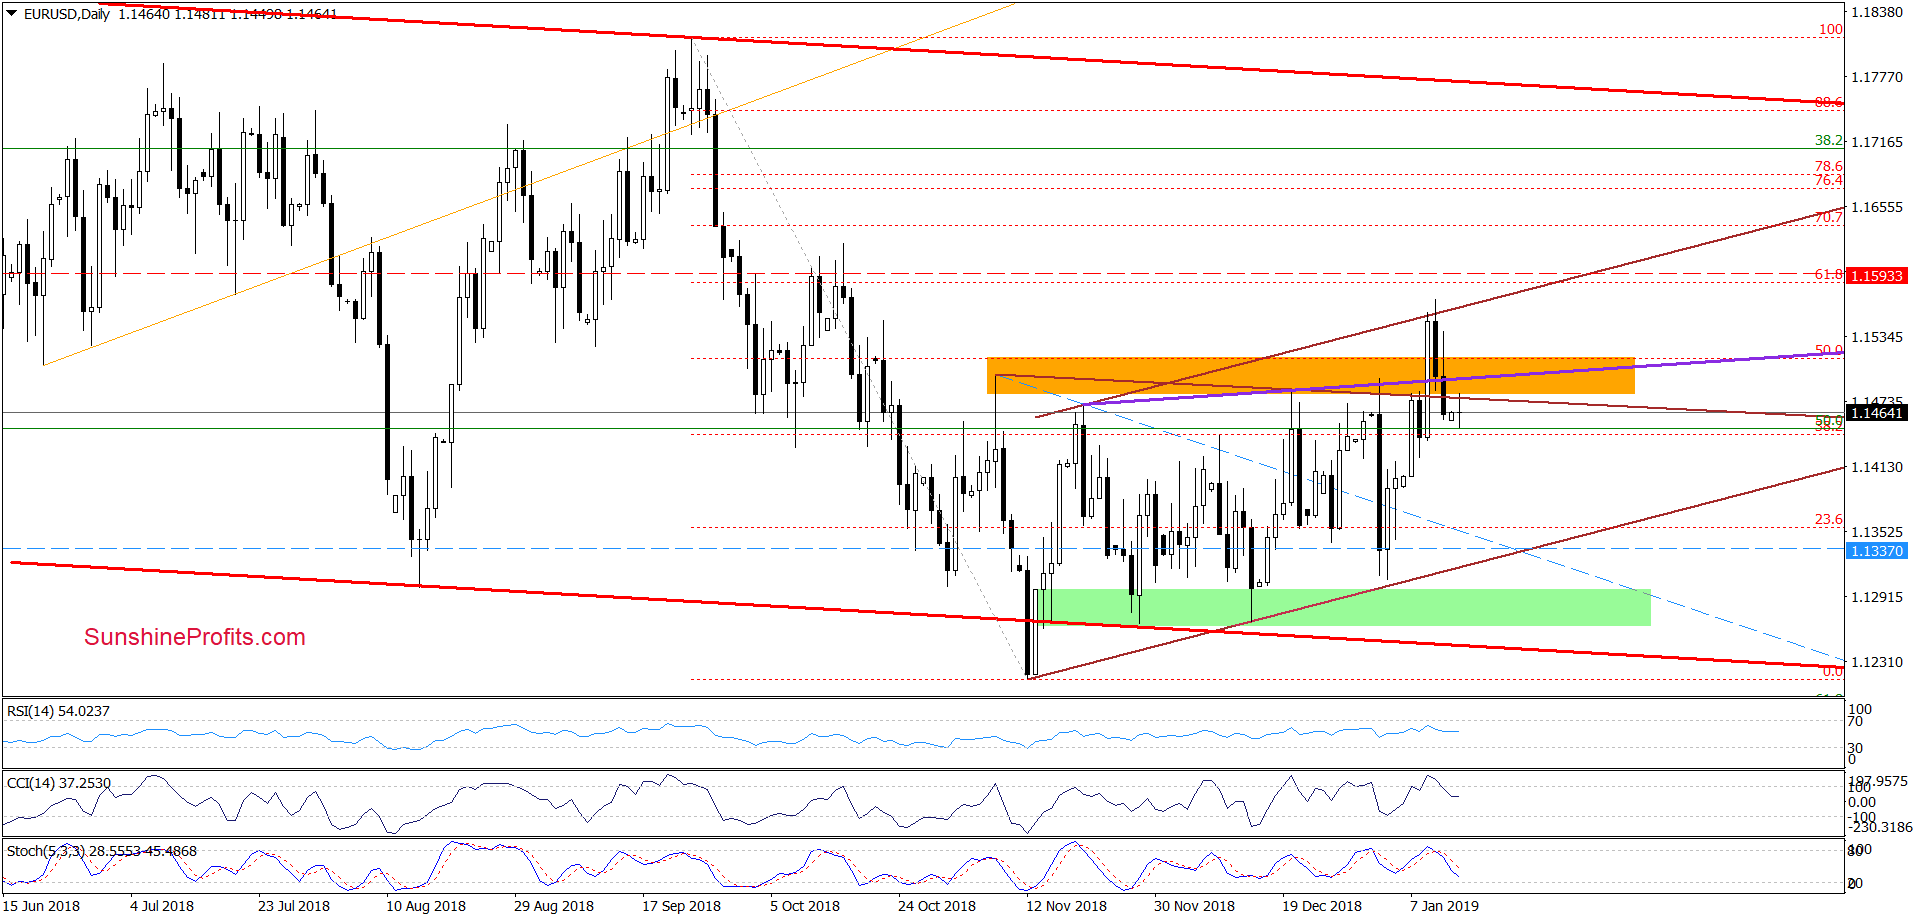
Looking at the daily chart, we see that EUR/USD finished Friday’s session not only below the orange resistance zone, but also under the upper border of the brown triangle, the 50% Fibonacci retracement and the purple support/resistance line based on the previous peaks, invalidating the earlier breakouts above them.
Additionally, the sell signals generated by the CCI and the Stochastic Oscillator remain in the cards suggesting further deterioration in the coming week. Earlier today, currency bulls tried to push the pair higher, but the upper line of the brown triangle in combination with the lower border of the orange zone stopped them, which increases the likelihood of the pro-bearish scenario about which we wrote on Friday:
(…) This scenario will be even more likely if the exchange rate closes today’s session under all these support/resistance levels. If we see such price action, we’ll likely open short positions because currency bears could take the pair to around 1.1335 or even the lower border of the brown triangle in the following days (currently at 1.1316).
Taking all the above into account, we think that opening short positions is are justified from the risk/reward perspective. All needed details below.
Trading position (short-term; our opinion): Short positions with a stop-loss order at 1.1593 and the initial downside target at 1.1337 are justified from the risk/reward perspective. We will keep you informed should anything change, or should we see a confirmation/invalidation of the above.
GBP/USD
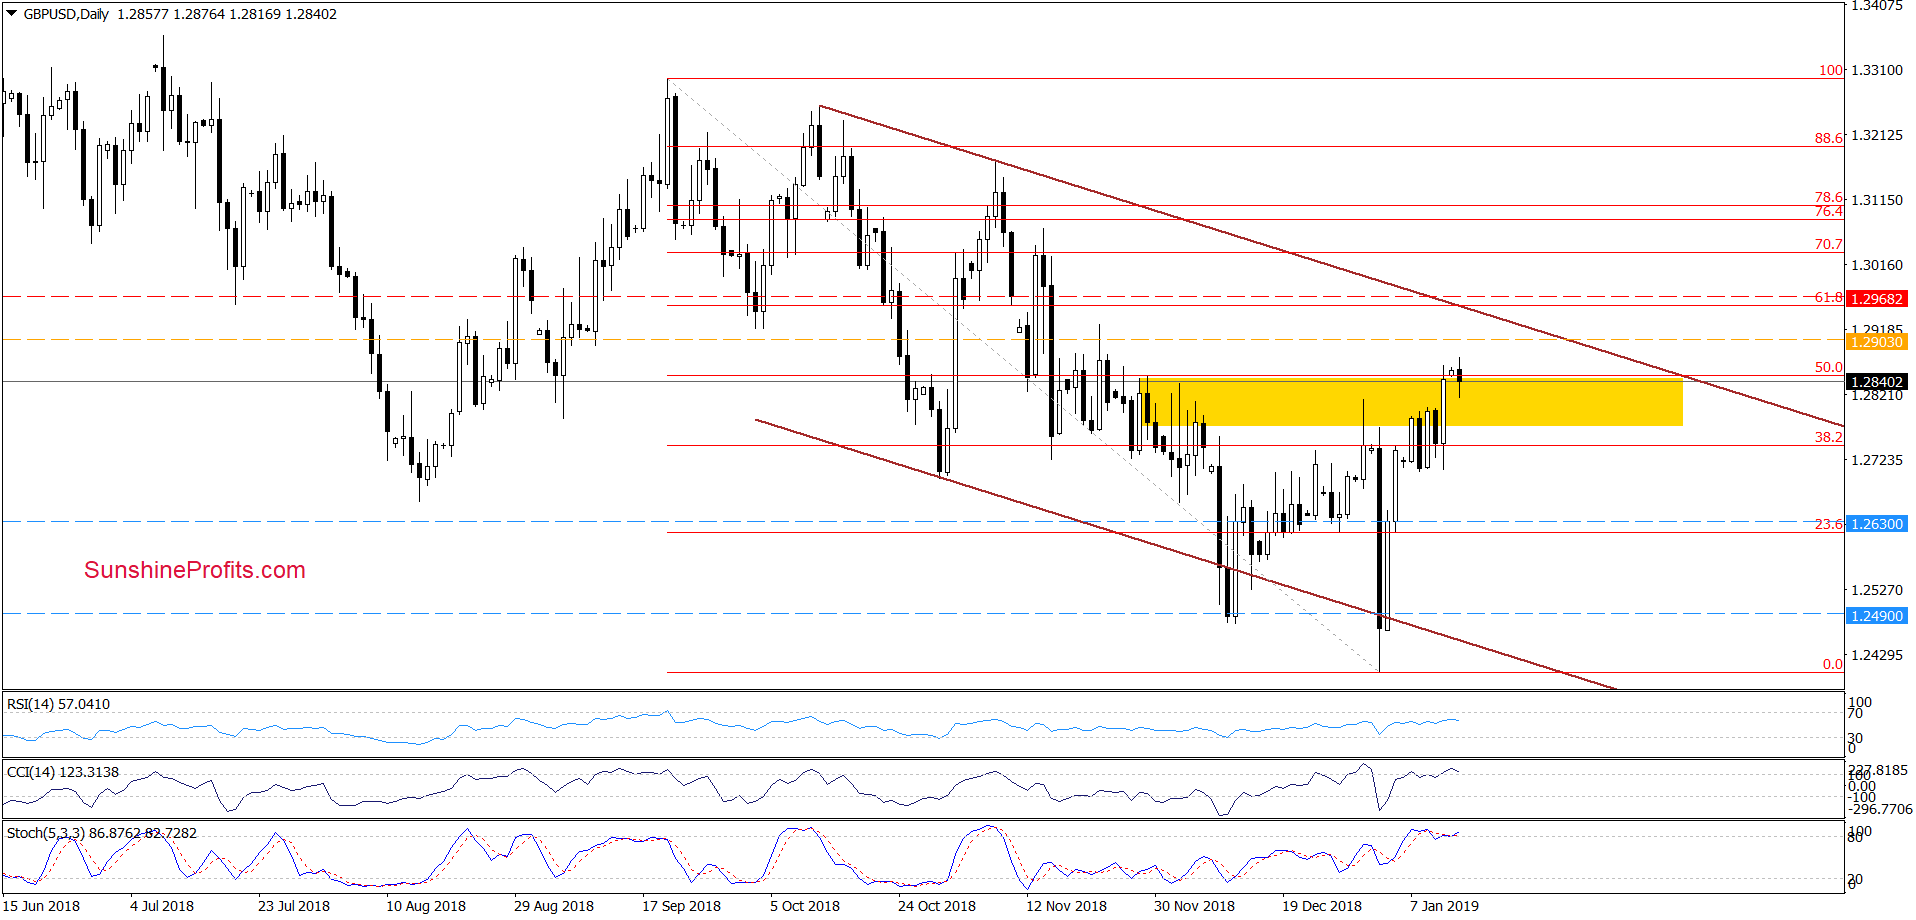
Earlier today, GBP/USD moved a bit higher activating our stop-loss order and closing our positions. Nevertheless, taking into account the overall situation in the exchange rate (an invalidation of a tiny breakout above the 50% Fibonacci retracement and the upper border of the yellow resistance zone and the proximity to the major resistance line – seen on the weekly chart below), we believe that re-opening short positions (at better prices) is justified from the risk/reward perspective.
Trading position (short-term; our opinion): Short positions with a stop-loss order at 1.2968 and the initial downside target at 1.2630 are justified from the risk/reward perspective. We will keep you informed should anything change, or should we see a confirmation/invalidation of the above.
USD/JPY
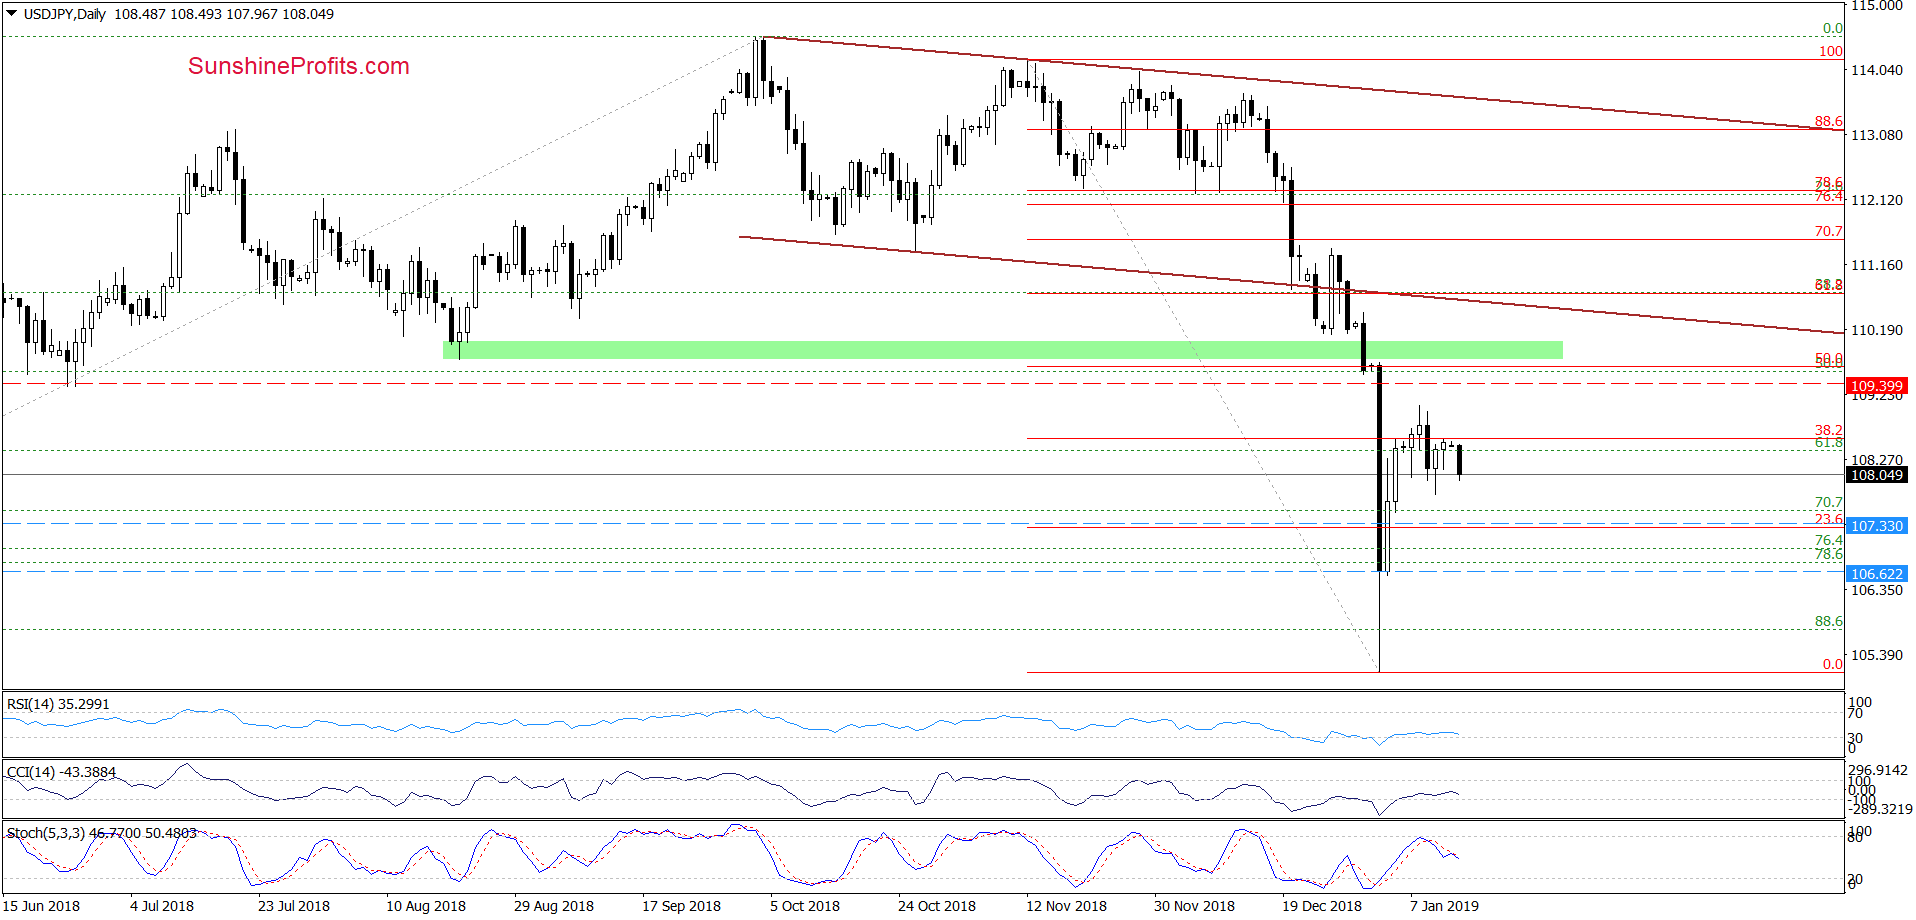
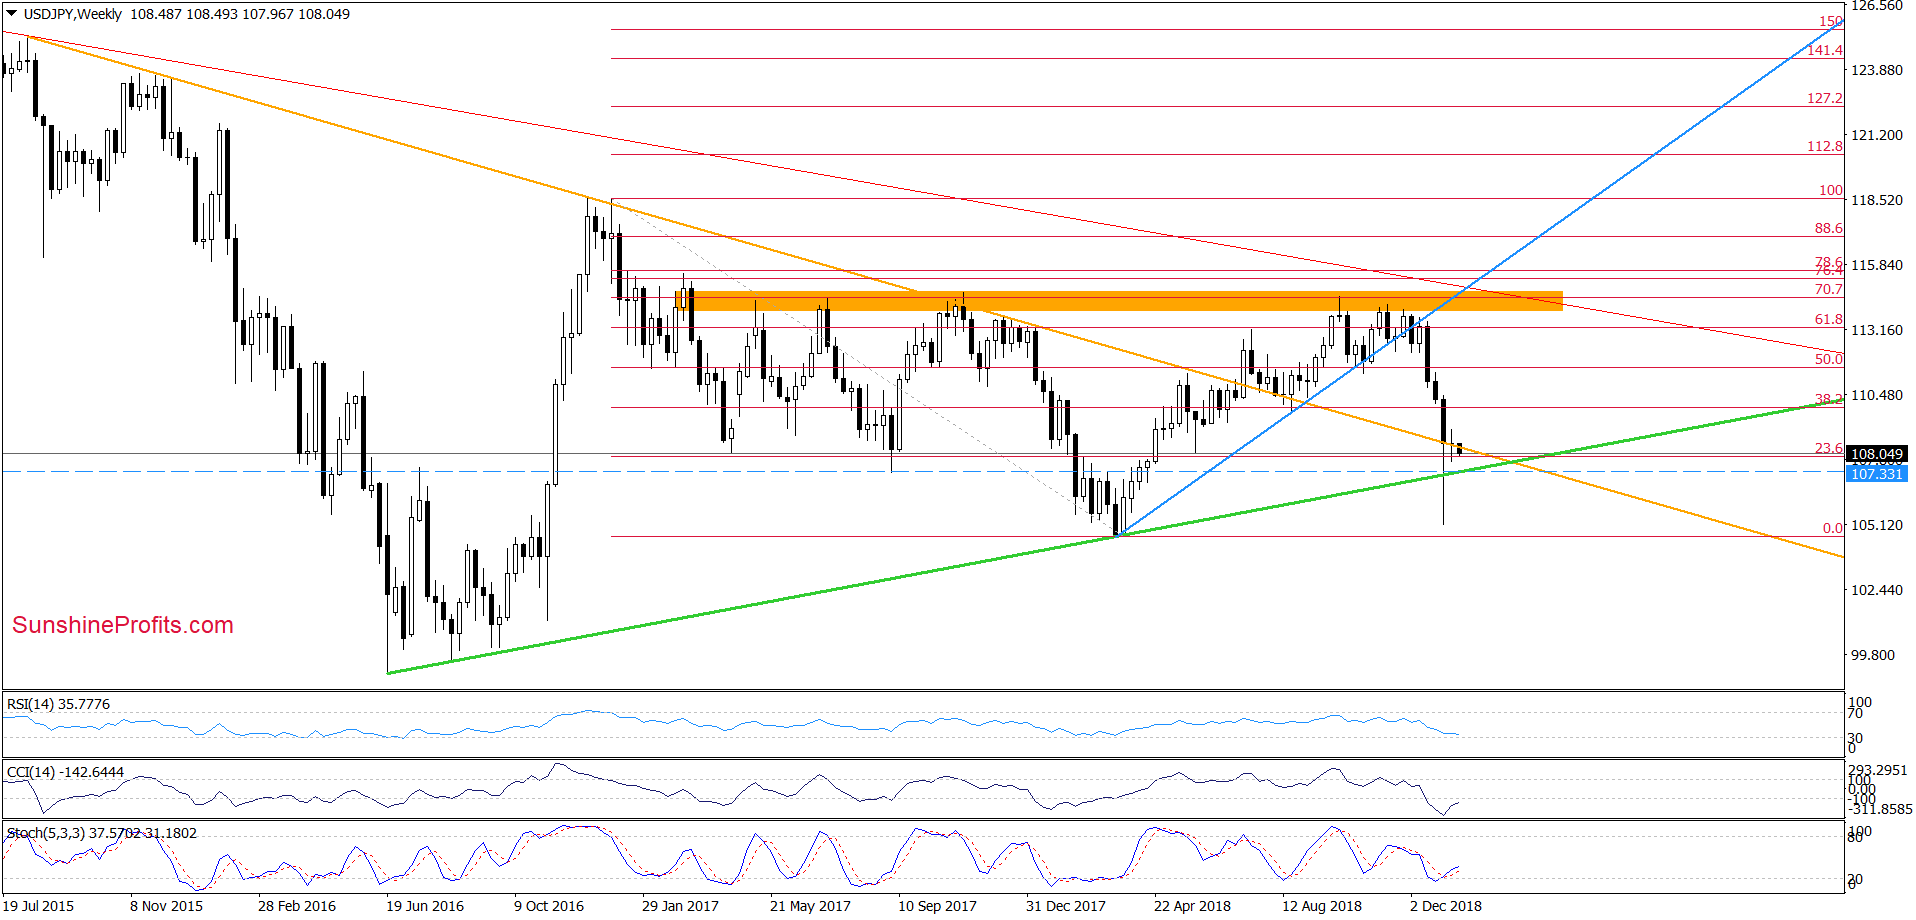
On the above chart, we see that although USD/JPY climbed above the 38.2% Fibonacci retracement (based on the recent sharp decline), currency bulls failed to push the pair higher.
Thanks to this weakness, the exchange rate moved lower and invalidated the mentioned breakout. Although the buyers tried to trigger another increase at the end of the previous week, they didn’t manage to take the exchange rate above the retracement, which resulted in one more downswing earlier today.
Taking this fact into account and combining it with the sell signal generated by the Stochastic Oscillator, we think that the pair will extend losses in the coming week.
If this is the case and USD/JPY moves lower from here, we’ll likely see a drop to (at least) 107.33, where the previously-broken long-term green support line (marked on the weekly chart below) currently is.
Trading position (short-term; our opinion): No positions are justified from the risk/reward perspective. We will keep you informed should anything change, or should we see a confirmation/invalidation of the above.
AUD/USD
On Friday, we wrote the following:
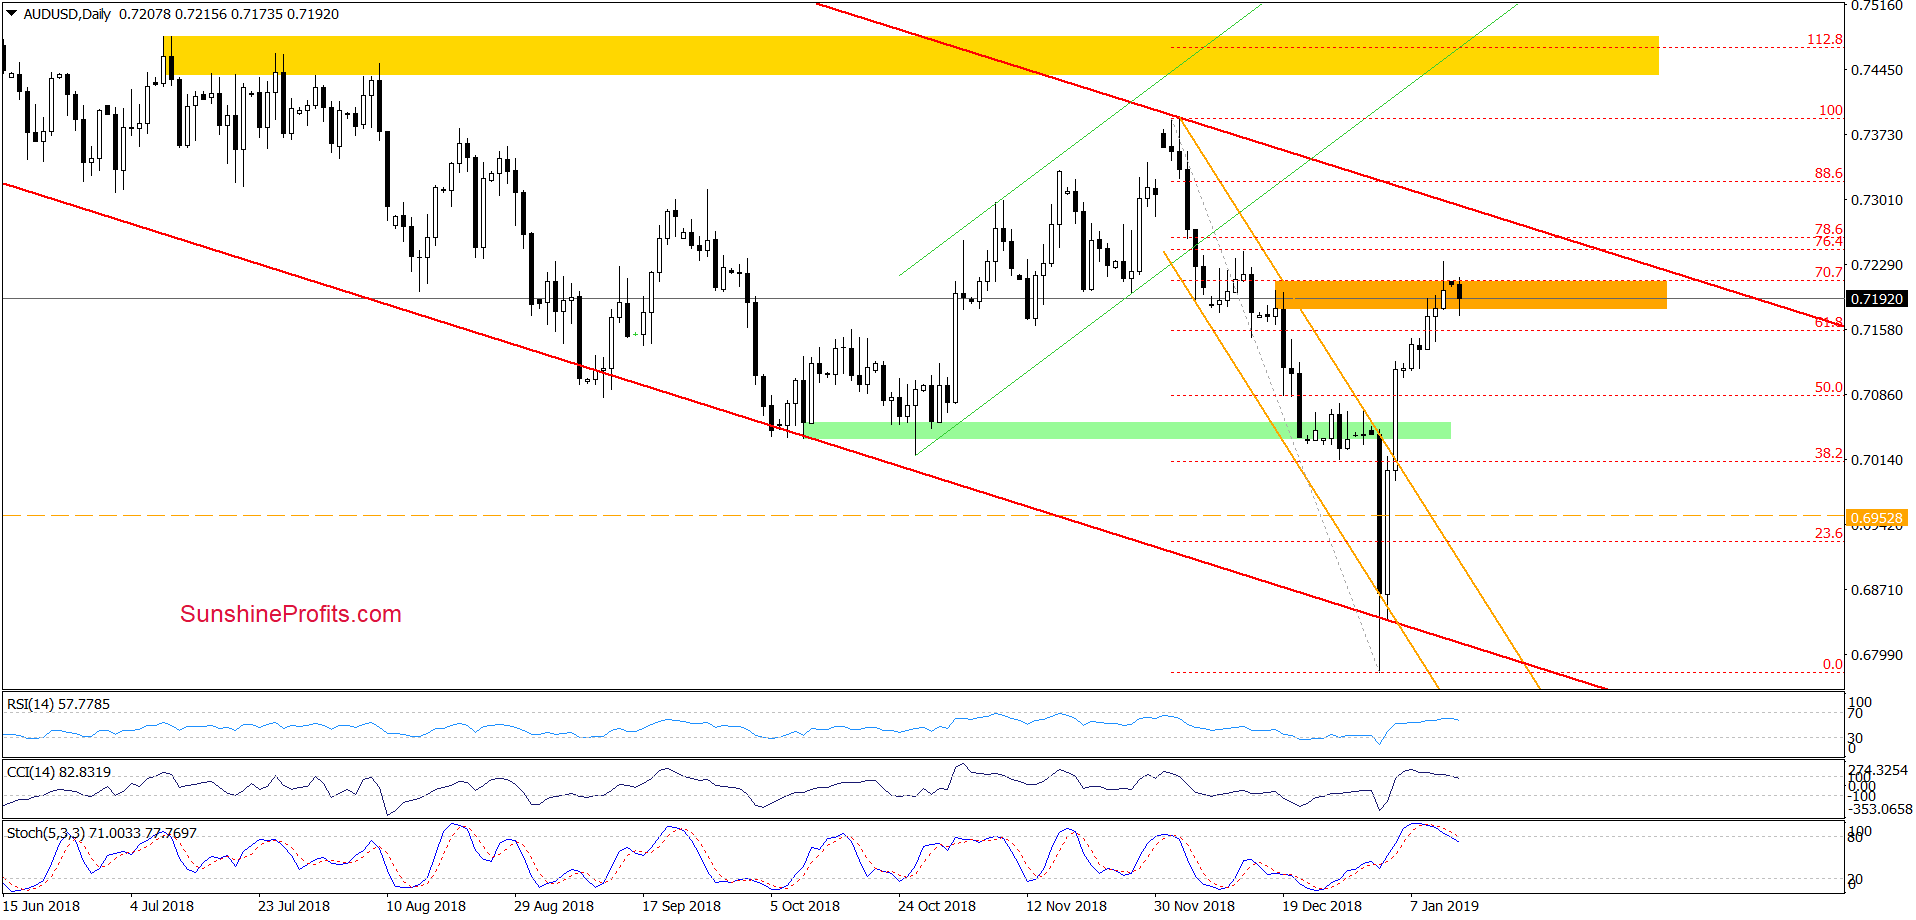
(…) a breakout above the 61.8% Fibonacci retracement and a test of the next retracement and the orange resistance zone based on the mid-December highs.
Despite this improvement, the sellers took control on the trading floor earlier today, which resulted in a pullback and invalidation of today’s breakout above the mentioned resistances. Additionally, the Stochastic Oscillator generated a sell signal (while the CCI is very close to doing the same), increasing the probability of further deterioration in the coming week.
(…) this scenario will be even more likely and reliable if the pair closes today’s session under the 70.7% retracement and the upper border of the orange zone.
From today’s point of view, we see that the situation developed in tune with the above assumption and AUD/USD finished the previous week under the mentioned resistances, invalidating the earlier tiny breakouts.
Earlier today, we saw one more unsuccessful attempt to go higher, which together with the sell signal generated by the CCI suggests that lower values of AUD/USD are ahead of us. Therefore, if the pair extends losses from current levels, we’ll likely see (at least) a test of the previously-broken green support area.
Connecting the dots, we think that opening short positions is justified from the risk/reward perspective.
Trading position (short-term; our opinion): Short positions with a stop-loss order at 0.7288 and the initial downside target at 0.7055 are justified from the risk/reward perspective. We will keep you informed should anything change, or should we see a confirmation/invalidation of the above.
Thank you.
Nadia Simmons
Forex & Oil Trading Strategist
Przemyslaw Radomski, CFA
Editor-in-chief, Gold & Silver Fund Manager

