

Earlier today, the Markit UK manufacturing PMI slipped to 54.6 from 55.7 in January, missing analysts’ forecasts. As a result, GBP/USD dropped under the first support zone, extending yesterday’s losses. Also today, the Australian dollar declined against its U.S. counterpart as expectations for a March rate hike in the U.S. supported the greenback. What happened with our other currency pairs?
In our opinion the following forex trading positions are justified - summary:
- EUR/USD: short (a stop-loss order at 1.0735; the initial downside target at 1.0388)
- GBP/USD: short (a stop-loss order at 1.2590; the initial downside target at 1.2262)
- USD/JPY: long (a stop-loss order at 111; the initial upside target at 115.43)
- USD/CAD: long (a stop-loss order at 1.2949; the next upside target at 1.3424)
- USD/CHF: long (a stop-loss order at 0.9891; the initial upside target at 1.0180)
- AUD/USD: none
EUR/USD
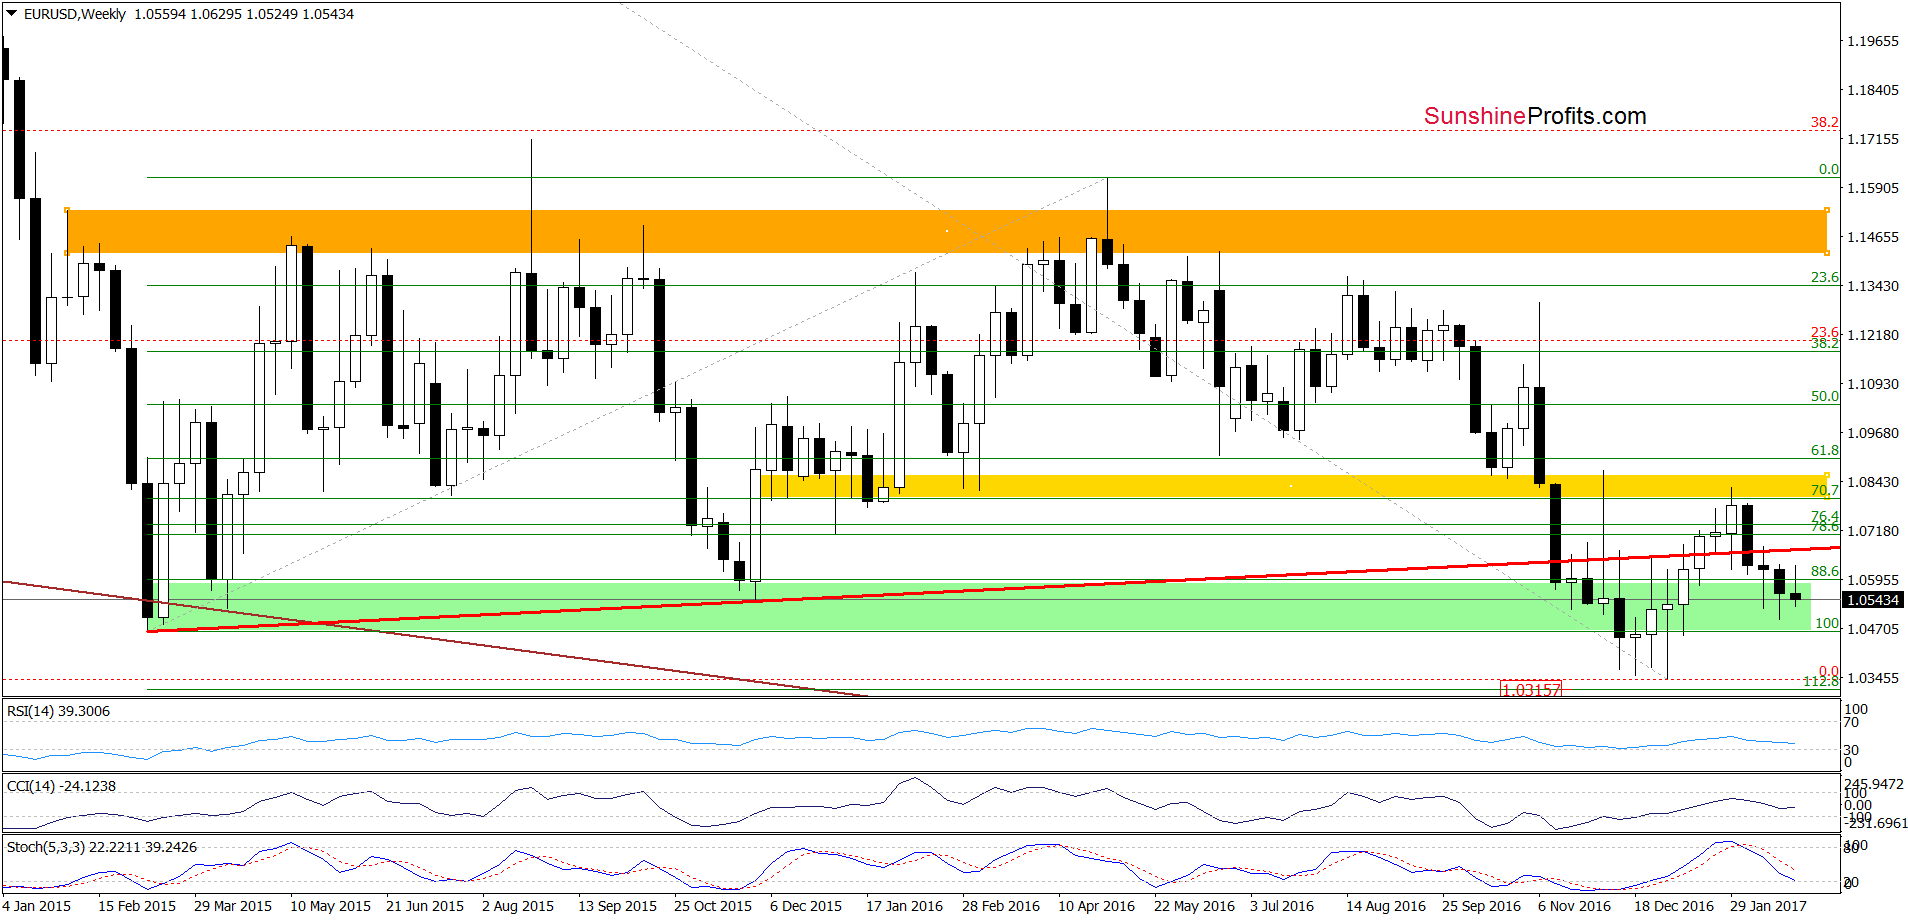
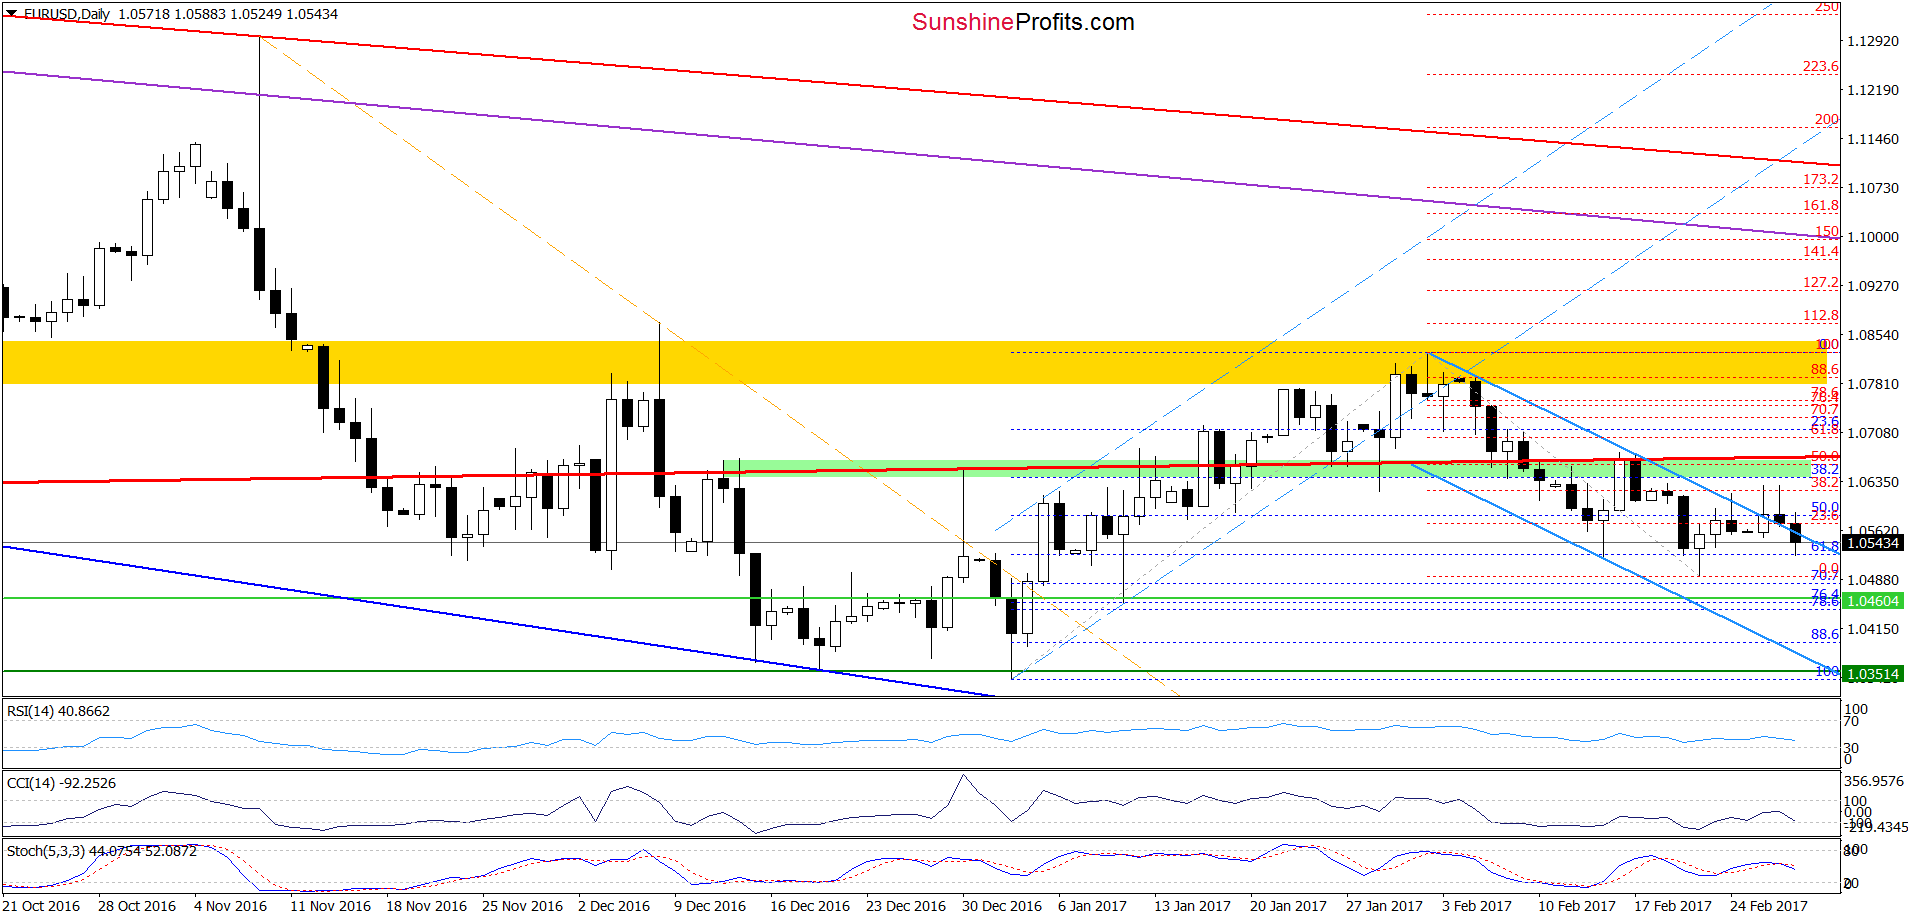
Yesterday, EUR/USD increased above the upper border of the blue declining trend channel once again, but currency bulls didn’t manage to hold gained levels, which resulted in another pullback. As a result, the exchange rate came back to the declining trend channel, invalidating the earlier breakout. Today, the pair extended losses, which means that what we wrote yesterday is up-to-date:
(…) the sell signals generated by the weekly indicators remain in place, suggesting that reversal is just around the corner. If this is the case, we’ll likely see a drop to around 1.0460 (the 76.4% and 78.6% Fibonacci retracements) or even to the lower border of the blue tend channel in the coming days.
Very short-term outlook: bearish
Short-term outlook: mixed with bearish bias
MT outlook: mixed
LT outlook: mixed
Trading position (short-term; our opinion): Short positions with a stop-loss order at 1.0735 and the initial downside target at 1.0388 are justified from the risk/reward perspective. We will keep you informed should anything change, or should we see a confirmation/invalidation of the above.
GBP/USD
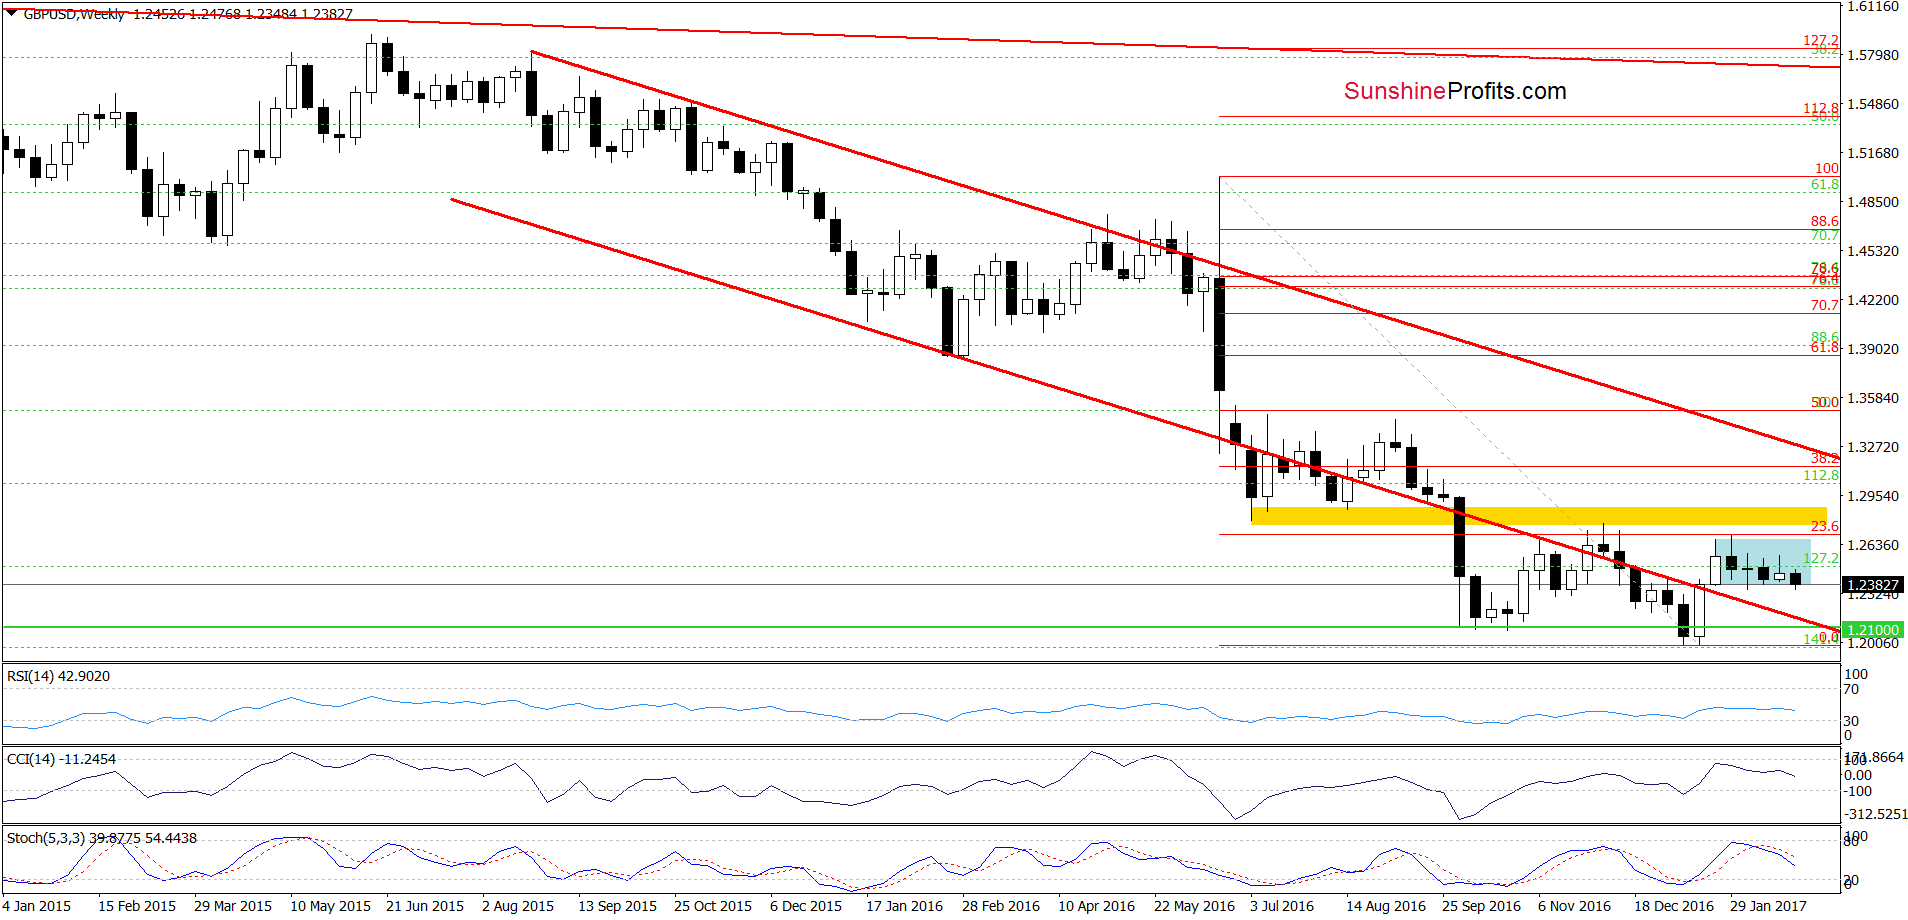
On the weekly chart, we see that the overall situation hasn’t changed much as GBP/USD is still trading in the blue consolidation. However, earlier today, the pair slipped temporary under the lower line of the formation. Will we see further deterioration? Let’s take a closer look at the daily chart below and find out.
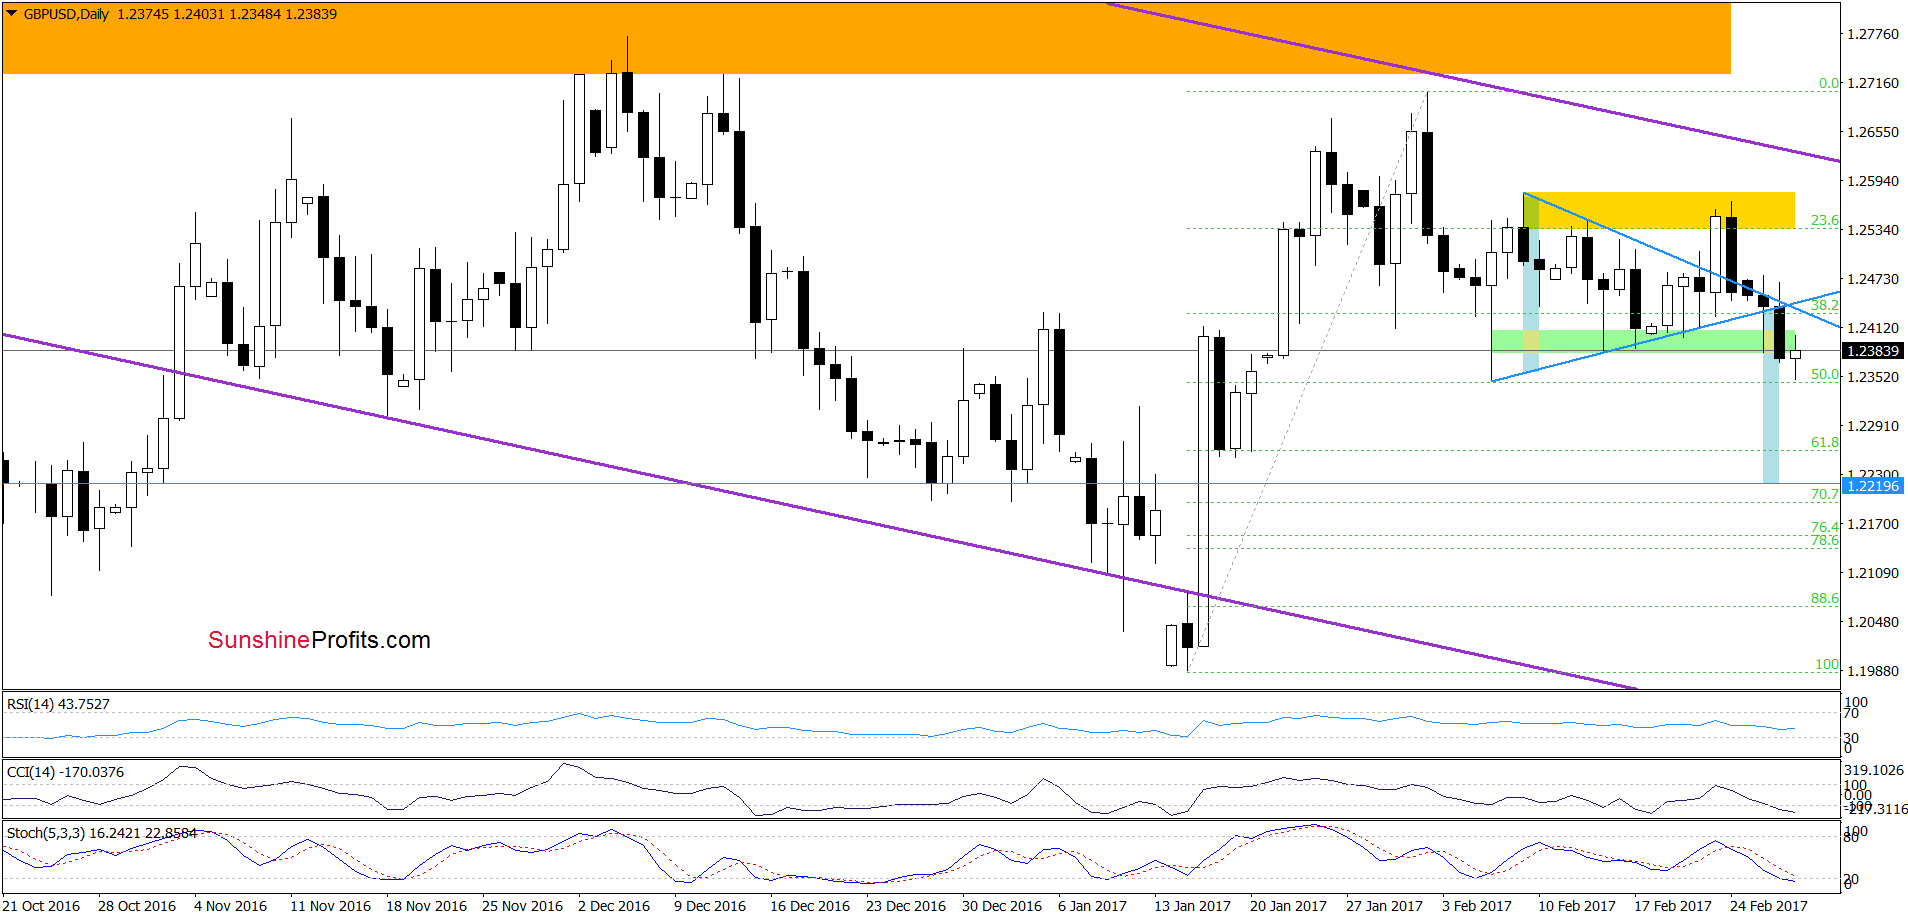
On the daily chart, we see that although GBP/USD invalidated the breakdown under the lower border of the triangle on Monday and increased above the upper line of the formation yesterday, this improvement was very temporary and currency bears took control. As a result, the exchange rate extended losses and closed yesterday’s session not only under the lower border of the triangle, but also below the green support zone. This is a bearish signal, which suggests further deterioration in the coming days – even if the pair re-tests upper/lower border of the mentioned formation. Taking the above into account, we think that opening short positions is justified from the risk/reward perspective as GBP/USD will decline to at least the 6.8% Fibonacci retracement (at 1.2262) or even to around 1.2220, where the size of the downward move will correspond to the height of the triangle.
Very short-term outlook: bearish
Short-term outlook: mixed with bearish bias
MT outlook: mixed
LT outlook: mixed
Trading position (short-term; our opinion): Short positions (with a stop-loss order at 1.2590 and the initial downside target at 1.2262) are justified from the risk/reward perspective. We will keep you informed should anything change, or should we see a confirmation/invalidation of the above.
USD/JPY
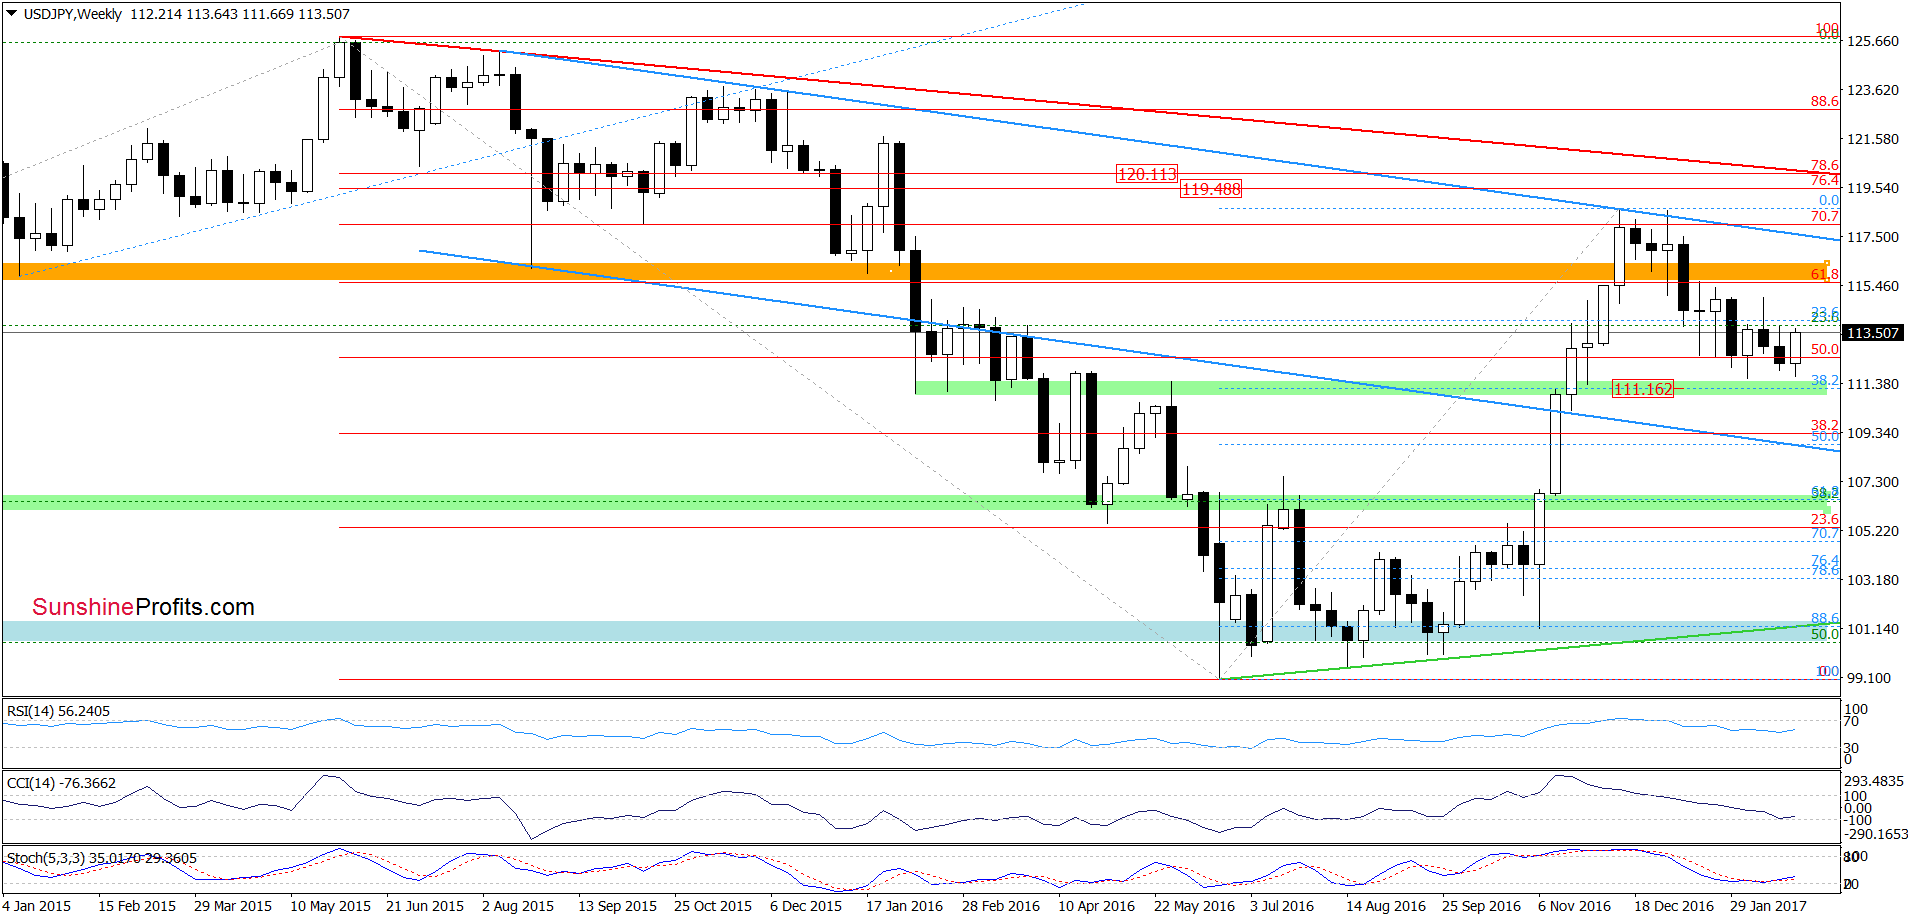
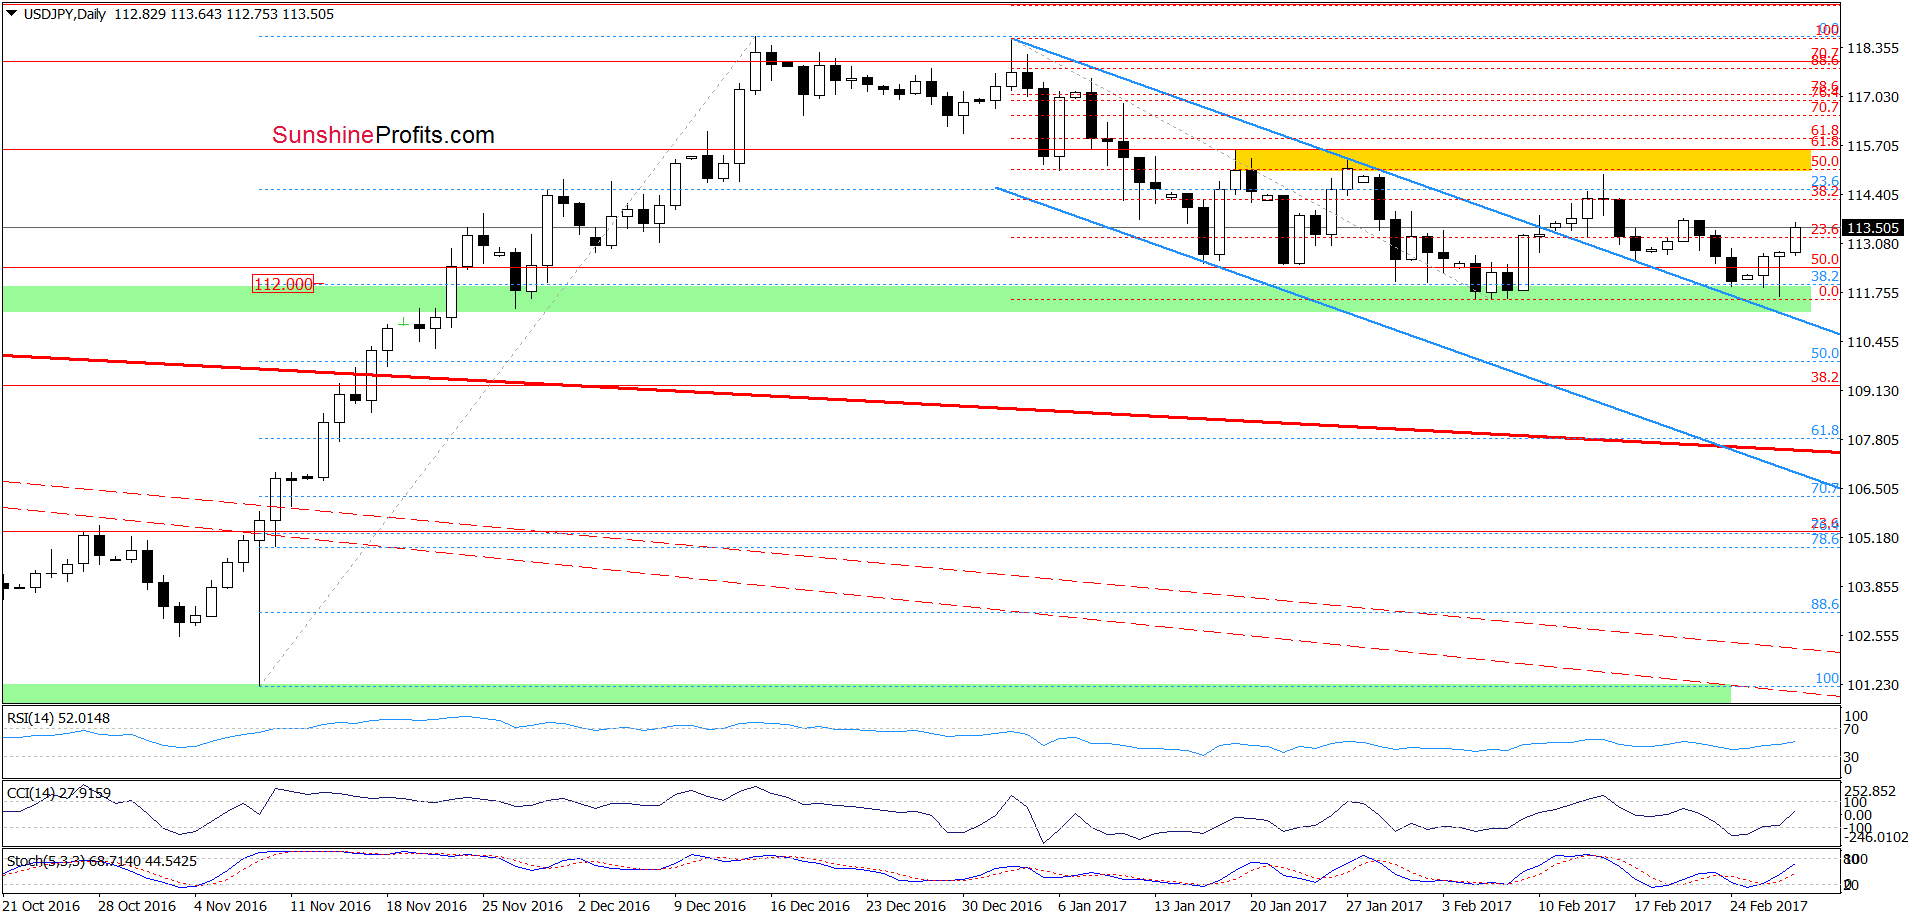
On the above charts, we see that USD/JPY rebounded, which means that our yesterday's commentary is up-to-date also today:
(…) USD/JPY moved lower, which looks like another re-test of the strength of the green support zone. Additionally, slightly below current levels is also the previously-broken upper border of the blue declining trend channel, which together with the position of the indicators suggest that the space for declines is limited and reversal is just around the corner. If this is the case and the pair rebounds in the following days, the initial upside target will be the yellow resistance zone.
Very short-term outlook: bullish
Short-term outlook: mixed with bullish bias
MT outlook: mixed
LT outlook: mixed
Trading position (short-term; our opinion): Long positions (with a stop-loss order at 111 and the initial upside target at 115.43) are justified from the risk/reward perspective. We will keep you informed should anything change, or should we see a confirmation/invalidation of the above.
USD/CAD
Quoting our Monday’s alert:
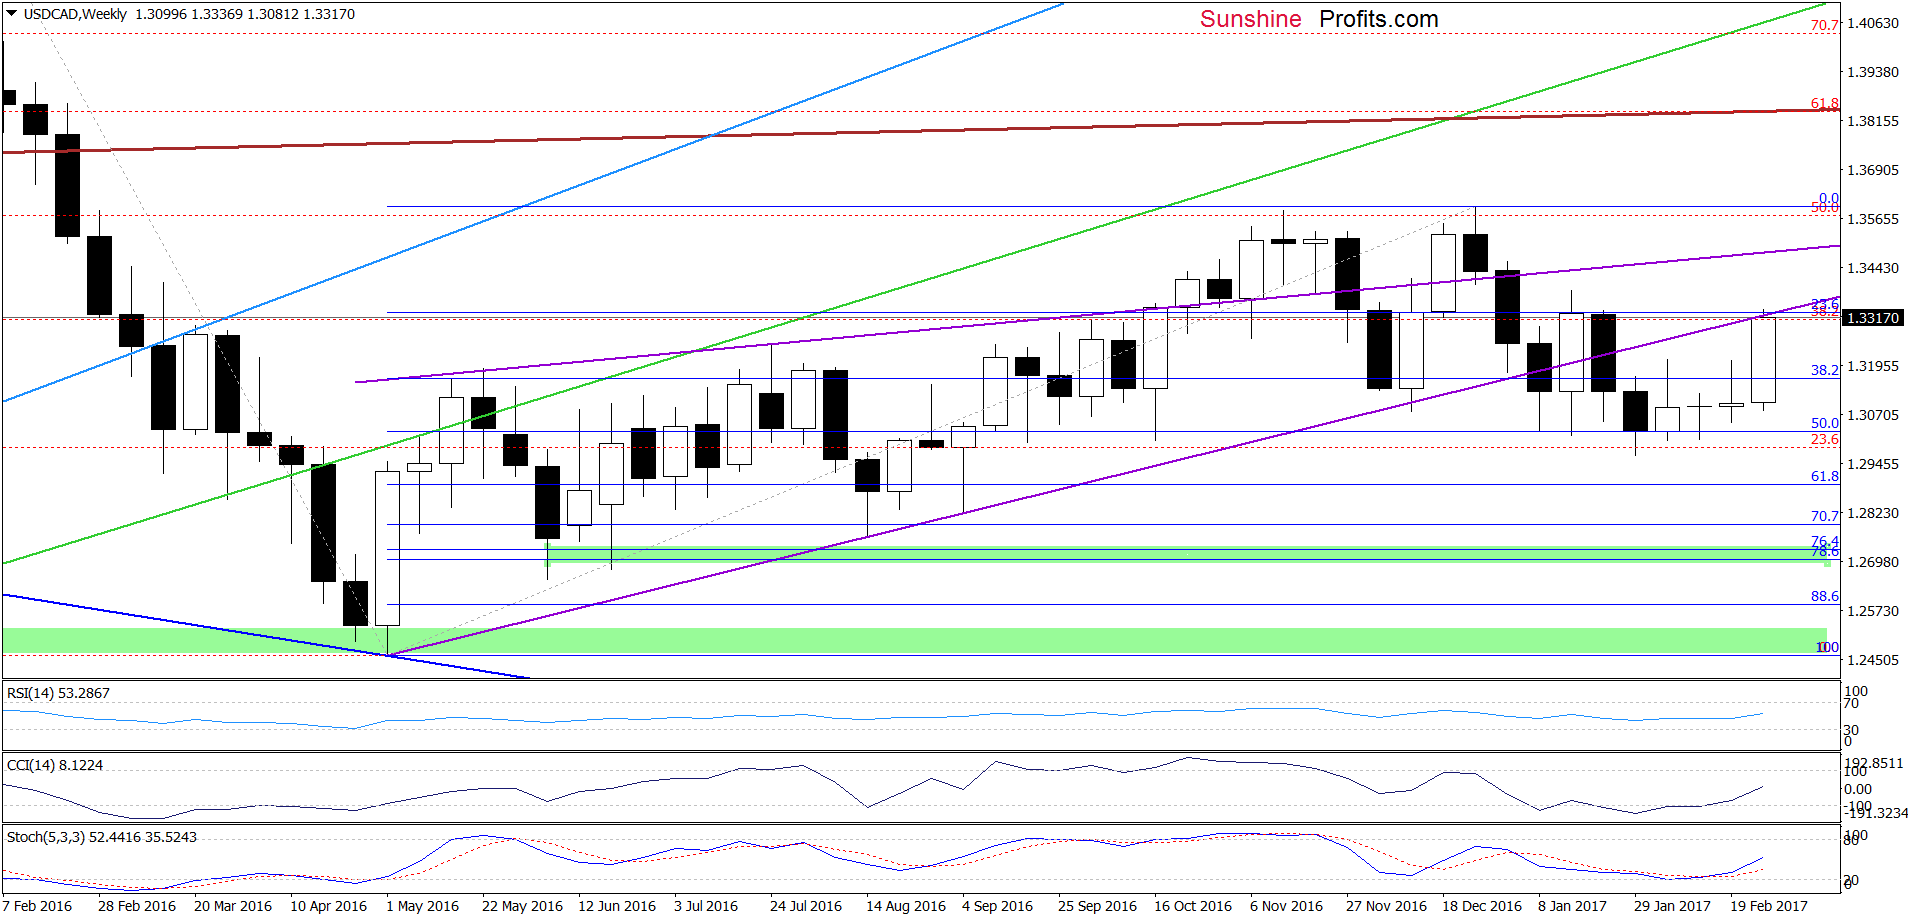
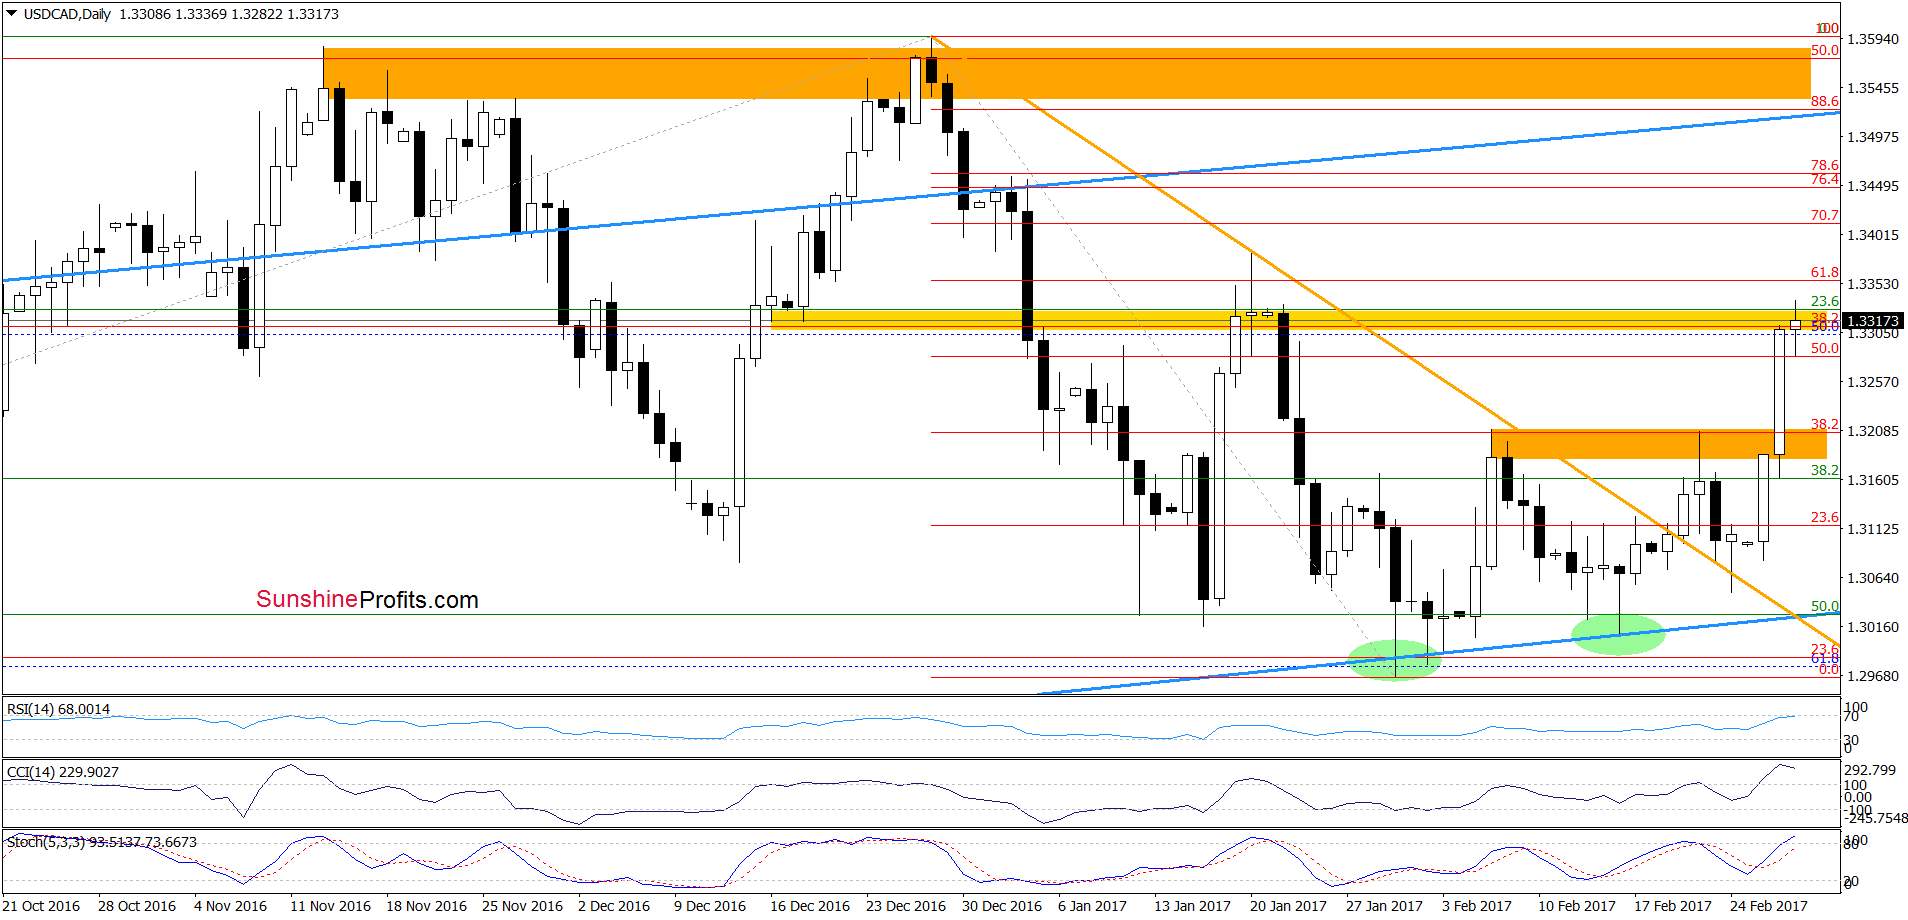
(…) USD/CAD moved higher in the previous days. Additionally, the Stochastic Oscillator is very close to re-generate a buy signal, which suggests higher values of the exchange rate in the coming days. If the pair moves higher from current levels, the initial upside target will be the resistance area created by the February 7 high and the 38.2% Fibonacci retracement.
From today’s point of view, we see that currency bulls not only pushed USD/CAD to the above-mentioned upside target, but also took the exchange rate to the yellow resistance zone, making our long positions more profitable. Will we see further improvement? Although the daily CCI and the Stochastic Oscillator climbed to their overbought areas, we think that as long as there are no sell signals another attempt to move higher is likely. If this is the case and USD/CAD increases from here, invalidating the earlier breakdown under the lower border of the purple rising trend channel seen on the weekly chart, we’ll see a move to around 1.3445, where the next resistance zone (created by the 76.4% and 78.6% Fibonacci retracements) is.
Very short-term outlook: bullish
Short-term outlook: mixed with bullish bias
MT outlook: mixed
LT outlook: mixed
Trading position (short-term; our opinion): Long positions (with a stop-loss order at 1.2949 and the next upside target at 1.3424) are justified from the risk/reward perspective. We will keep you informed should anything change, or should we see a confirmation/invalidation of the above.
USD/CHF
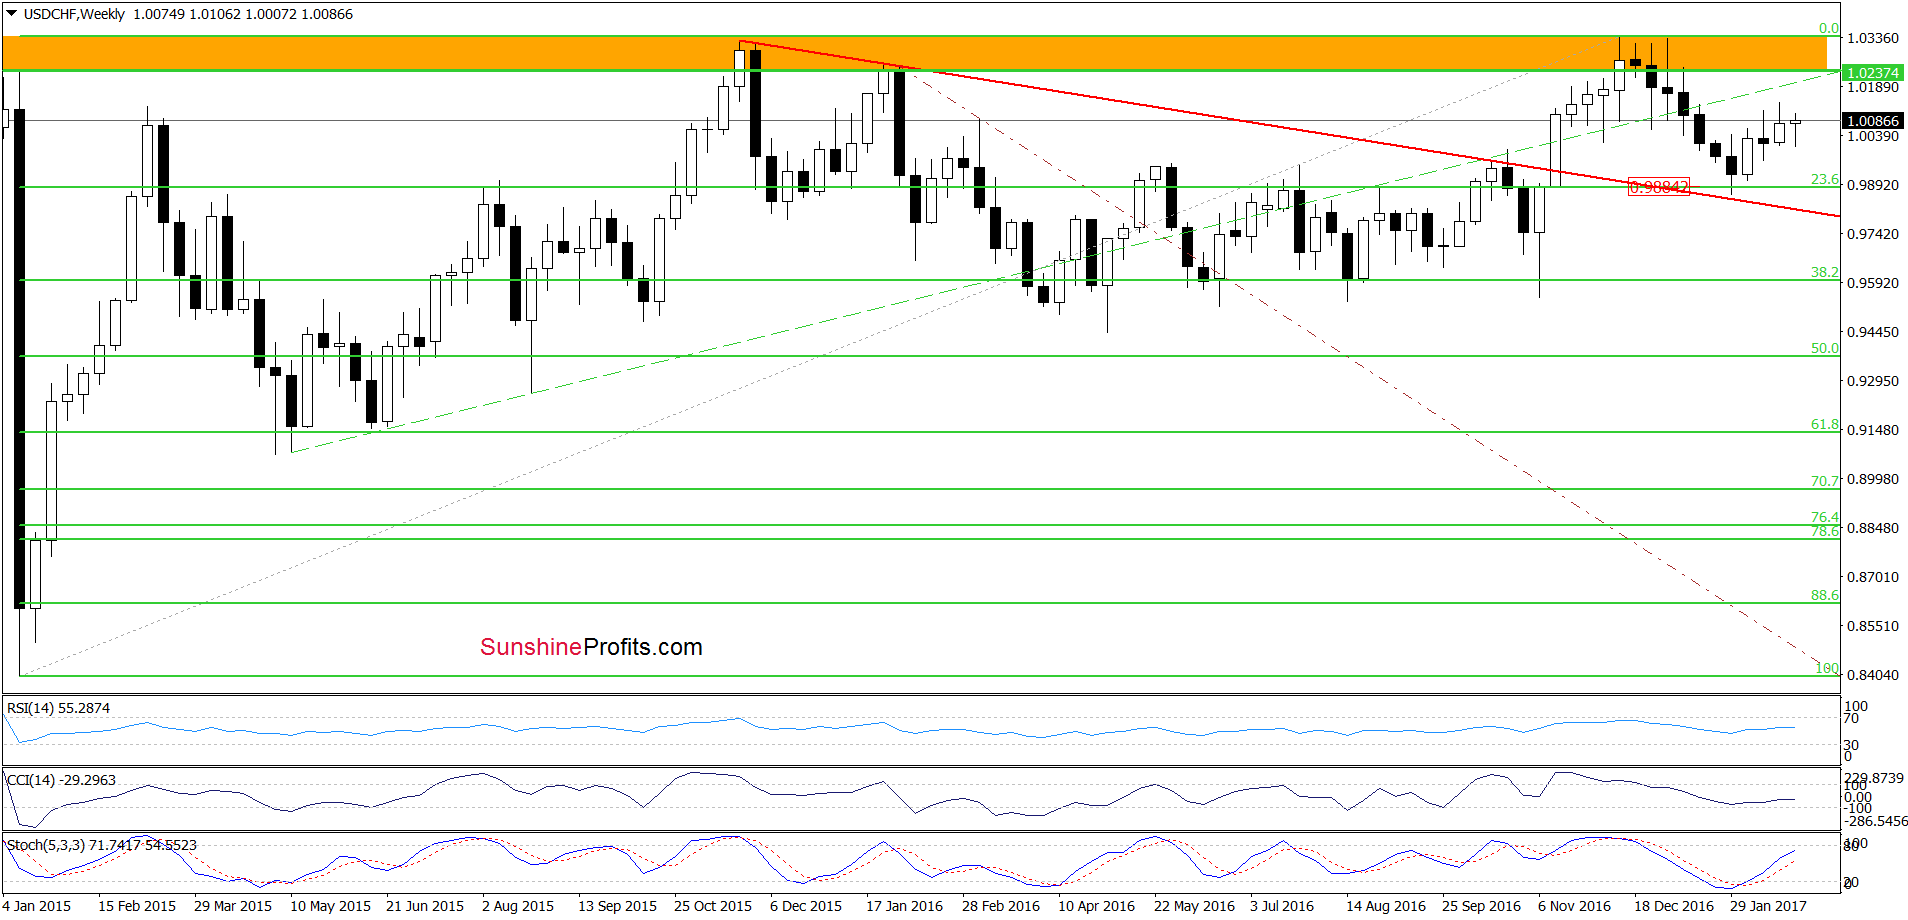
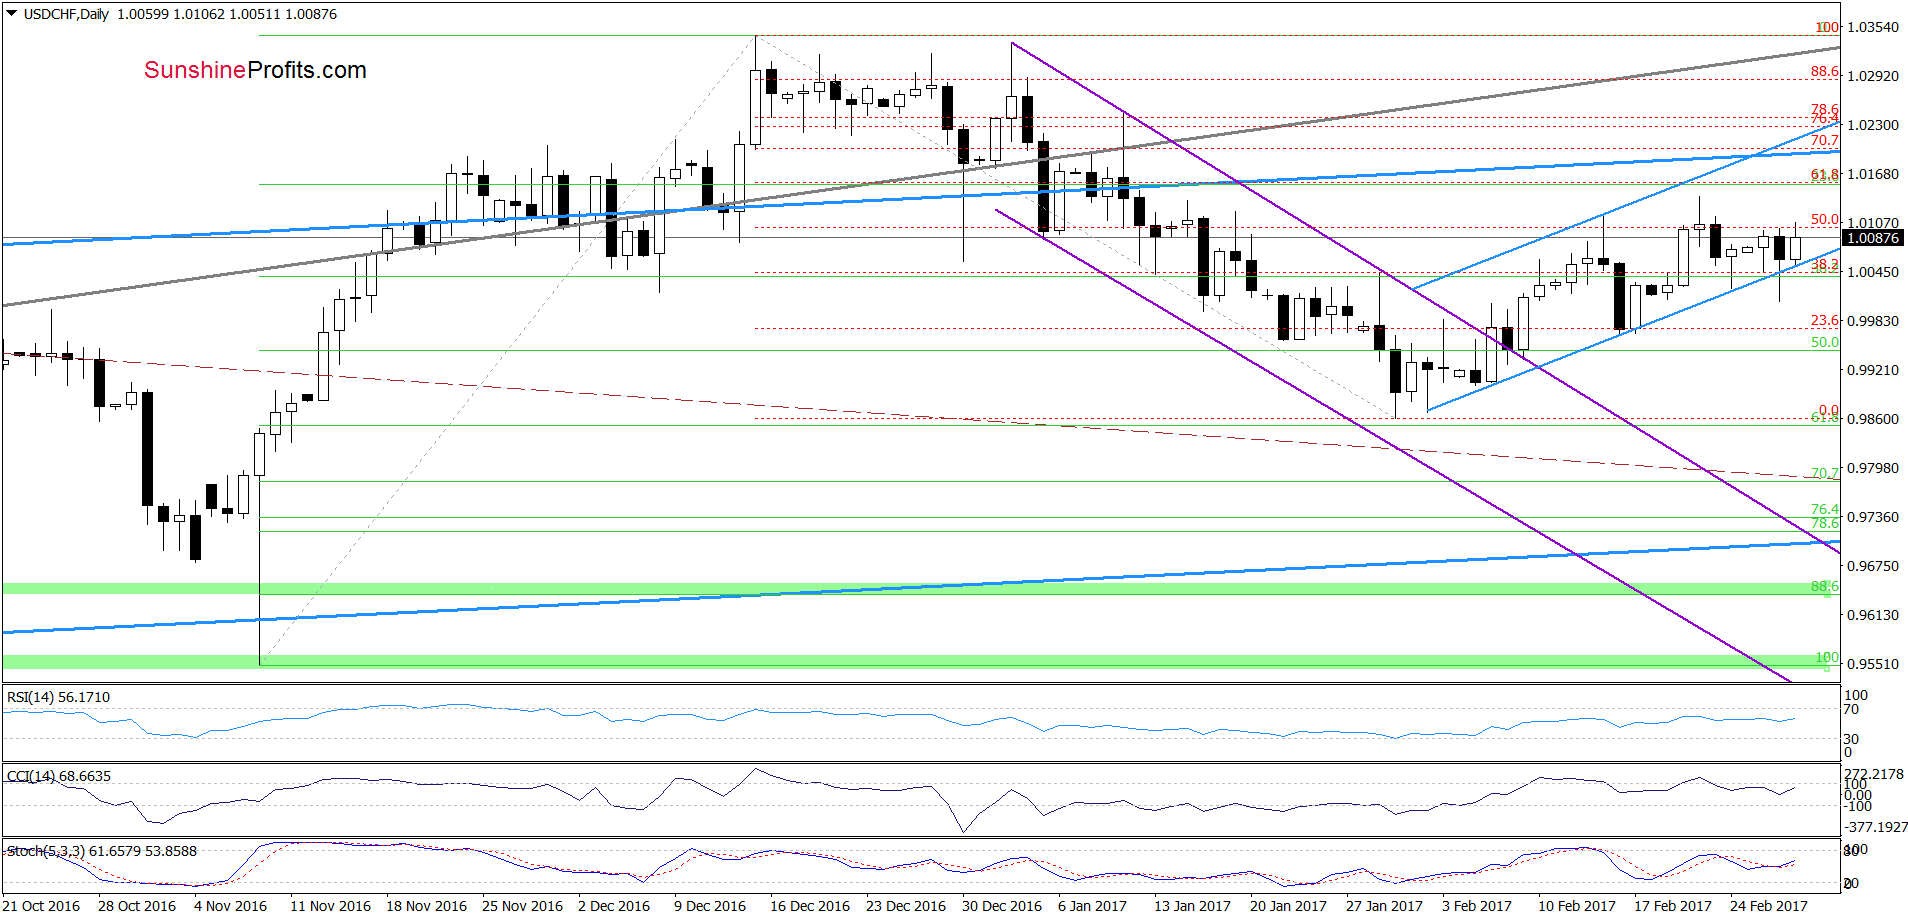
On the daily chart, we see that although USD/CHF slipped under the lower border of the blue rising trend channel yesterday, this deterioration was very temporary and the pair rebounded, invalidating the earlier breakdown. Earlier today, this positive event triggered further improvement, which suggests that we’ll see a test of the upper line of the formation in the following days.
Very short-term outlook: bullish
Short-term outlook: mixed with bullish bias
MT outlook: mixed
LT outlook: mixed
Trading position (short-term; our opinion): Long positions with a stop-loss order at 0.9891 and the initial upside target at 1.0180 are justified from the risk/reward perspective. We will keep you informed should anything change, or should we see a confirmation/invalidation of the above.
AUD/USD
Yesterday, we wrote the following:
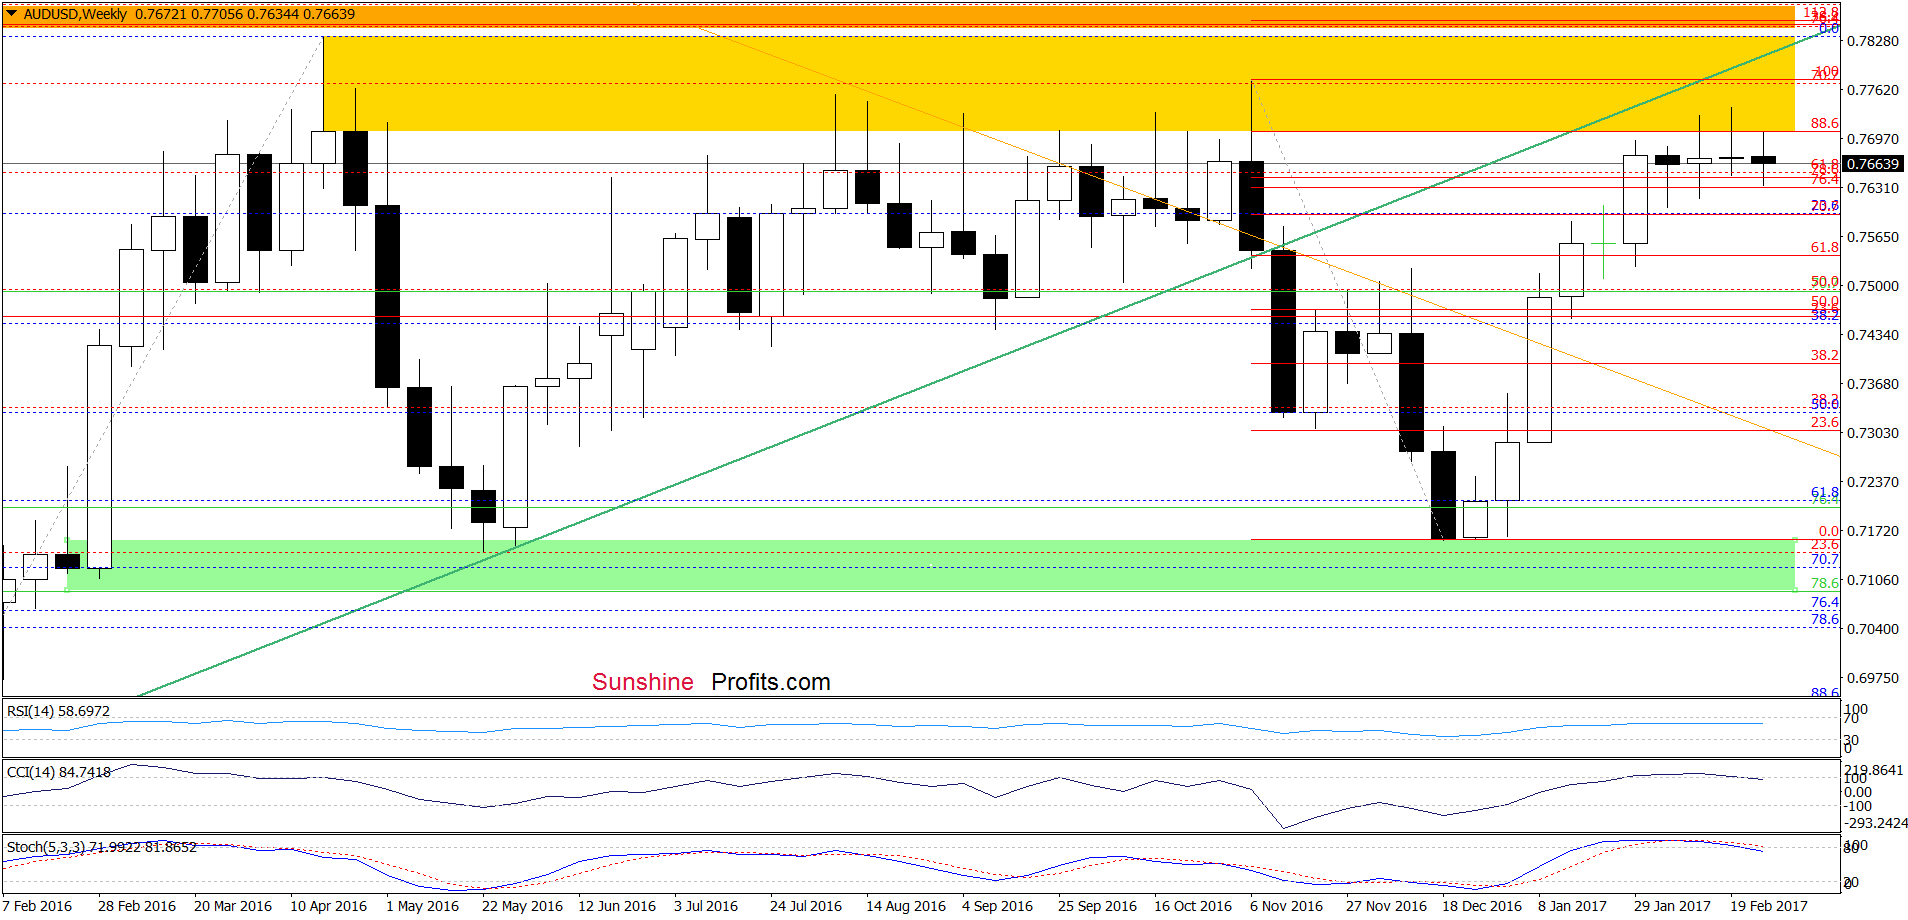
(…) the exchange rate is still trading in the red rising trend channel. Nevertheless, taking into account the sell signals generated by the indicators and the medium-term picture, we think that the pair will test the lower border of the formation in very near future.
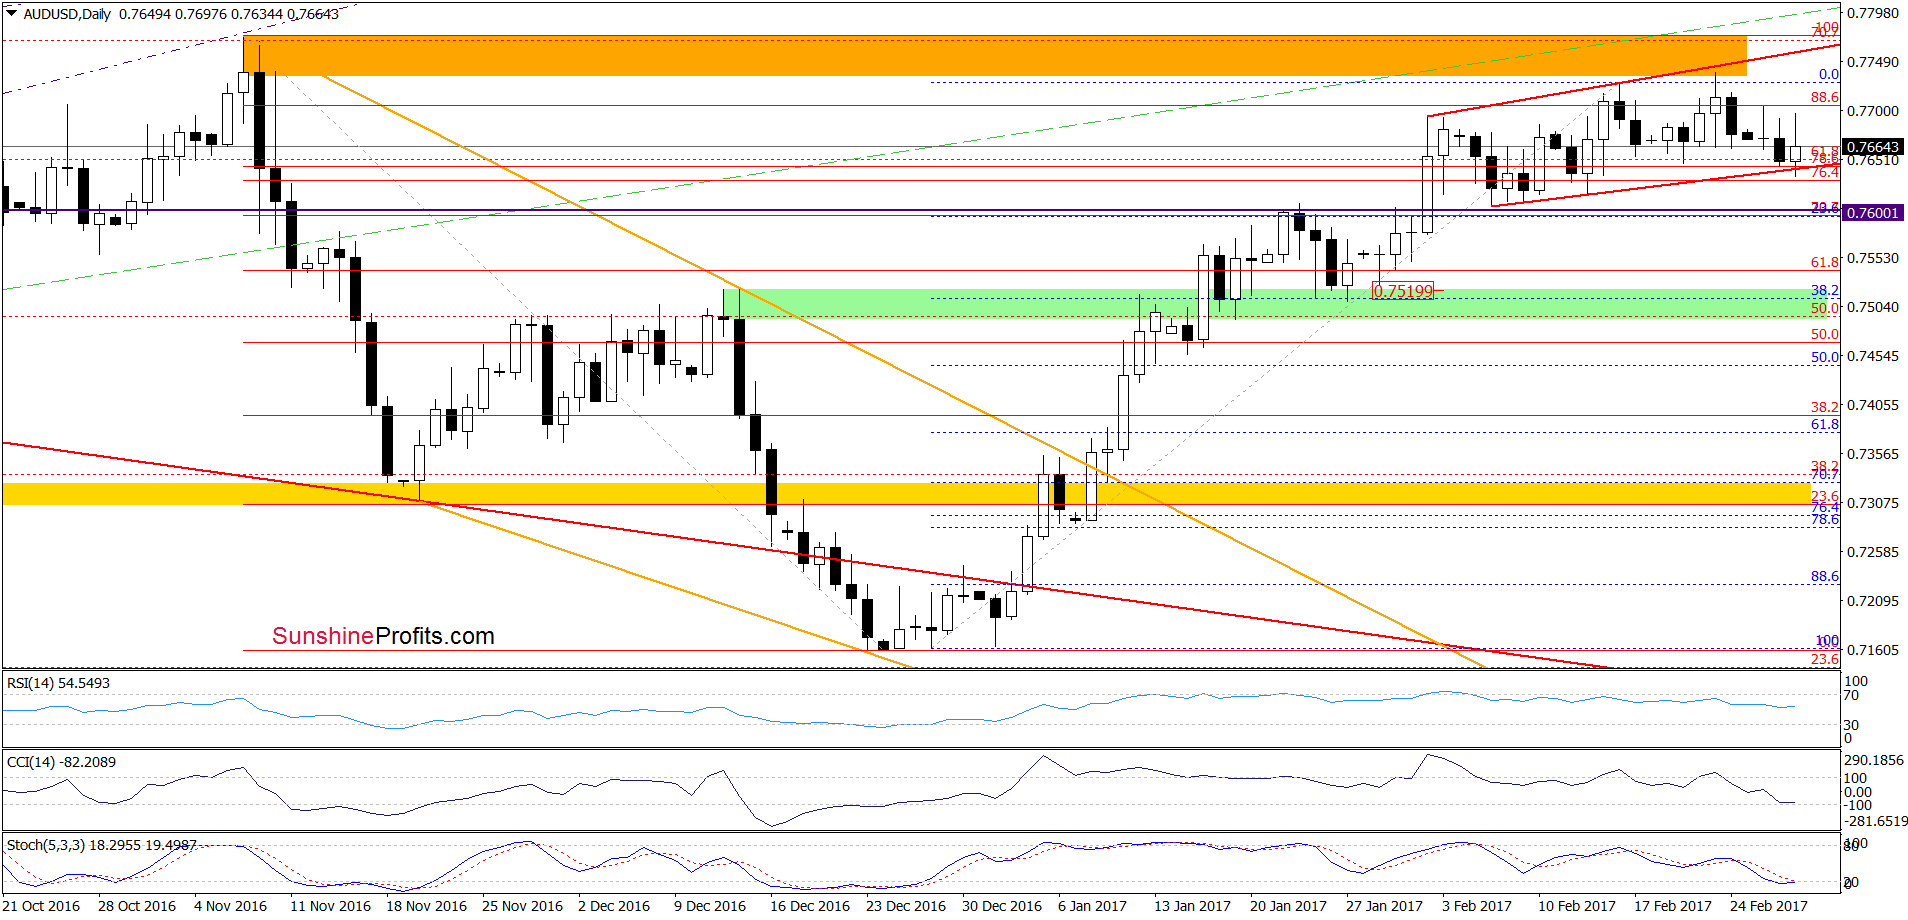
Looking at the daily chart, we see that although AUD/USD declined yesterday (as we had expected), the lower border of the red rising trend channel triggered a rebound earlier today. Additionally, the CCI and the Stochastic Oscillator are very close to generating buy signals, which suggests that we may see a re-test of the recent highs.
Nevertheless, in our opinion, the space for increases is limited as AUD/USD is still trading below the yellow resistance zone. As you see on the weekly chart, this area was strong enough to stop currency bulls several times in the past, which suggests that another attempt to move lower may be just around the corner. This scenario is also reinforced by the current position of the indicators – the CCI and the Stochastic Oscillator generated the sell signals, supporting lower prices of the exchange rate.
Very short-term outlook: mixed with bearish bias
Short-term outlook: mixed with bearish bias
MT outlook: mixed
LT outlook: mixed
Trading position (short-term; our opinion): No positions are justified from the risk/reward perspective. However, if AUD/USD closes the day under the lower border of the red rising trend channel, we’ll consider opening short positions. As always - we will keep you informed should anything change, or should we see a confirmation/invalidation of the above.
Thank you.
Nadia Simmons
Forex & Oil Trading Strategist
Przemyslaw Radomski, CFA
Founder, Editor-in-chief, Gold & Silver Fund Manager
Gold & Silver Trading Alerts
Forex Trading Alerts
Oil Investment Updates
Oil Trading Alerts

