

Earlier today, the ADP report showed that non-farm private employment increased by 147,000 in the previous month, missing forecasts for an increase of 165,000 and disappointing market participants. In this environment, the USD Index extended losses and dropped under the mid-Oct lows. How did this drop affect the euro, pound and yen?
In our opinion the following forex trading positions are justified - summary:
- EUR/USD: none
- GBP/USD: none
- USD/JPY: none
- USD/CAD: none
- USD/CHF: none
- AUD/USD: short (a stop-loss order at 0.7769; initial downside target at 0.7542)
EUR/USD
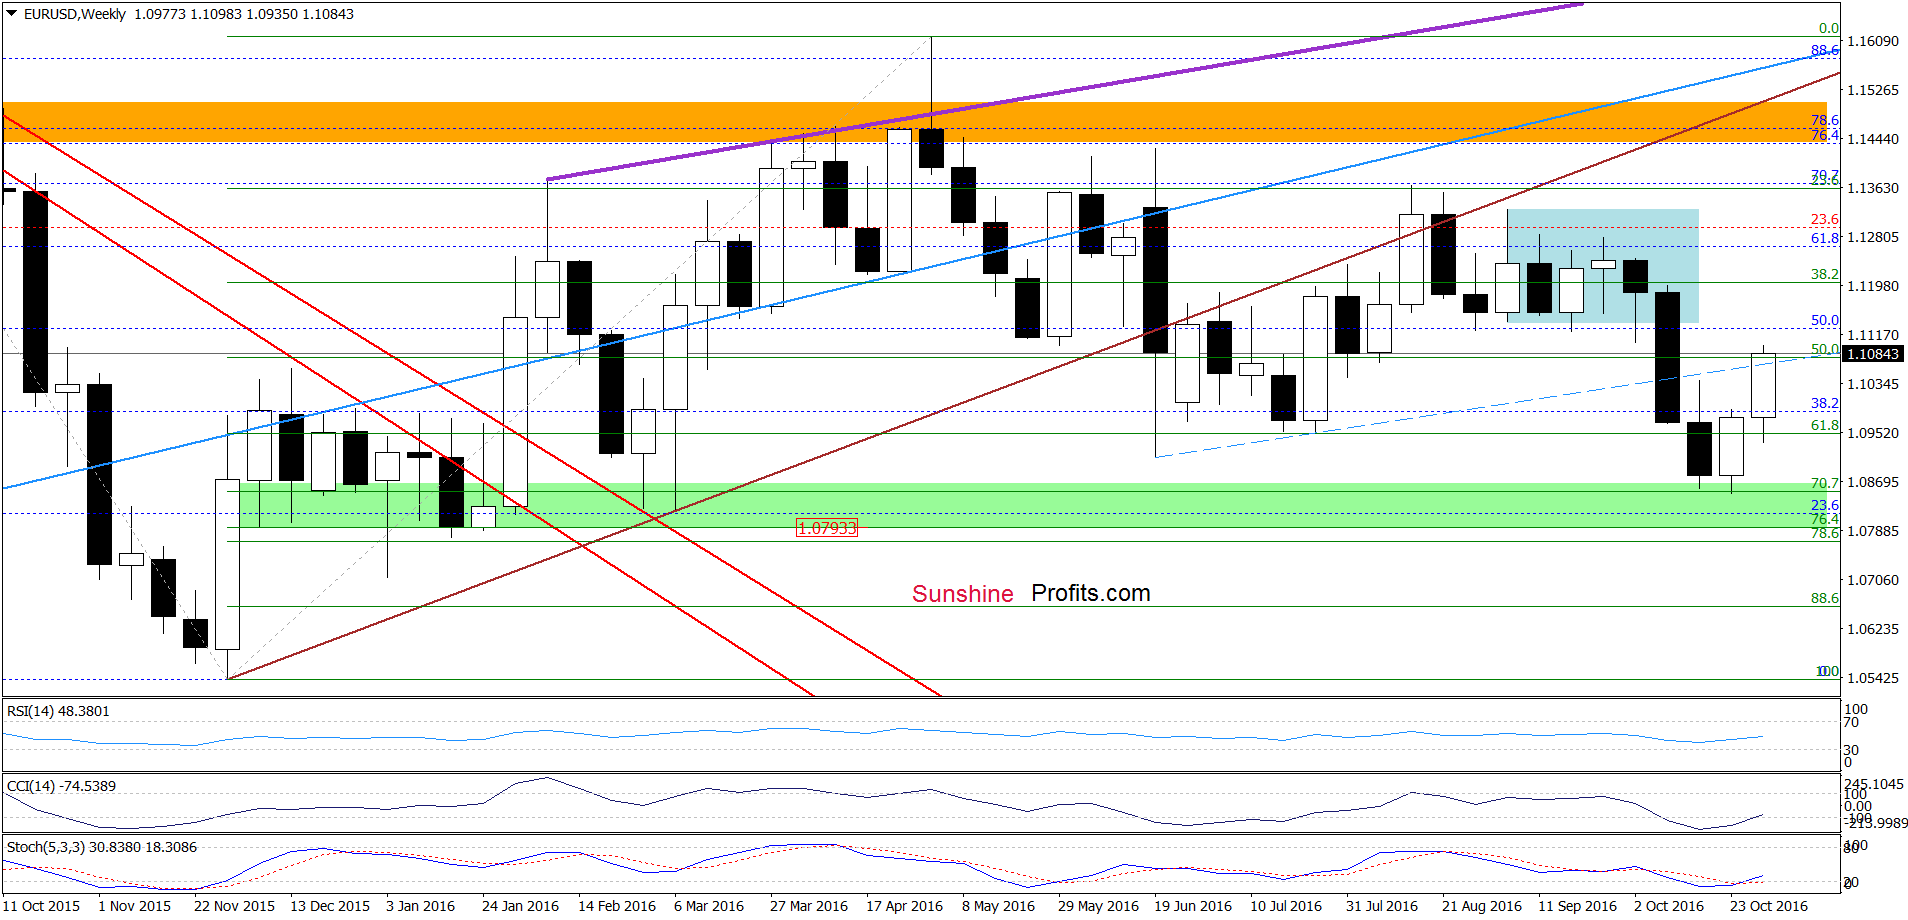
Looking at the weekly chart, we see that EUR/USD extended gains and climbed above the previously-broken blue dashed resistance line, which suggests further improvement.
How high could the exchange rate go? Let’s examine the very short-term picture and find out.
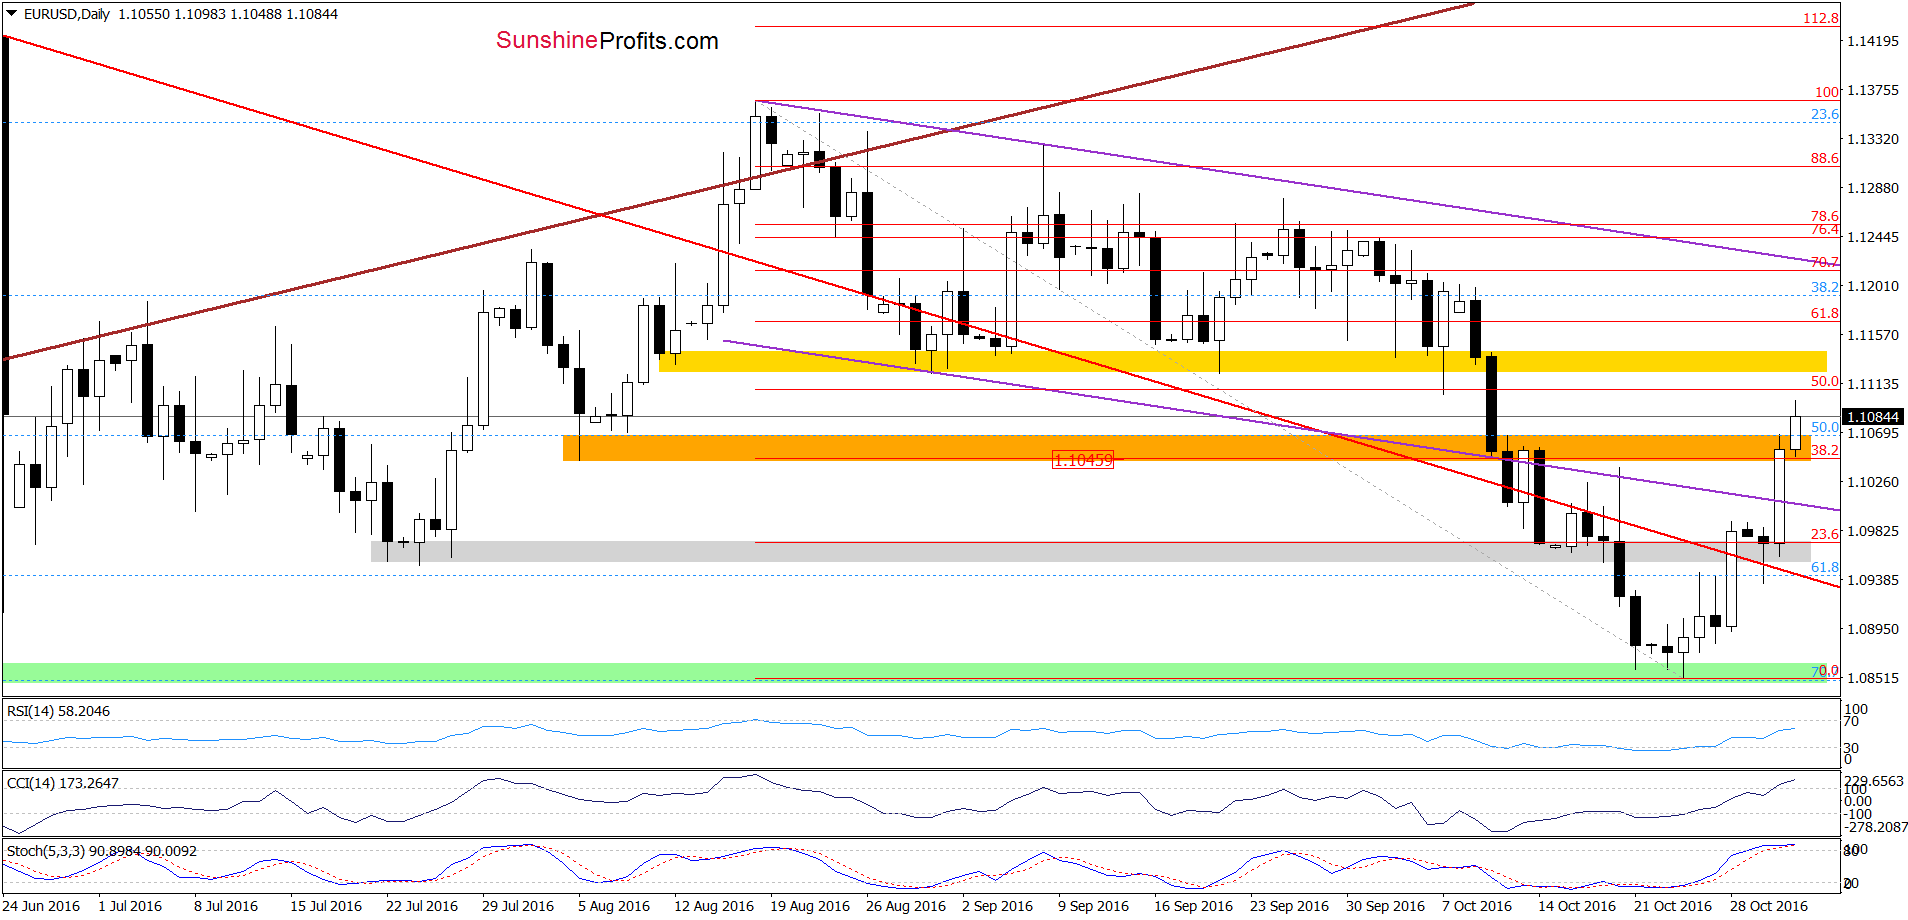
On the daily chart, we see that EUR/USD broke above the orange resistance zone (created by the Aug lows, mid-Oct highs and the 38.2% Fibonacci retracement), which triggered further improvement earlier today. With this move the pair approached the next Fibonacci retracement, which in combination with the current position of daily indicators (the CCI and the Stochastic Oscillator are overbought) suggests that the space for gains may be limited and lower values of the exchange rate should not surprise us in the coming days. Finishing today’s commentary on this currency pair it is also worth noting that even if EUR/USD moves higher from current levels, it seems that the yellow resistance zone will stop (or at least pause) further rally.
Very short-term outlook: mixed
Short-term outlook: mixed
MT outlook: mixed
LT outlook: mixed
Trading position (short-term; our opinion): No positions are justified from the risk/reward perspective. We will keep you informed should anything change, or should we see a confirmation/invalidation of the above.
GBP/USD
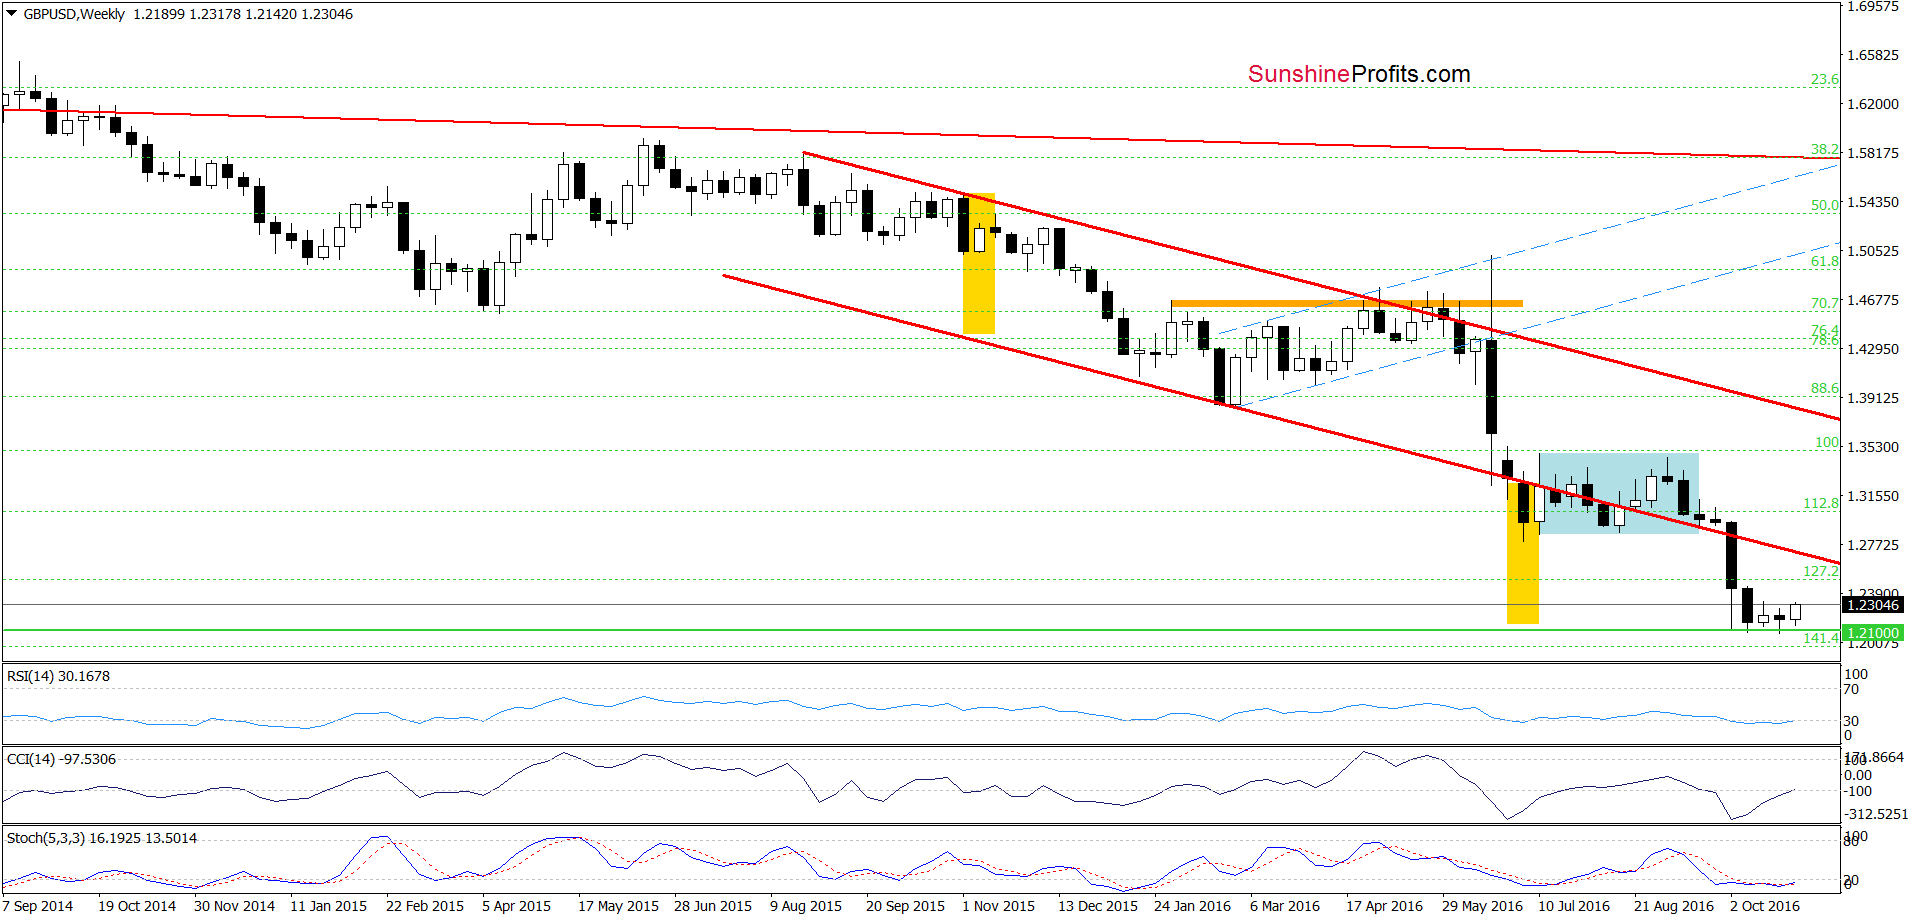
Looking at the weekly chart, we see that the barrier of 1.2100 encouraged currency bulls to act, which resulted in a rebound. What impact did this increase have on the very short-term picture? Let’s check.
On Friday, we wrote the following:
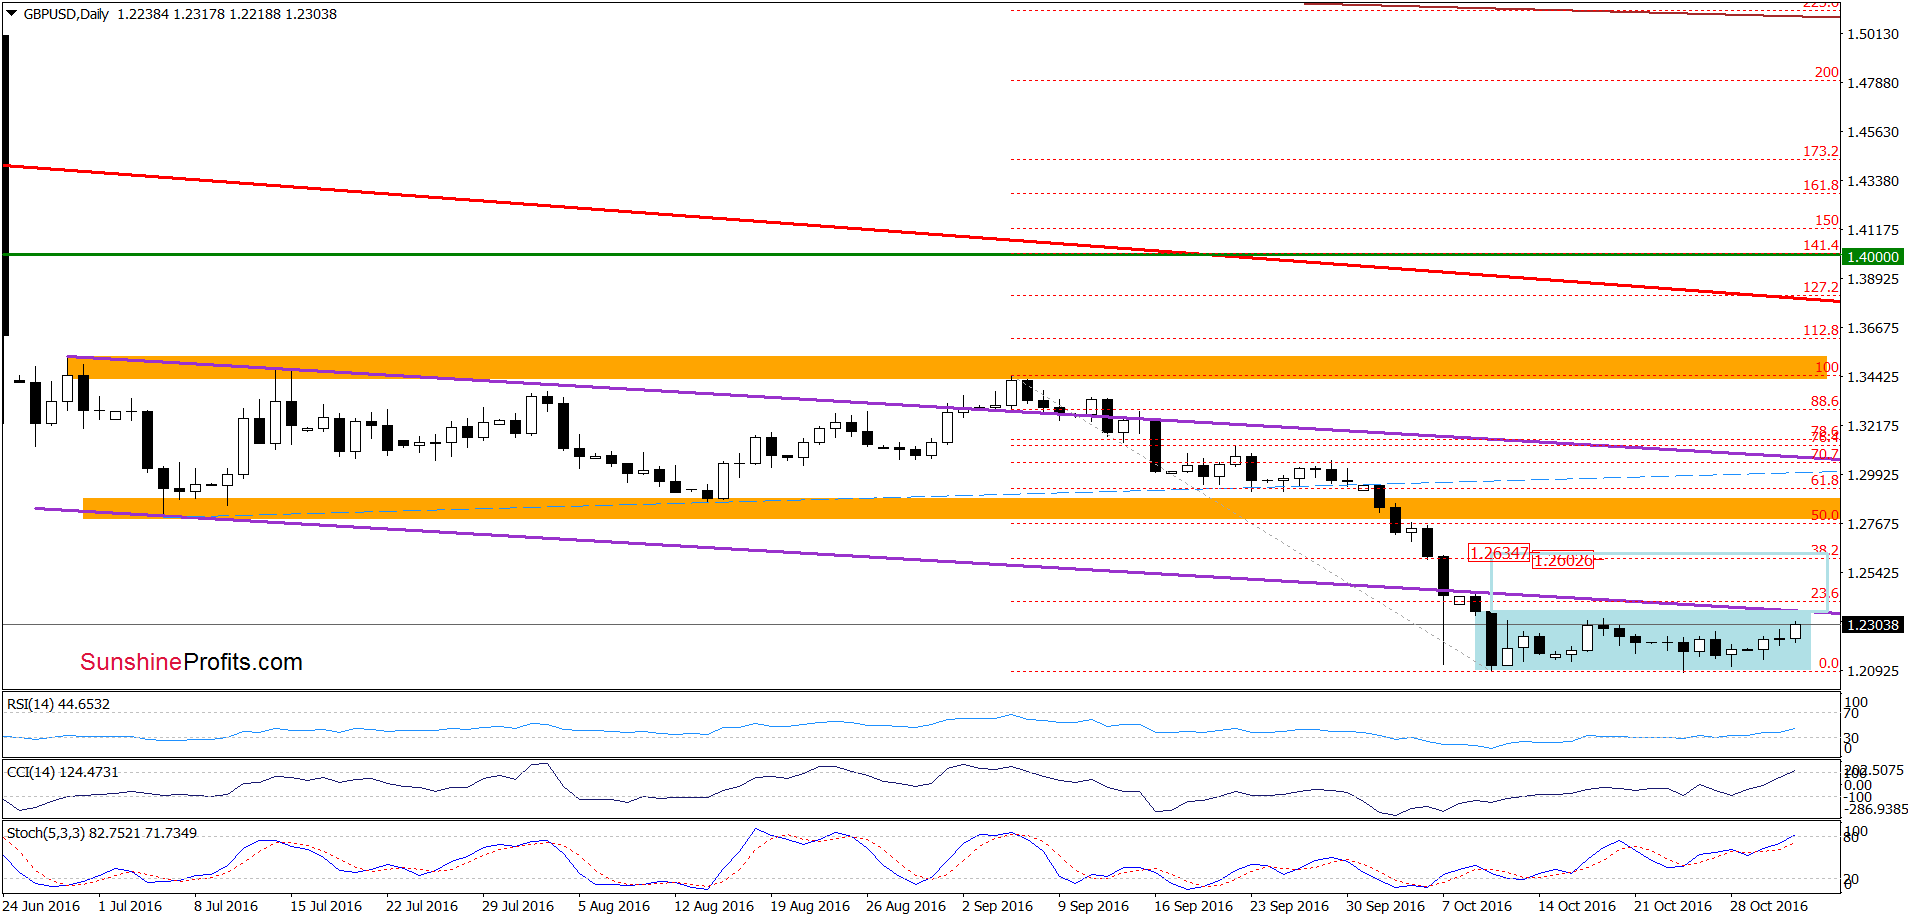
(…) GBP/USD (…) dropped to recent lows and the level of 1.2100. As you see, this area was strong enough to stop declines several times in the past, which could result in another rebound – even to the lower border of the purple declining trend channel.
From this perspective, we see that the situation developed in line with the above scenario and GBP/USD extended gains, approaching our upside target. What’s next? As you see this resistance line stopped currency bulls in early Oct, which resulted in a drop to fresh lows. Therefore if history repeats itself once again, we may see another decline to the lower border of the blue consolidation and the barrier of 1.2100. Nevertheless, such price action will be more likely if daily indicators generate sell signals. Until this time an attempt to move higher can’t be ruled out. Finishing today’s commentary on this currency pair, it is worth considering what could happen if currency bulls manage to push GBP/USD above the purple resistance line and the upper border of the blue consolidation. In our opinion, such positive event could trigger an upward move to around 1.2602, where the 38.2% Fibonacci retracement (based on the Sep-Oct downward move) is. Additionally, slightly above this level (around 1.2634) the size of the upswing would correspond to the height of the formation, which could encourage currency bears to act.
Very short-term outlook: mixed
Short-term outlook: mixed
MT outlook: mixed
LT outlook: bearish
Trading position (short-term; our opinion): No positions are justified from the risk/reward perspective. We will keep you informed should anything change, or should we see a confirmation/invalidation of the above.
USD/JPY
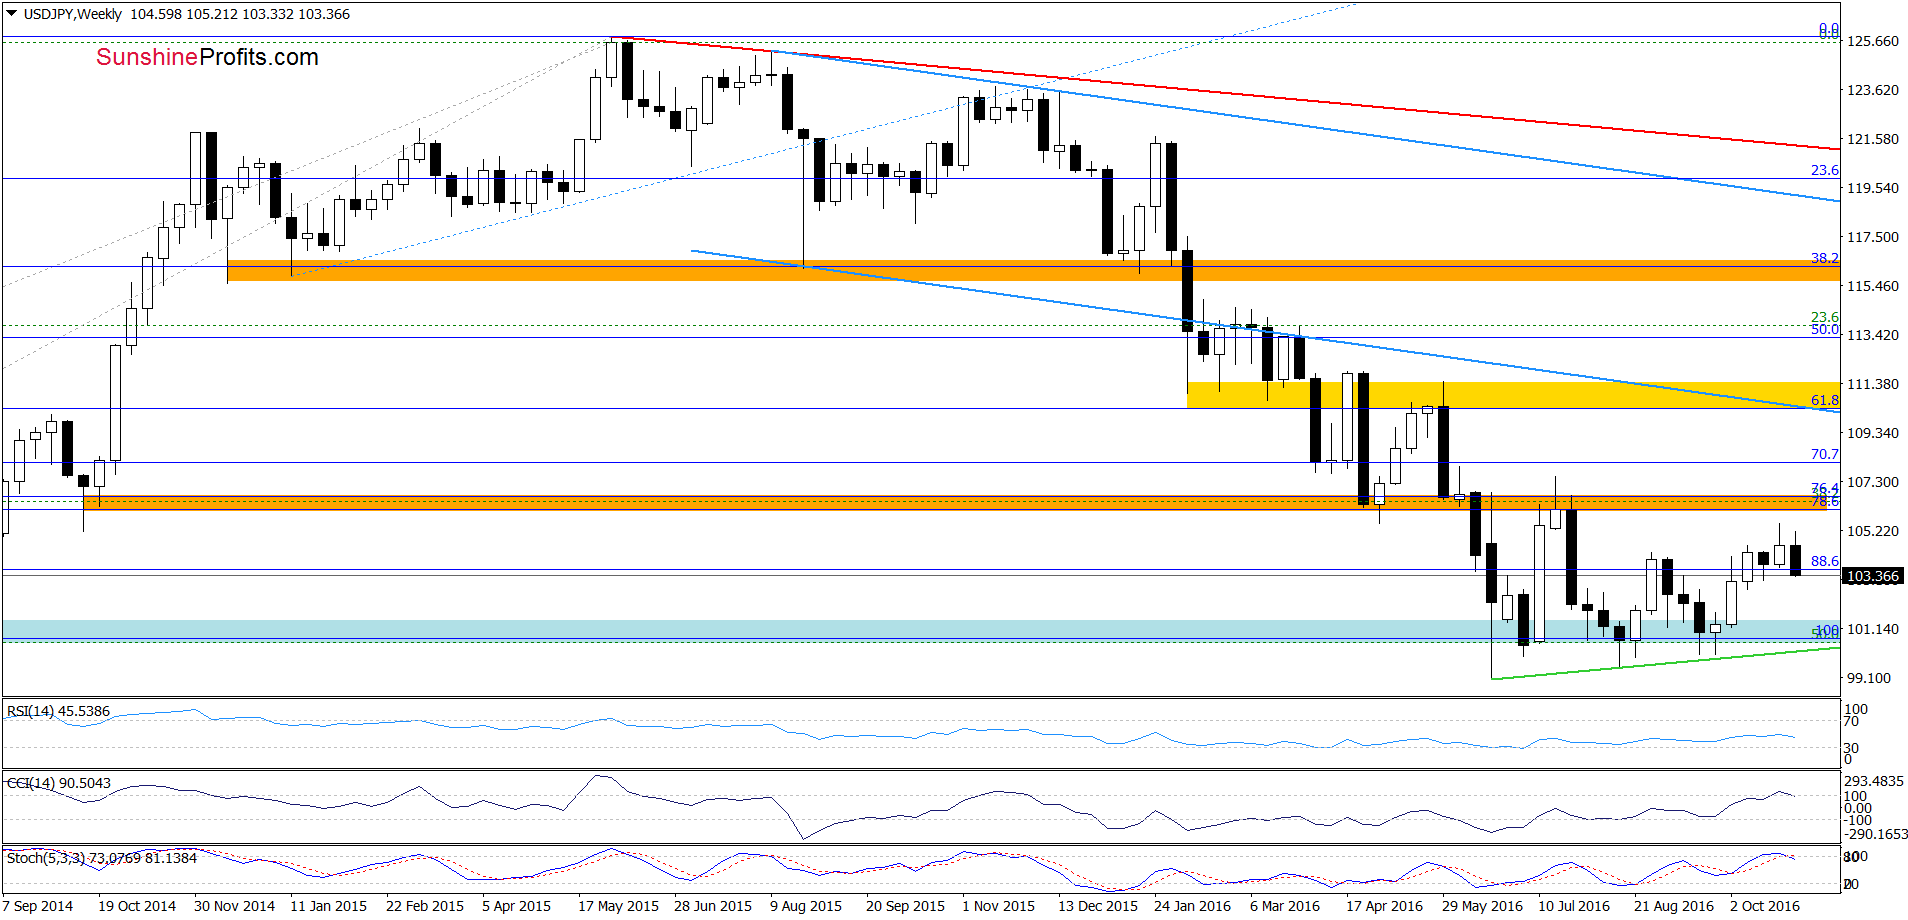
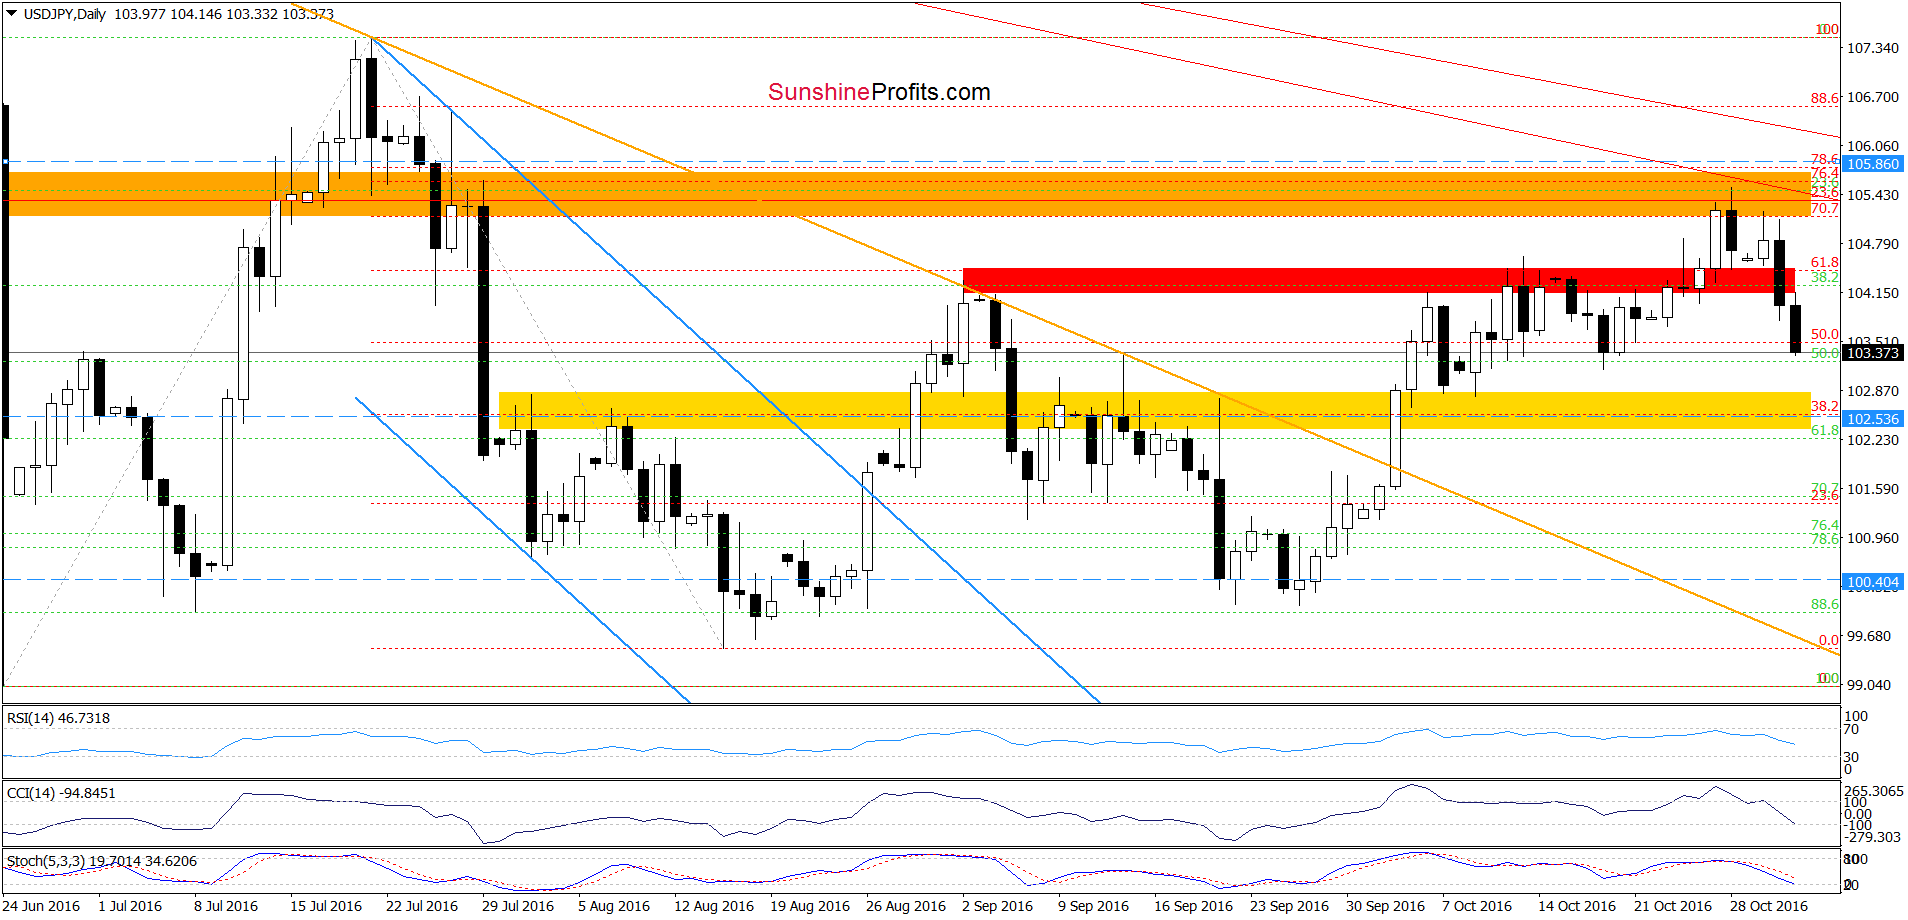
Although USD/JPY extended gains in the previous week, the orange resistance zone stopped currency bulls, triggering a pullback. With this drop, the pair slipped under the previously-broken red zone, invalidating earlier breakout. This negative event encouraged currency bears to act, which resulted in further deterioration earlier today. What’s next? Taking into account the fact that sell signals generated by the indicators remain in place, we think that the pair will test the yellow zone in the coming days. However, if this support is broken, the next target for currency bears would be around 100.07-100.40, where the late Sep lows and the blue support zone (marked on the weekly chart above) are.
Very short-term outlook: mixed with bearish bias
Short-term outlook: mixed with bearish bias
MT outlook: mixed
LT outlook: mixed
Trading position (short-term; our opinion): No positions are justified from the risk/reward perspective. We will keep you informed should anything change, or should we see a confirmation/invalidation of the above.
Thank you.
Nadia Simmons
Forex & Oil Trading Strategist
Przemyslaw Radomski, CFA
Founder, Editor-in-chief, Gold & Silver Fund Manager
Gold & Silver Trading Alerts
Forex Trading Alerts
Oil Investment Updates
Oil Trading Alerts

