

Although today’s data showed that euro zone industrial production increased in Aug, beating analysts‘ expectations, the euro extended losses against the greenback and dropped to the next support area. Will it anage to stop currency bears in the coming days?
In our opinion the following forex trading positions are justified - summary:
- EUR/USD: none
- GBP/USD: none
- USD/JPY: none
- USD/CAD: short (a stop-loss order at 1.3346; initial downside target at 1.2876)
- USD/CHF: none
- AUD/USD: short (a stop-loss order at 0.7791; initial downside target at 0.7516)
EUR/USD
Yesterday, we wrote the following:
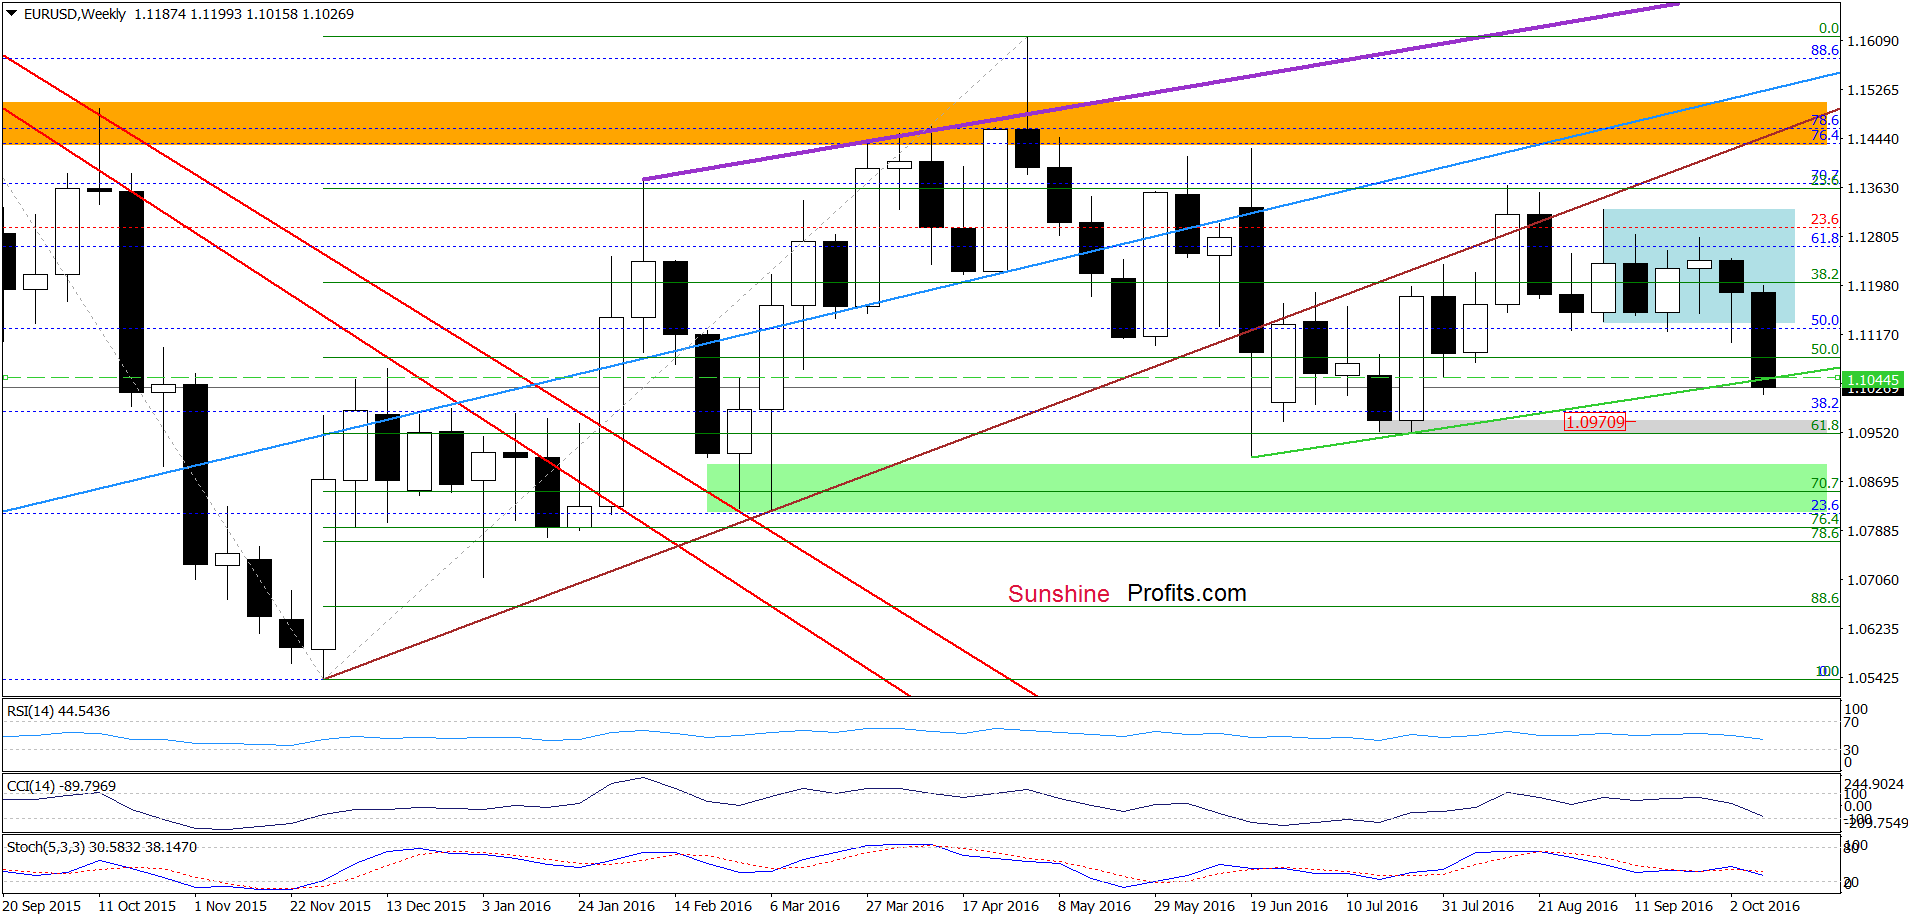
The first thing that catches the eye on the weekly chart is breakdown under the lower border of the blue consolidation, which suggests further deterioration and a test of the green support line based on the previous lows (around 1.1044) in the coming week.
From today’s point of view, we see that currency bears not only took EUR/USD to our downside target, but also managed to push the pair below it, which doesn’t bode well for the exchange rate.
How did this drop affect the very short-term picture? Let’s check.
Quoting our previous alert:
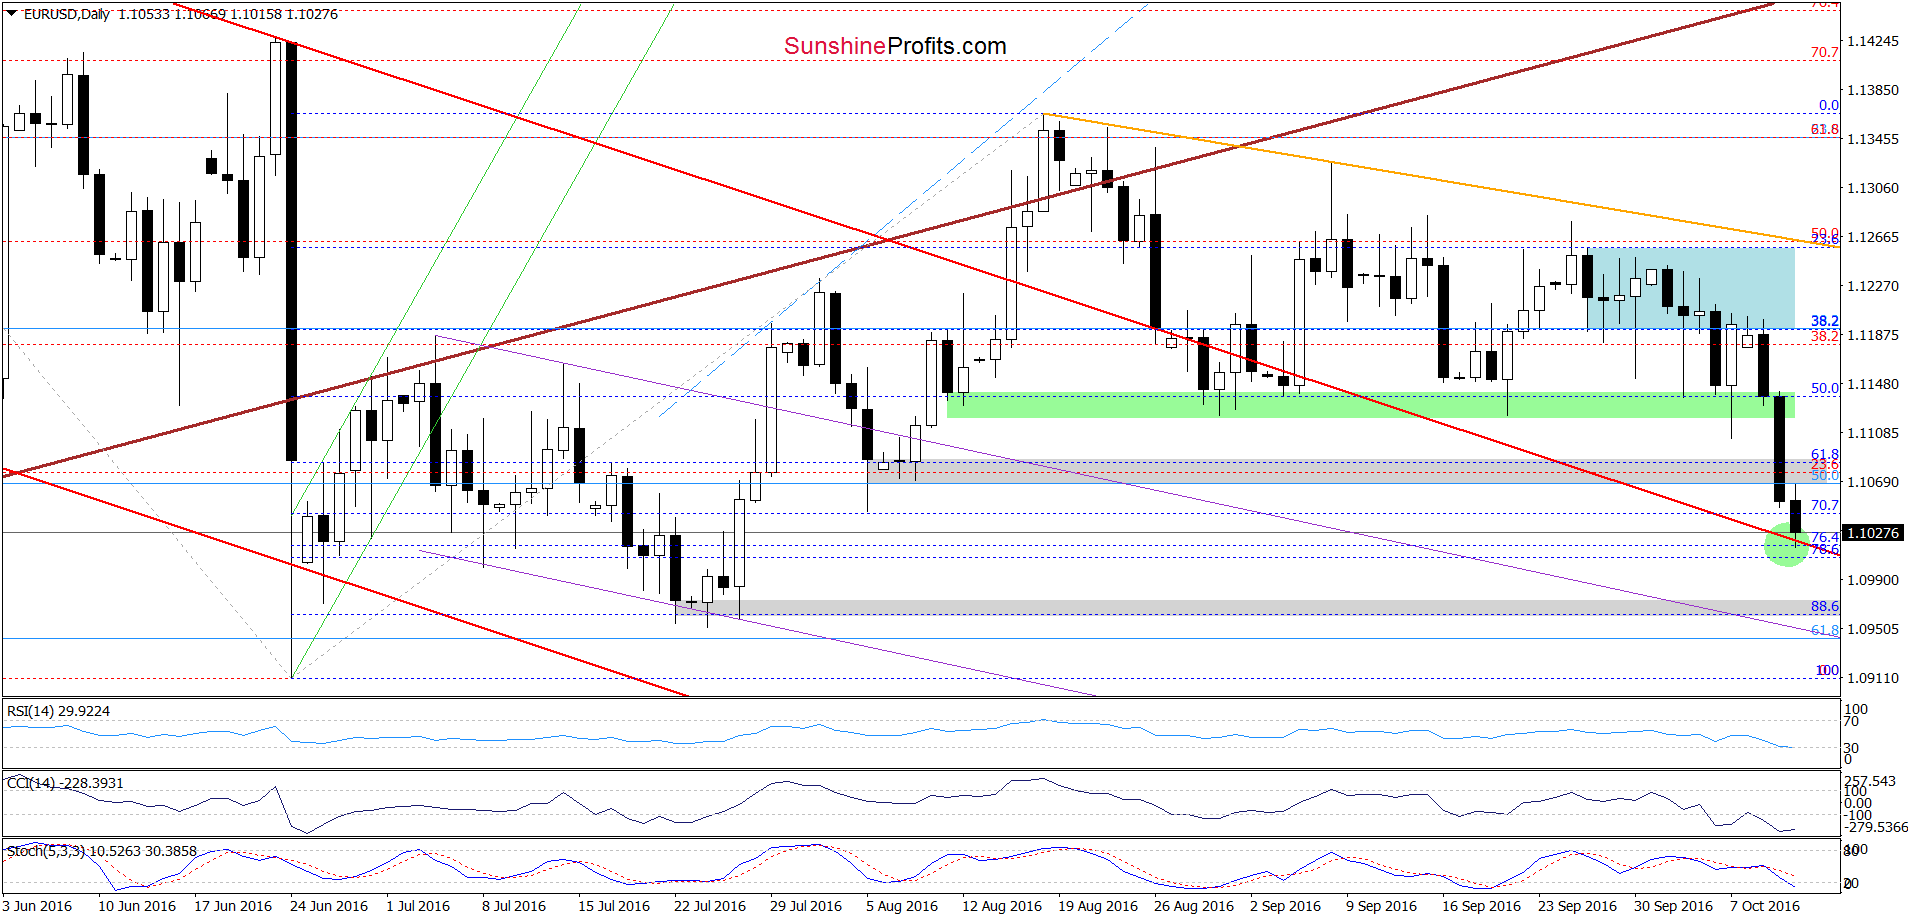
(…) What’s next? Taking into account the fact that the Stochastic Oscillator generated a sell signal, we think that currency bears will push the pair lower and test not only the green line marked on the weekly chart, but also the red declining line based on the May and Jun highs, which currently intersects the next support zone created by the 76.4% and 78.6% Fibonacci retracement levels (marked with a green circle on the daily chart).
As you see on the daily chart, the situation developed in line with the above scenario and EUR/USD reached our downside target earlier today. Thanks to this drop, the RSI slipped under the level of 30, while the CCI remains extremely oversold, which suggests that reversal in the coming days should not surprise us. Nevertheless, as long as the sell signal generated by the Stochastic Oscillator remains in play another downswing can’t be ruled out. Therefore, if the combination of the above-mentioned supports doesn’t stop currency bears, we may see a decline even to the next grey support zone (created by the 88.6% Fibonacci retracement and late Jul lows) around 1.0954-1.0971.
Very short-term outlook: mixed
Short-term outlook: mixed
MT outlook: mixed
LT outlook: mixed
Trading position (short-term; our opinion): No positions are justified from the risk/reward perspective. We will keep you informed should anything change, or should we see a confirmation/invalidation of the above.
USD/JPY
The situation in the long- and medium term hasn’t changed much as the exchange rate remains above the green support zone and the green support line based on the Jun and Aug lows. Today, we’ll focus on the very short-term changes.
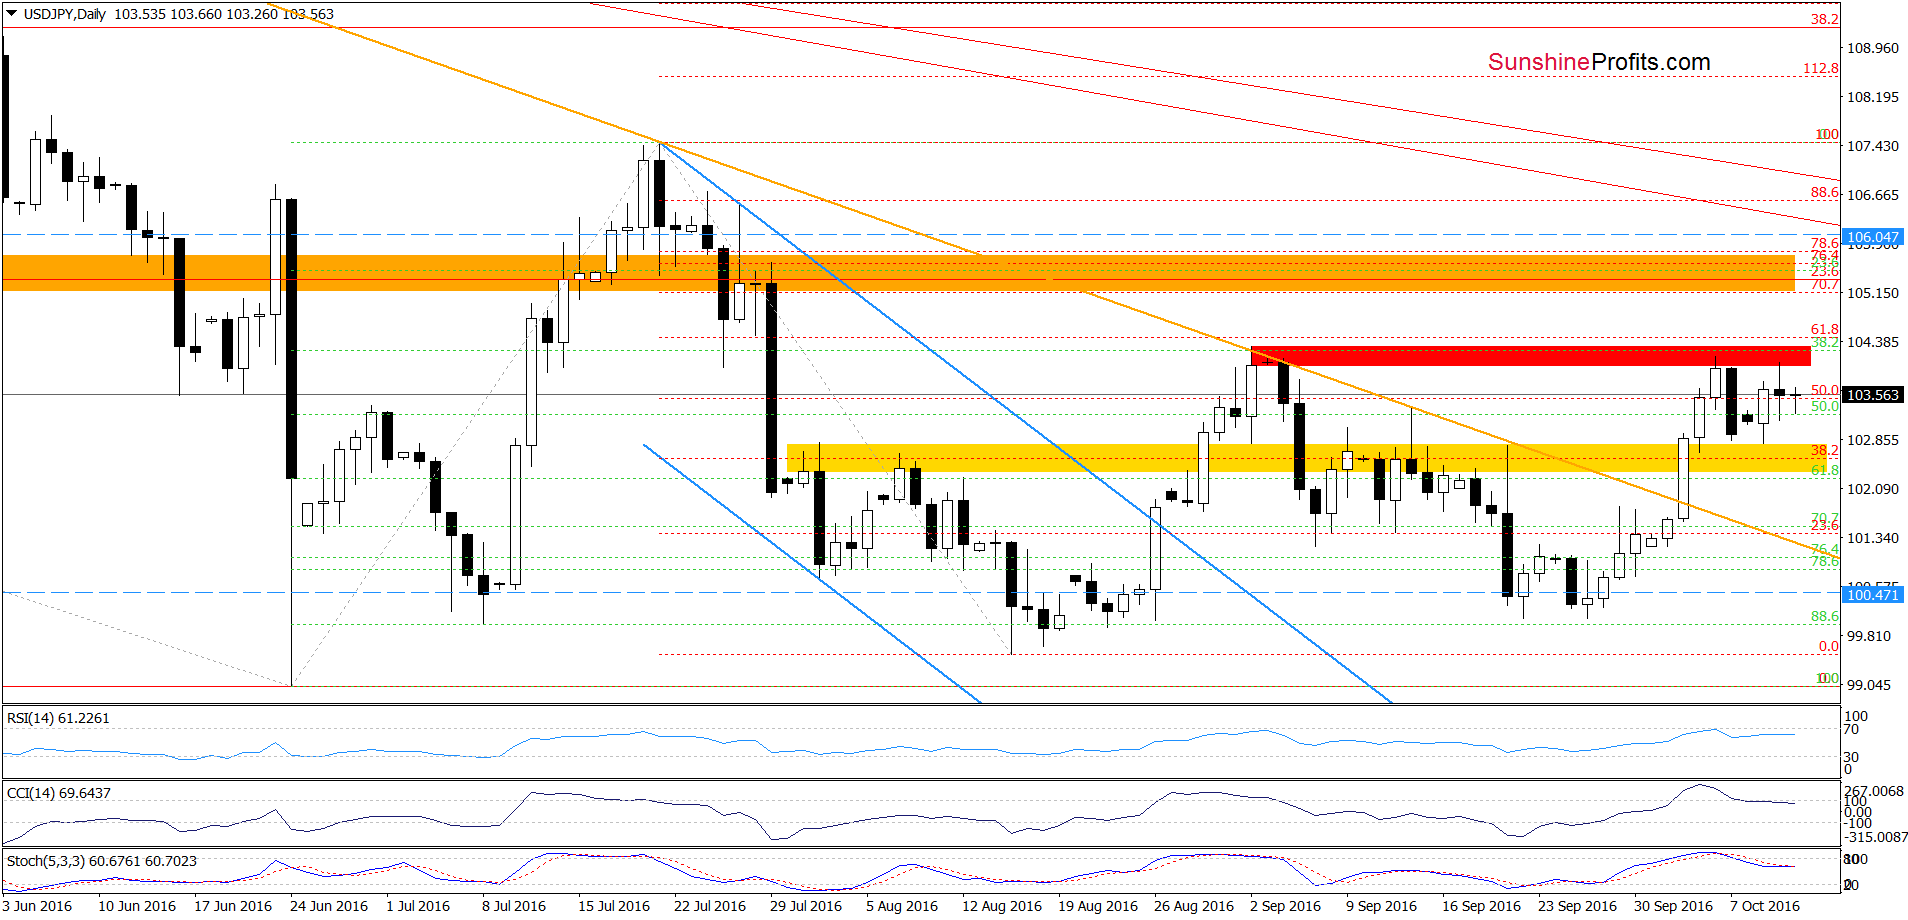
On the daily chart, we see that USD/JPY remains under the red resistance zone, which means that our yesterday's commentary on this currency pair remains valid:
(…) Will we see a breakout above it [the red resistance zone]? In our opinion, it is unlikely. Why? As you see, sell signals generated by the indicators remain in play, supporting currency bears and lower values of the exchange rate. Therefore, we think that another reversal from this area should not surprise us. If this is the case and we see such price action, the initial downside target would be the yellow zone. However if it is broken, USD/JPY may test the previously-broken orange declining line, which serves now as another support.
Very short-term outlook: mixed with bearish bias
Short-term outlook: mixed with bearish bias
MT outlook: mixed
LT outlook: mixed
Trading position (short-term; our opinion): No positions are justified from the risk/reward perspective. We will keep you informed should anything change, or should we see a confirmation/invalidation of the above.
USD/CHF
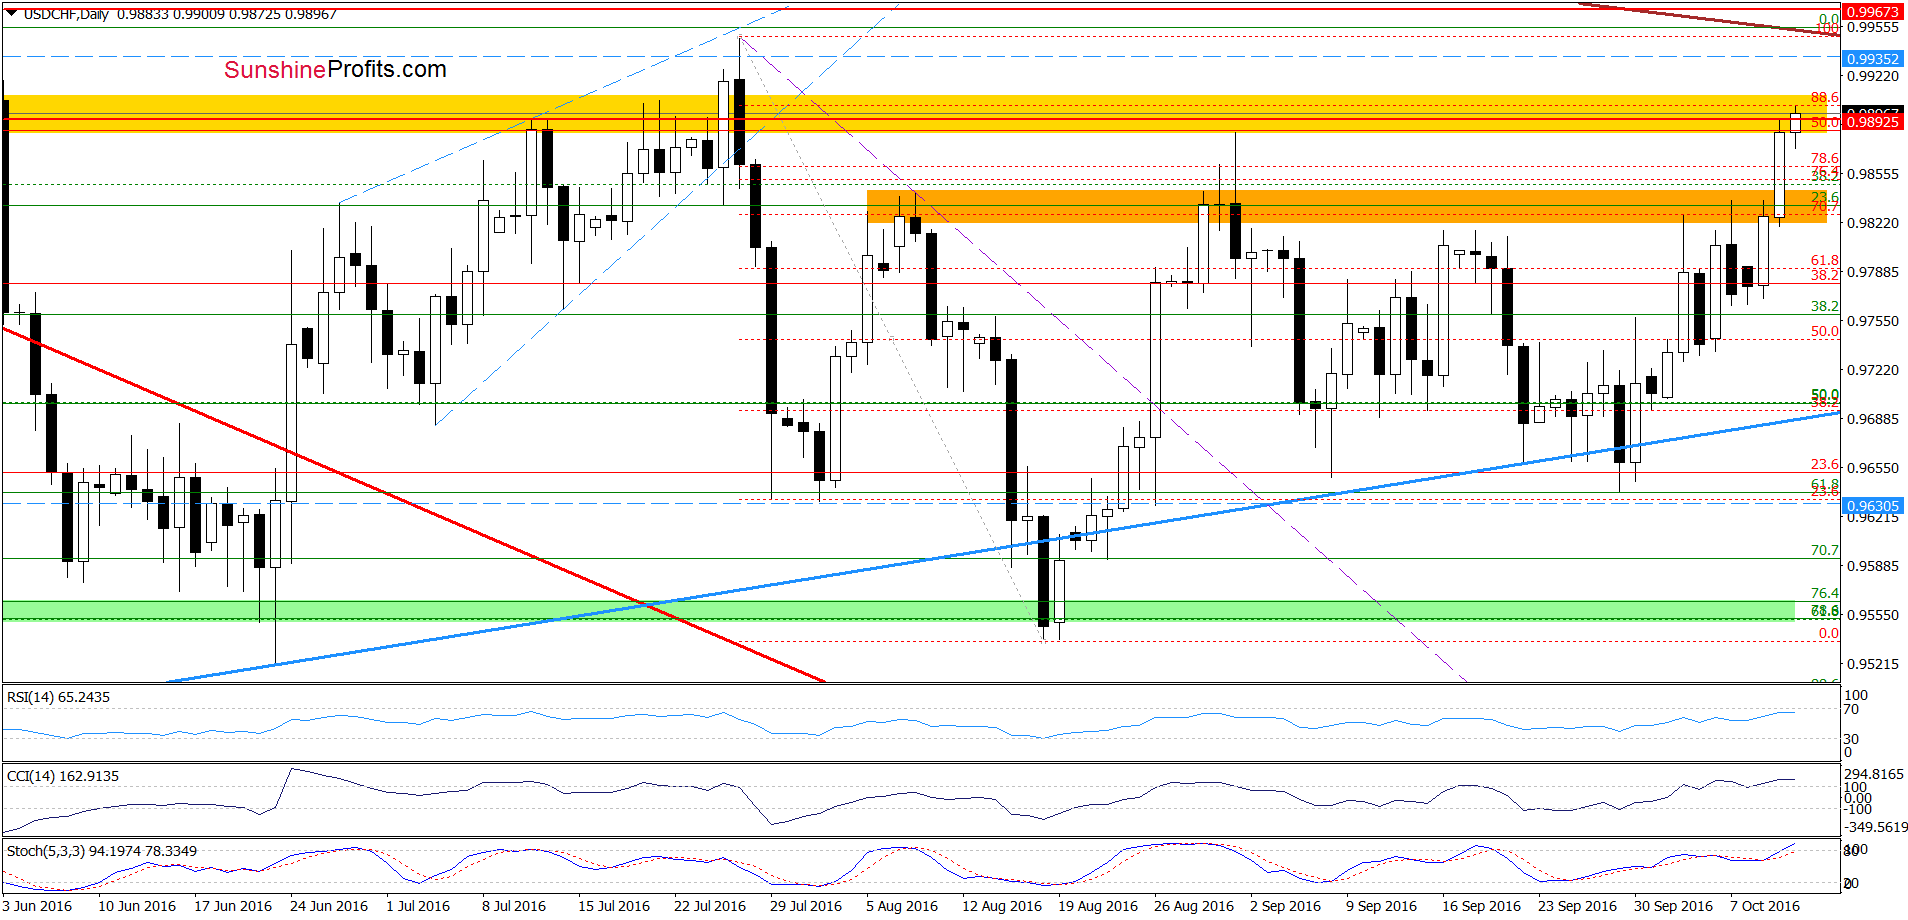
The medium-term picure remains almost nchabged as USD/CHF is still trading above the peviously-broken upper line of the consolidation, which in combinatin with a buy signal generated by the Stochastic Oscillator suggests further improvement. Today, we’ll focus on the daily chart.
Quoting our yesterday’s alert:
(…) the pair extended gains and broke above the orange resistance zone, which is a bullish signal (especially when we take into account the importance of this zone - in previous weeks, this area was strong enough to stop upward moves several times) that suggests further improvement and a test of the yellow zone or even the Jul high in the coming days.
As you see on the above chart, currency bulls pushed the exchange rate higher (in line with our assumptions), which resulted in a climb to our first upside target - the yellow resistance zone. Thanks to this increase, the CCI and Stochastic Oscillator moved to their overbought areas, which suggests that reversal is may be just around the corner. However, as long as there are no sell signals, another upswing (to our next target) can’t be ruled out. At this point, it is worth noting that if USD/CHF moves higher from current levels, the space for gains seems limited as the long-term brown declining resistance line (based on the Nov and Feb highs) is quite close (currently around 0.9951).
Very short-term outlook: mixed
Short-term outlook: mixed
MT outlook: mixed
LT outlook: mixed
Trading position (short-term; our opinion): No positions are justified from the risk/reward perspective. We will keep you informed should anything change, or should we see a confirmation/invalidation of the above.
Thank you.
Nadia Simmons
Forex & Oil Trading Strategist
Przemyslaw Radomski, CFA
Founder, Editor-in-chief, Gold & Silver Fund Manager
Gold & Silver Trading Alerts
Forex Trading Alerts
Oil Investment Updates
Oil Trading Alerts

