

Yesterday, the USD Index moved sharply lower after the Fed left rates on hold. Earlier today, the greenback extended losses against the euro, but will we see further deterioration in the coming days?
In our opinion the following forex trading positions are justified - summary:
- EUR/USD: long (a stop-loss order at 1.1114; initial upside target at 1.1327)
- GBP/USD: none
- USD/JPY: none
- USD/CAD: short (a stop-loss order at 1.3346; initial downside target at 1.2876)
- USD/CHF: none
- AUD/USD: none
EUR/USD
Although EUR/USD rebounded, the situation in the medium-term hasn’t changed much as the exchange rate is still trading between last week’s high and low. Today, we’ll focus on the very short-term changes.
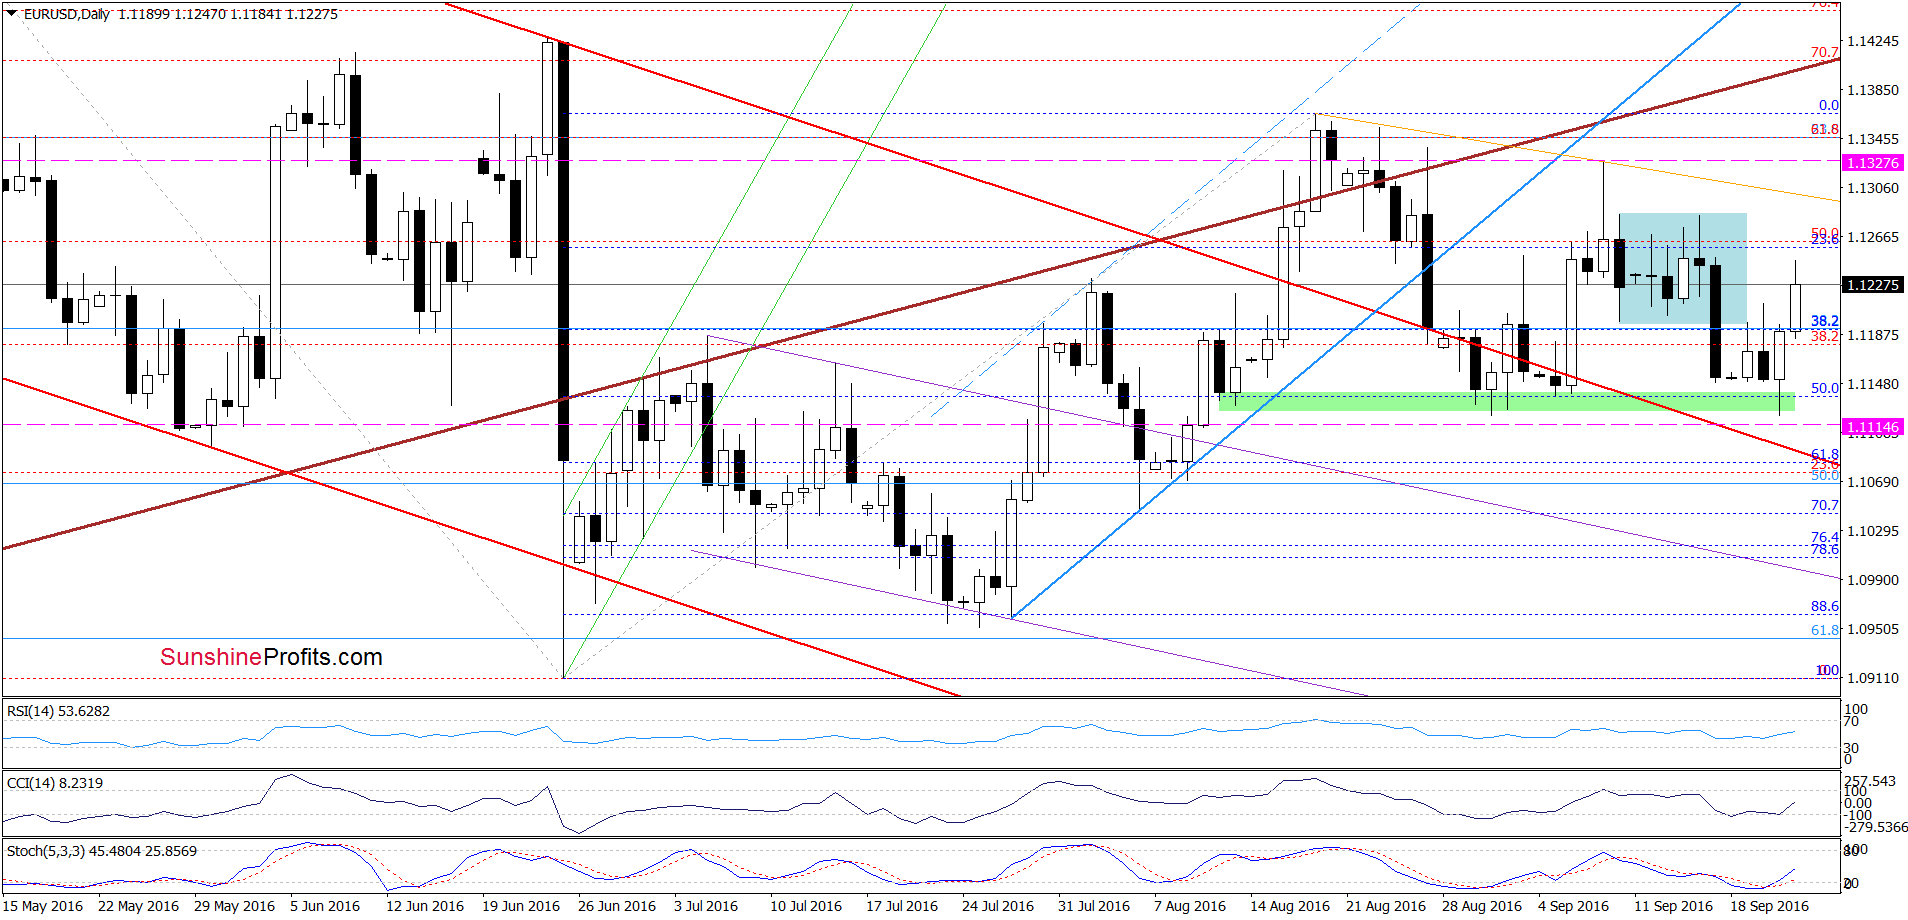
On Monday, we wrote the following:
(…) the pair climbed to the previously-broken lower line of the formation, which looks like a verification of the breakdown. If this is the case, we’ll likely see another downswing and a re-test of the green zone (or even the upper border of the red declining trend channel). Nevertheless, the current position of the indicators (the CCI generated a buy signal, while the Stochastic Oscillator is very close to doing the same) suggests that the space for declines is limited and reversal in the coming day (maybe even later in the day) is very likely.
Looking at the daily chart, we see that the situation developed in line with the above scenario and EUR/USD moved higher as we had expected. With yesterday’s rebound, the pair invalidated earlier small breakdown under the green support zone, which encouraged currency bulls to act and triggered further improvement. Earlier today, the exchange rate extended gains and invalidated the breakdown under the lower border of the blue consolidation, which is an additional bullish signal. On top of that, the CCI and Stochastic Oscillator generated buy signals, which suggests higher values of EUR/USD in the coming days. If this is the case, the first upside target would be around 1.1284, where the upper border of the blue consolidation is. If this resistance is broken, we’ll see an increase to the orange declining resistance line based on the previous highs (currently around 1.1300) or even a rally to the brown medium-term resistance line in the coming days. Taking all the above into account, we think that opening long positions is justified from the risk/reward perspective.
Very short-term outlook: bullish
Short-term outlook: mixed with bullish bias
MT outlook: mixed
LT outlook: mixed
Trading position (short-term; our opinion): Long positions (with a stop-loss order at 1.1114 and initial upside target at 1.1327) are justified from the risk/reward perspective. We will keep you informed should anything change, or should we see a confirmation/invalidation of the above.
GBP/USD
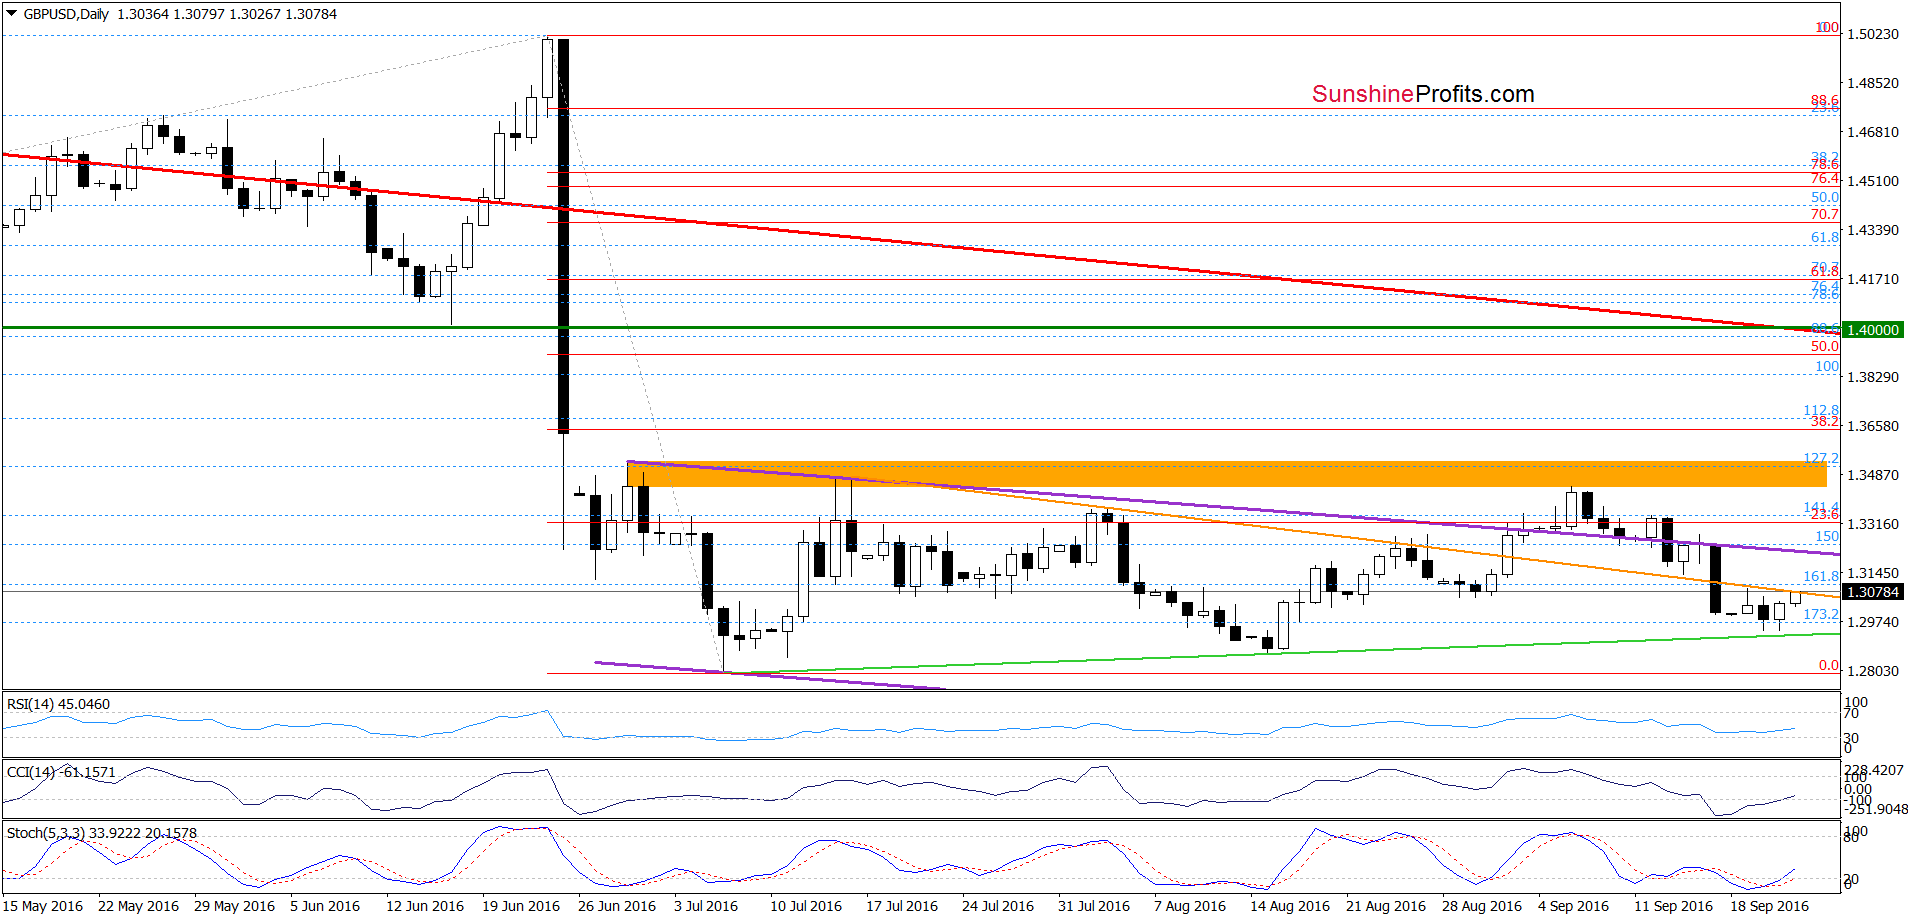
Quoting our Monday’s alert:
(…) the pair verified earlier breakdown below the orange line, which suggests further deterioration and a re-test of the Jul and Aug lows in the coming days.
Are there any factors that could stop declines? Firstly, the current position of the daily indicators (they are very close to generating buy signals). Secondly, and more importantly, the lower border of the red declining trend channel marked on the chart below.
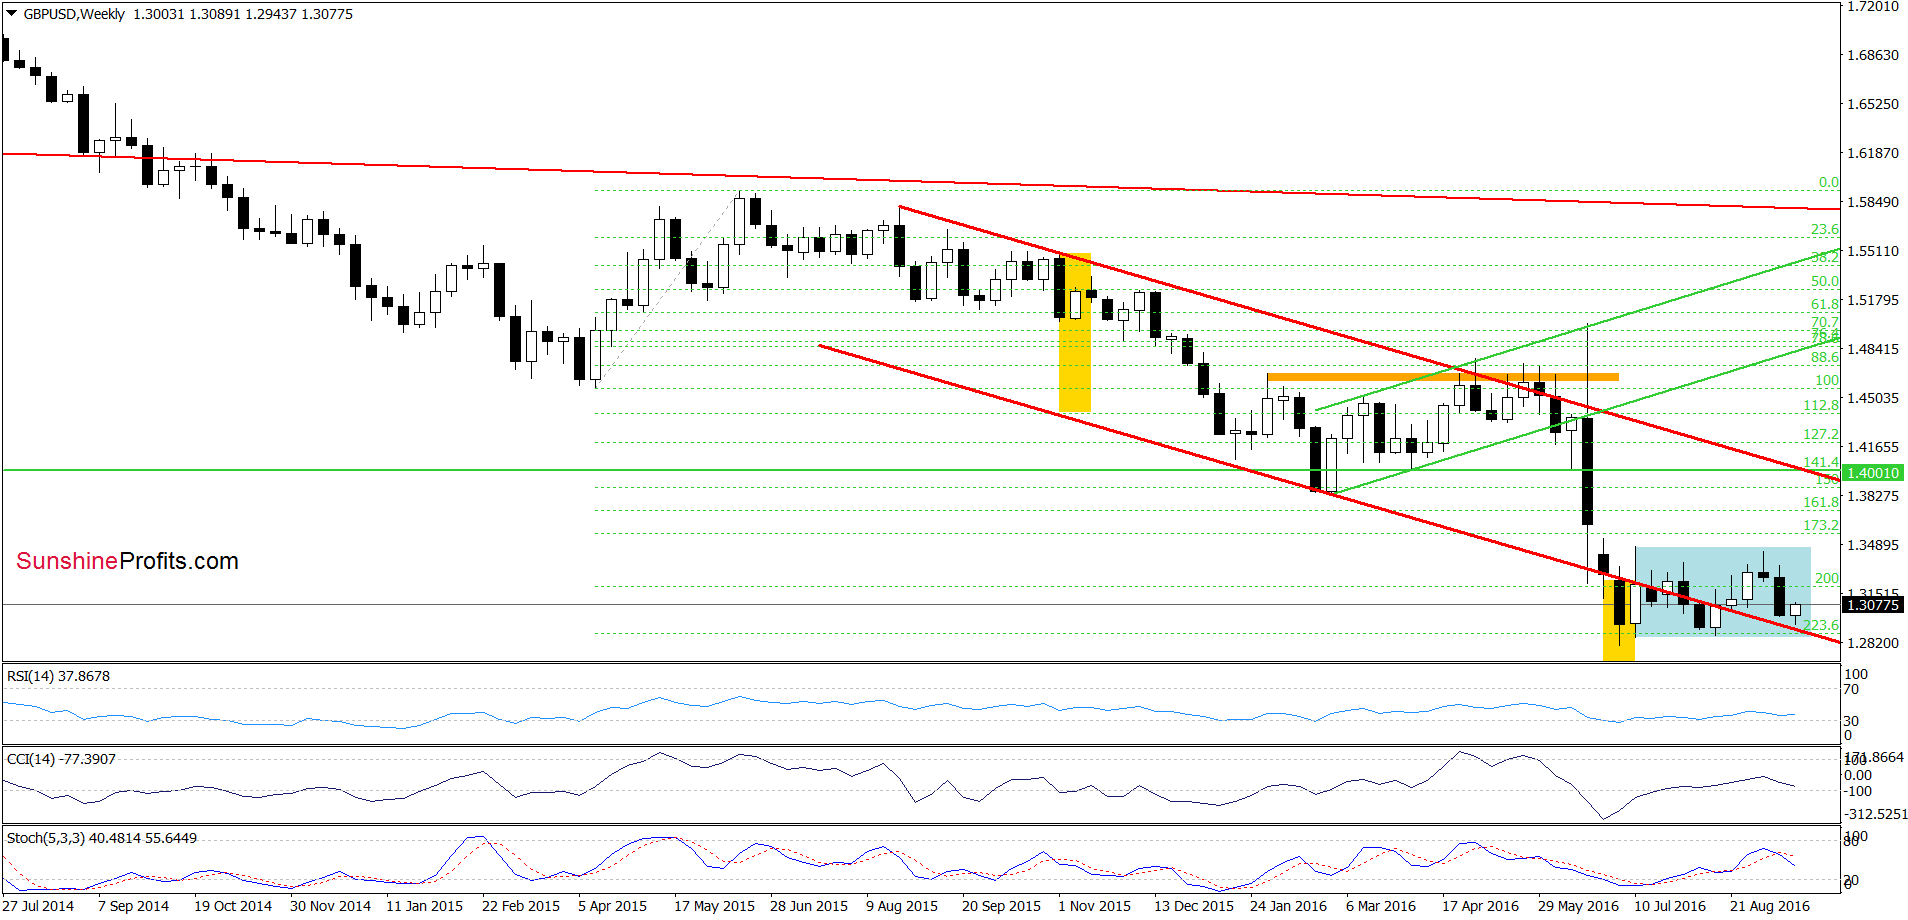
Looking at the charts from today’s point of view, we see that the proximity to the green support line (based on the previous lows and marked on the daily chart) and the lower border of the red declining trend channel in combination with buy signals generated by the daily indicators encouraged currency bulls to act (as we had expected). As a result, GBP/USD rebounded and came back to the previously-broken orange line. What’s next? Although this resistance could pause further improvement, we think that all the above-mentioned factors will trigger higher values of GBP/USD in near future. In this case, we’ll see a test of the purple declining resistance line or even a re-test of the orange zone in the coming week.
Very short-term outlook: mixed with bullish bias
Short-term outlook: mixed with bullish bias
MT outlook: mixed
LT outlook: bearish
Trading position (short-term; our opinion): No positions are justified from the risk/reward perspective. We will keep you informed should anything change, or should we see a confirmation/invalidation of the above.
USD/JPY
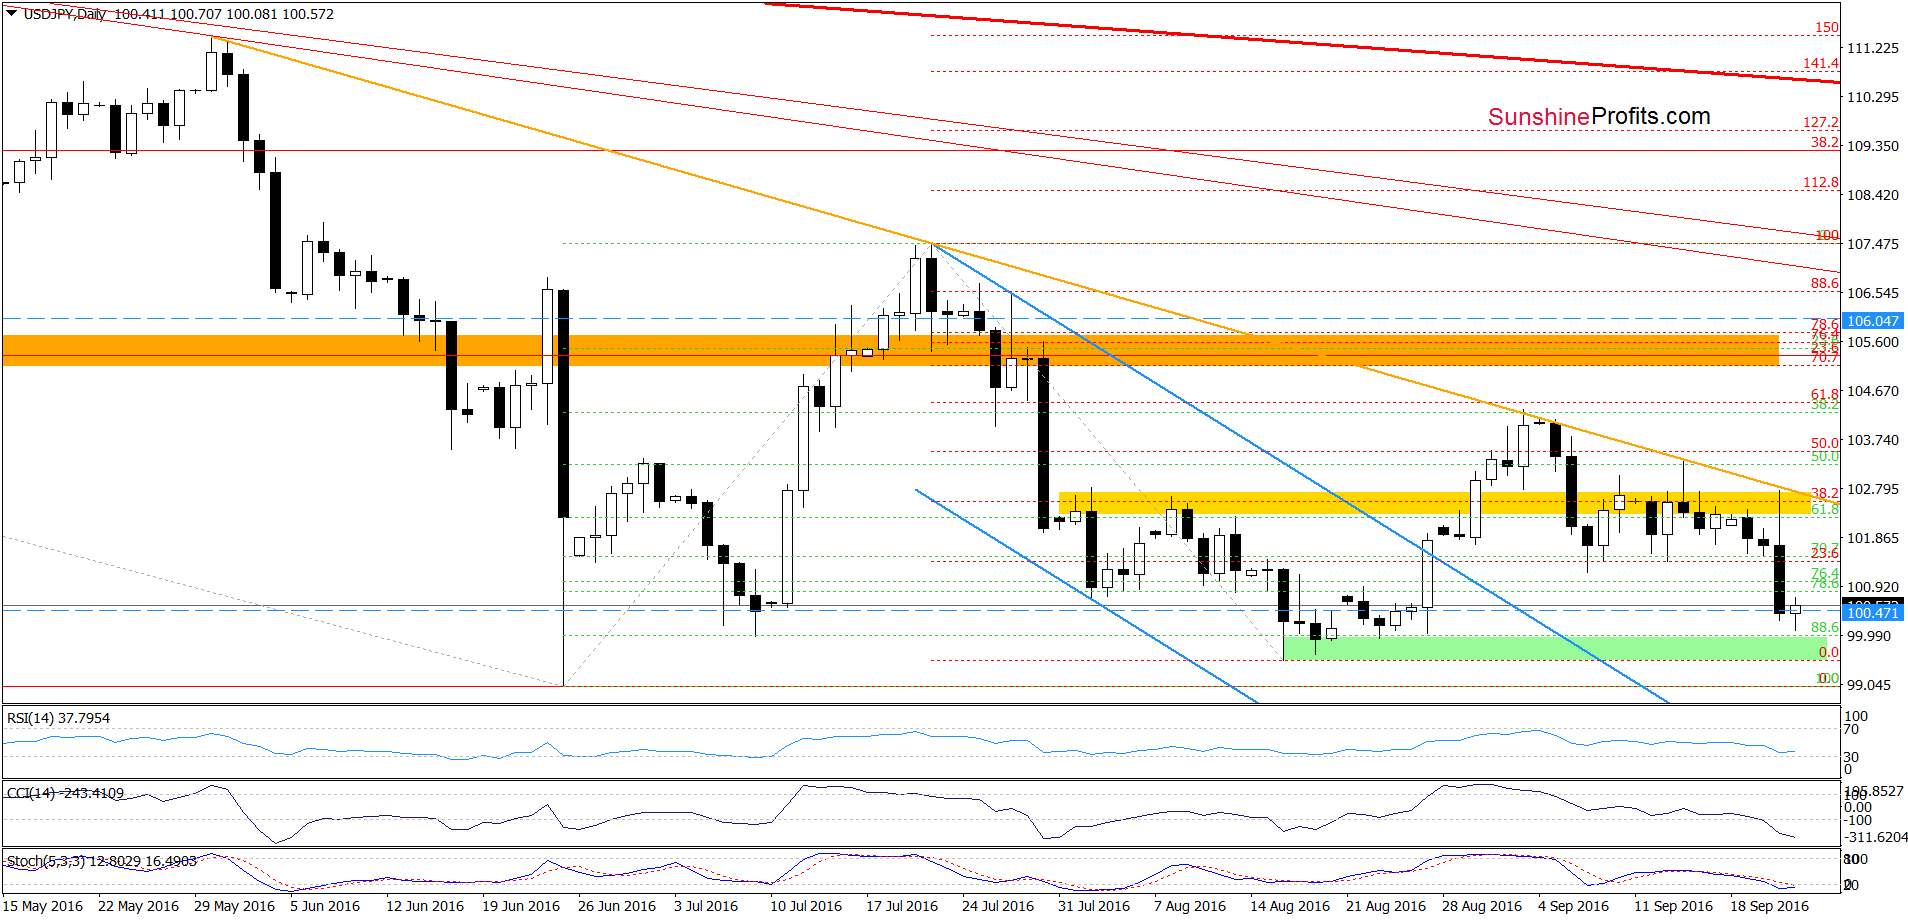
On Monday, we wrote:
(…) the pair verified earlier breakdown below the yellow zone, which in combination with sell signals generated by the indicators suggests a test of the Sep lows (or even the barrier of 100) in the coming day(s). Will we see further deterioration? In our opinion, not likely, because USD/JPY slipped to the blue support zone marked on the chart below.
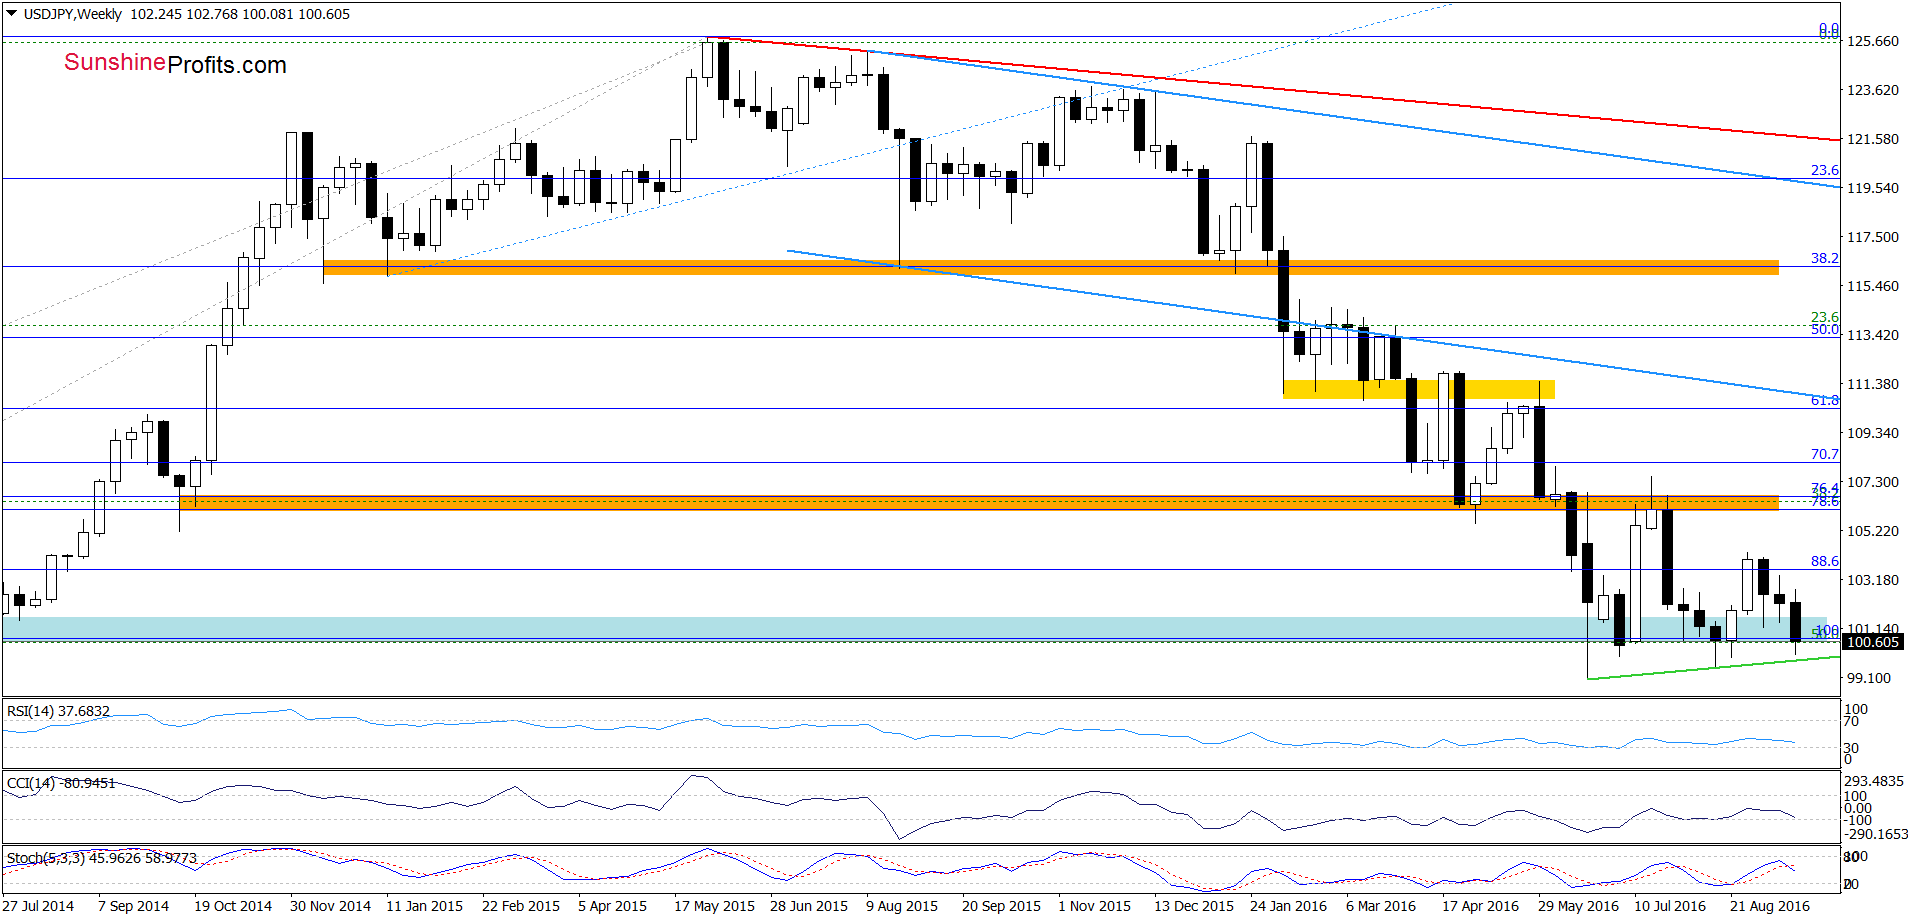
(...) this area managed to stop currency bears in previous weeks, which suggests that we may see similar price action in near future – even if the exchange rate slips to the green support line based on the Jun and Aug lows first.
On the above charts, we see that the situation developed in tune with our assumptions and USD/JPY extended losses to our downside targets. Although the pair rebounded earlier today, we think that as long as there won’t be buy signals generated by the indicators another downswing and a test of the green support line based on the Jun and Aug lows can’t be ruled out.
Very short-term outlook: mixed
Short-term outlook: mixed
MT outlook: mixed
LT outlook: mixed
Trading position (short-term; our opinion): No positions are justified from the risk/reward perspective. We will keep you informed should anything change, or should we see a confirmation/invalidation of the above.
Thank you.
Nadia Simmons
Forex & Oil Trading Strategist
Przemyslaw Radomski, CFA
Founder, Editor-in-chief, Gold & Silver Fund Manager
Gold & Silver Trading Alerts
Forex Trading Alerts
Oil Investment Updates
Oil Trading Alerts

