

Earlier today, official data showed that U.S. gross domestic product in the second quarter (a preliminary reading) increased less than analysts expected, which disappointed market participants and pushed the USD Index sharply lower. What impact did this move have on the euro, pound and yen?
In our opinion the following forex trading positions are justified - summary:
- EUR/USD: none
- GBP/USD: short (a stop-loss at 1.3579; initial downside target at 1.2519)
- USD/JPY: none
- USD/CAD: none
- USD/CHF: short (a stop loss at 0.9967; initial downside target at 0.9692)
- AUD/USD: none
EUR/USD
Yesterday, we wrote the following:
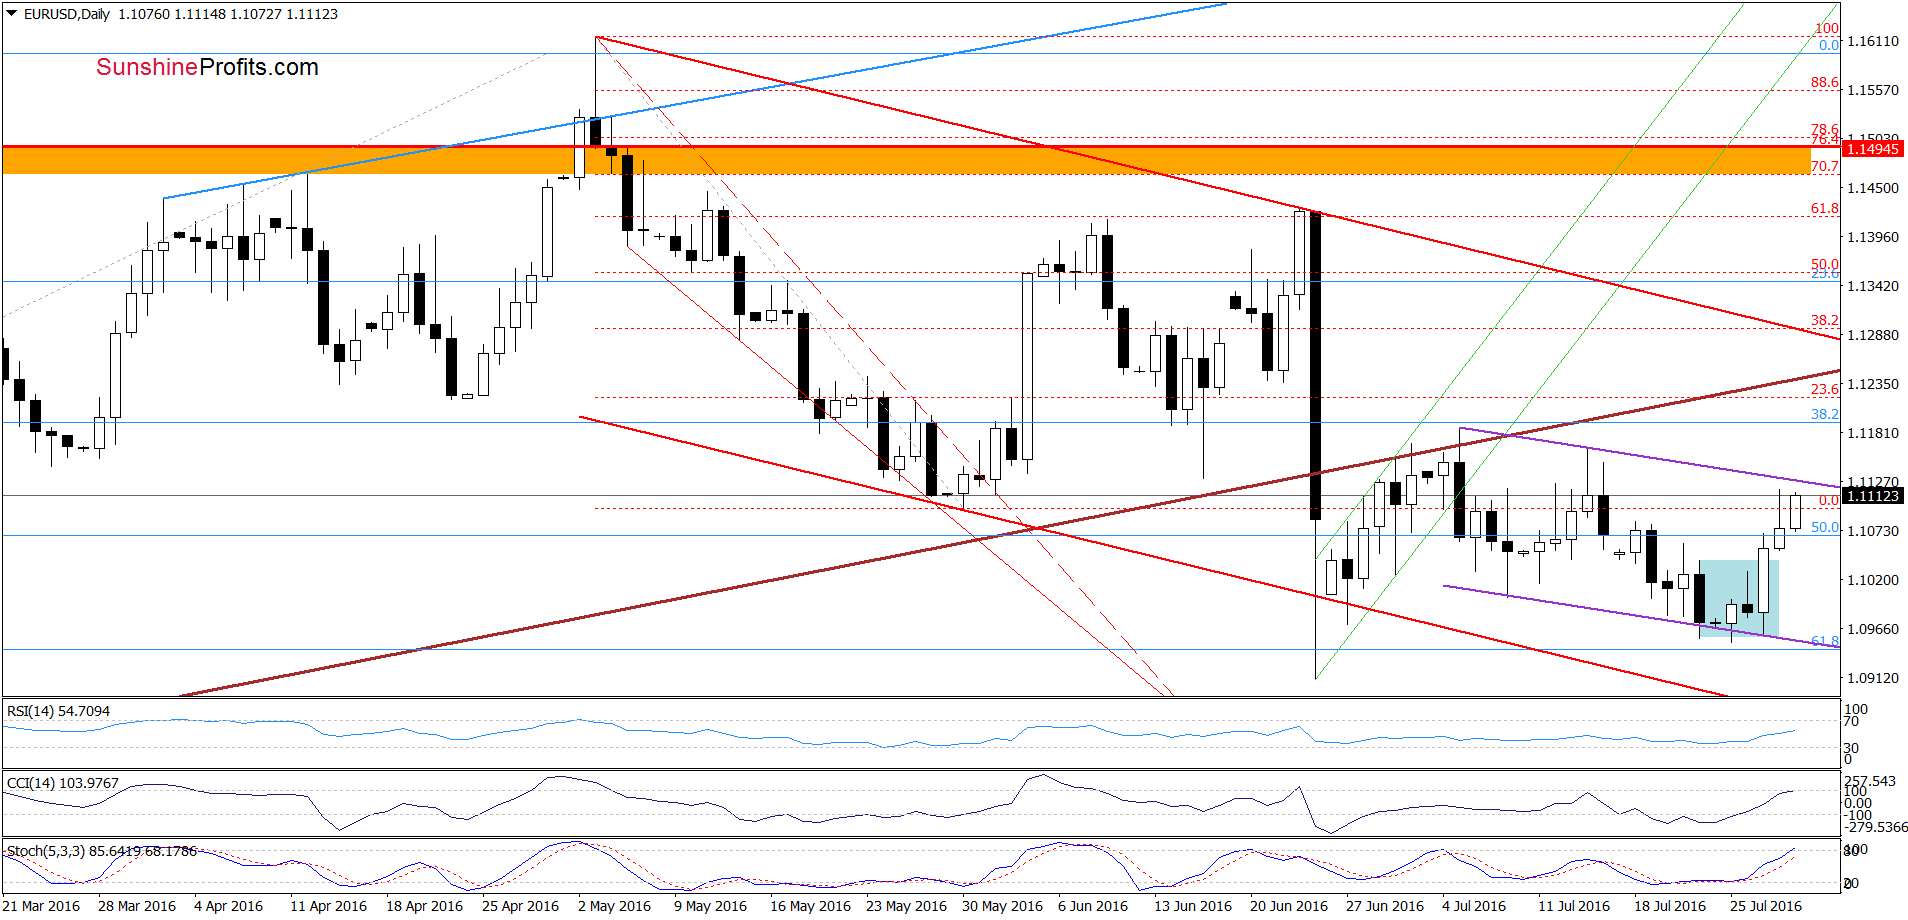
(…) EUR/USD broke above the upper border of the blue consolidation, which triggered further improvement earlier today. Although the pair is still trading in the purple declining trend channel, buy signals generated by the indicators suggest that we may see further improvement in the coming days.
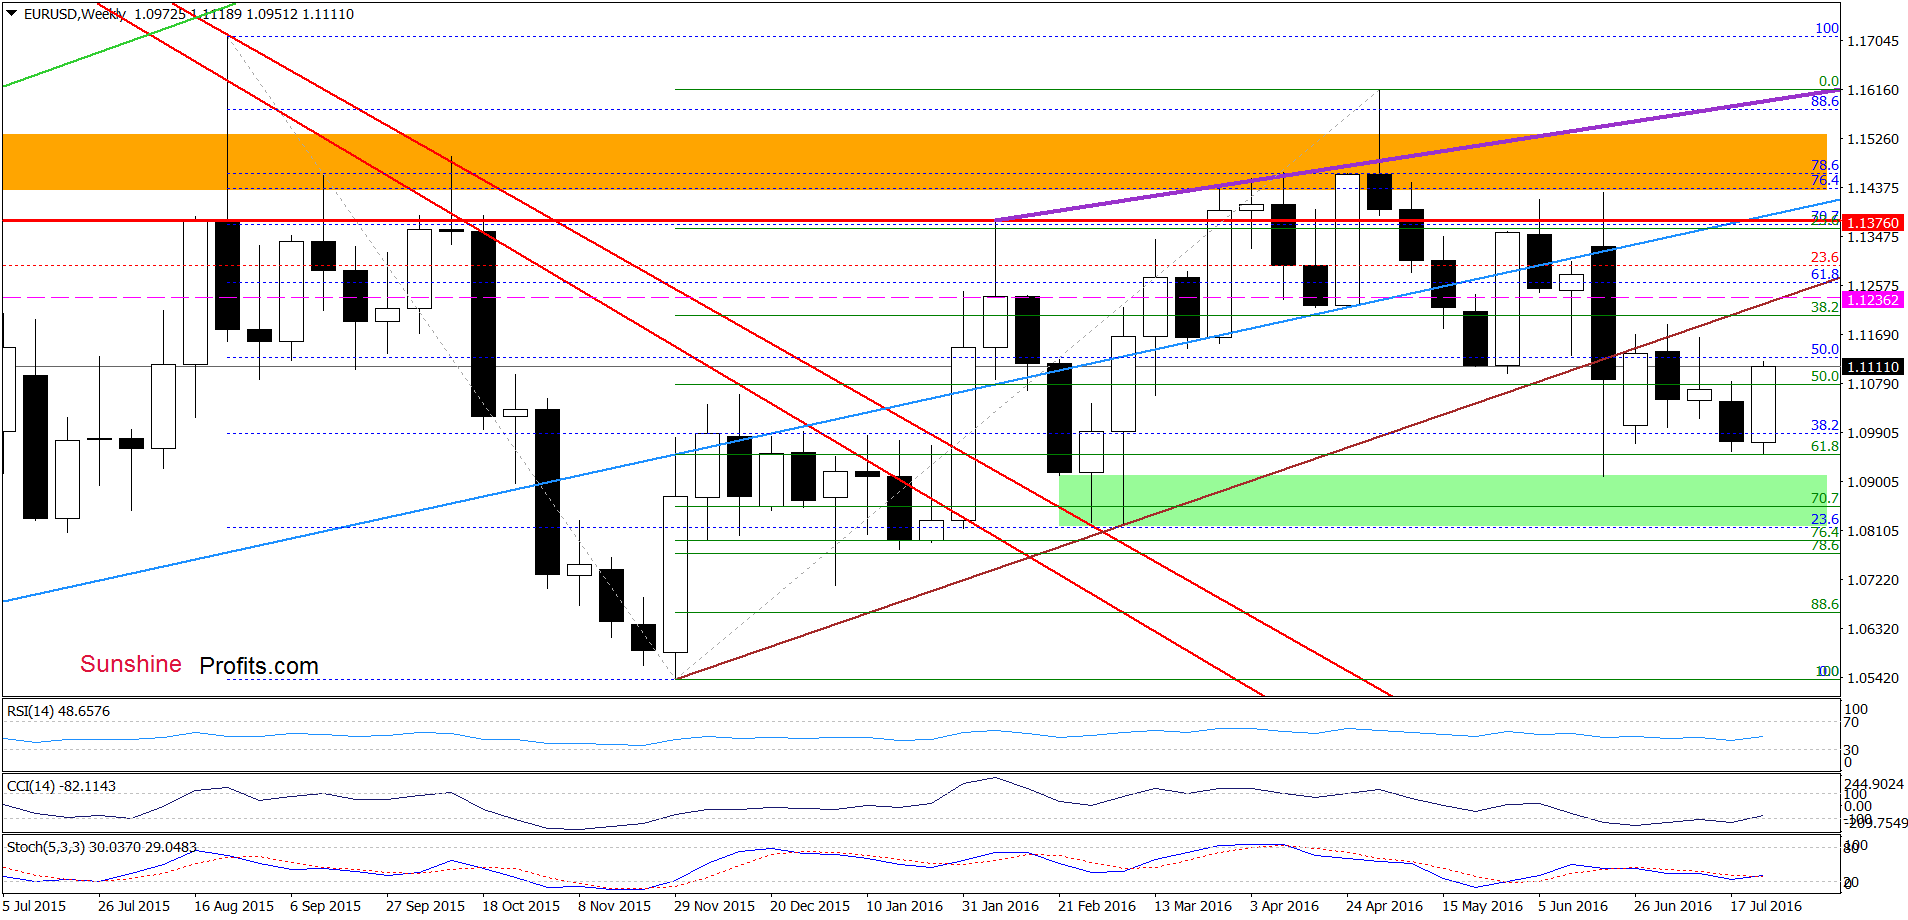
Additionally, we noticed one more pro bullish factor on the weekly chart (…) the CCI and Stochastic Oscillator generated buy signals, increasing the probability of further improvement.
From today’s point of view, we see that the situation developed in line with the above scenario and EUR/USD increased earlier today, approaching the upper border of the purple declining trend channel (this means that closing short position yesterday was a good investment decision, which defended us from losses). Although this resistance may pause currency bulls, buy signals generated by the weekly and daily indicators suggest that higher values of the exchange rate are just around the corner and breakout above this resistance is just a matter of time. Therefore, if we see such price action, EUR/USD may increase to the previously-broken medium-term brown line (seen more clearly on the weekly chart) in the following days.
Very short-term outlook: mixed with bullish bias
Short-term outlook: mixed
MT outlook: mixed
LT outlook: mixed
Trading position (short-term; our opinion): No positions are justified from the risk/reward perspective. We will keep you informed should anything change, or should we see a confirmation/invalidation of the above.
GBP/USD
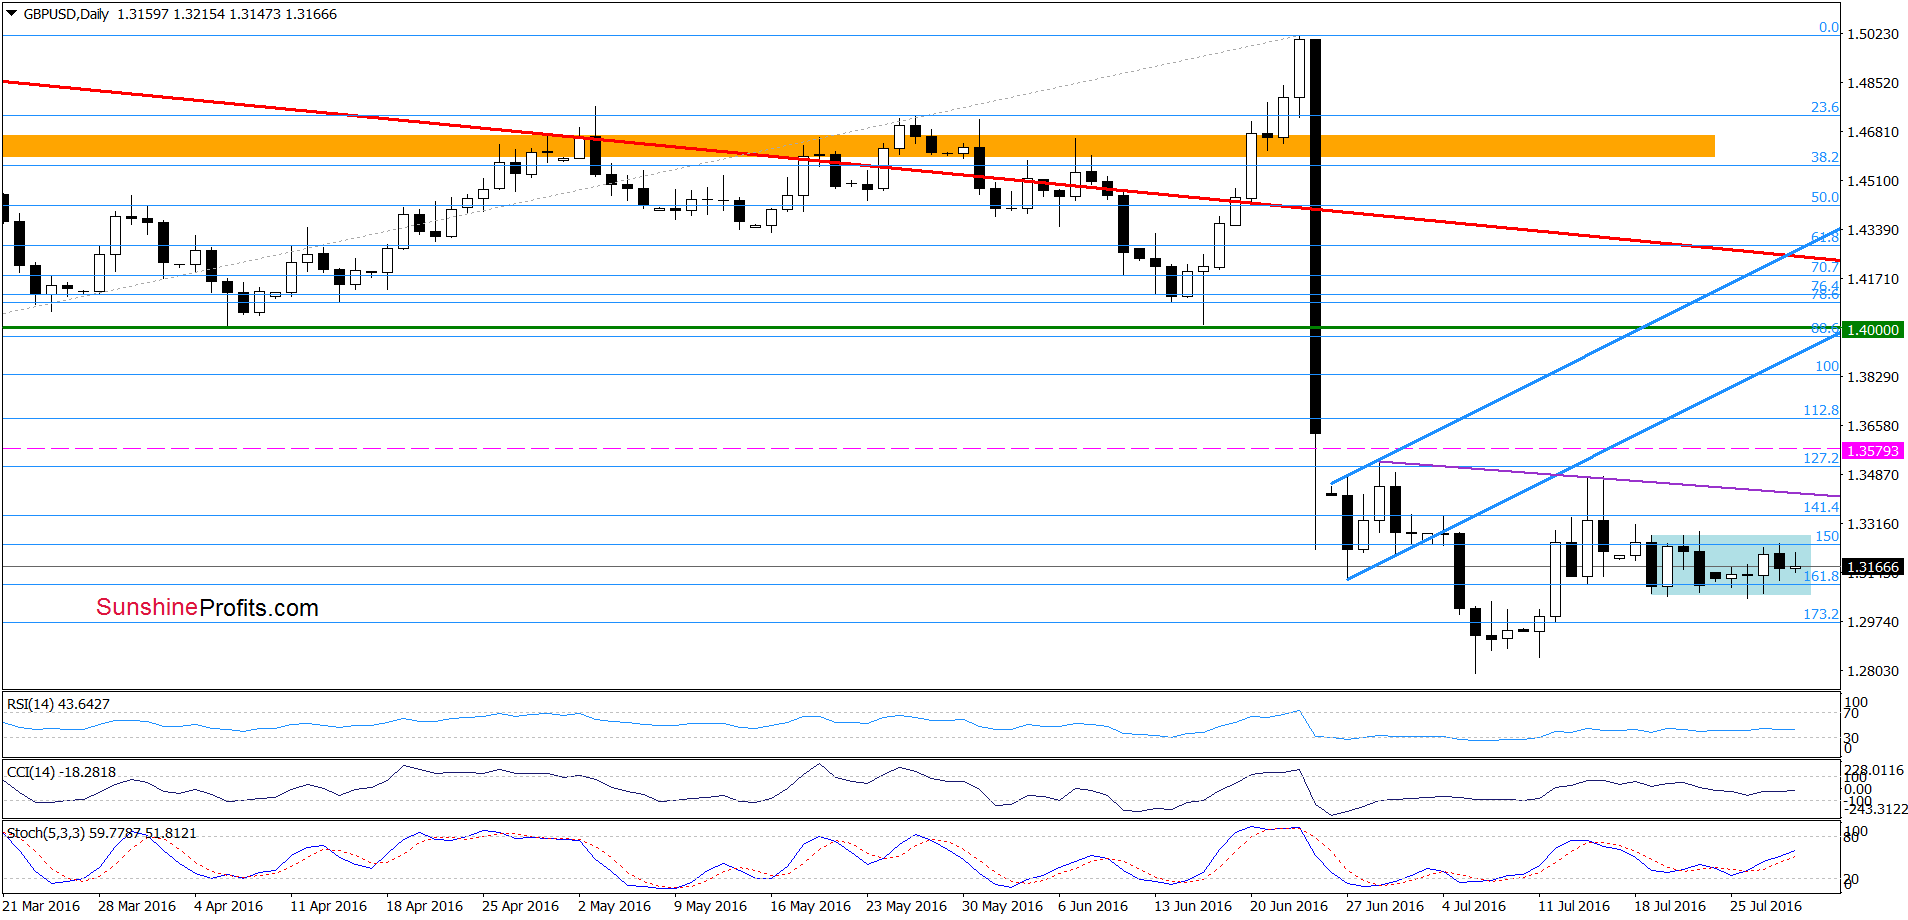
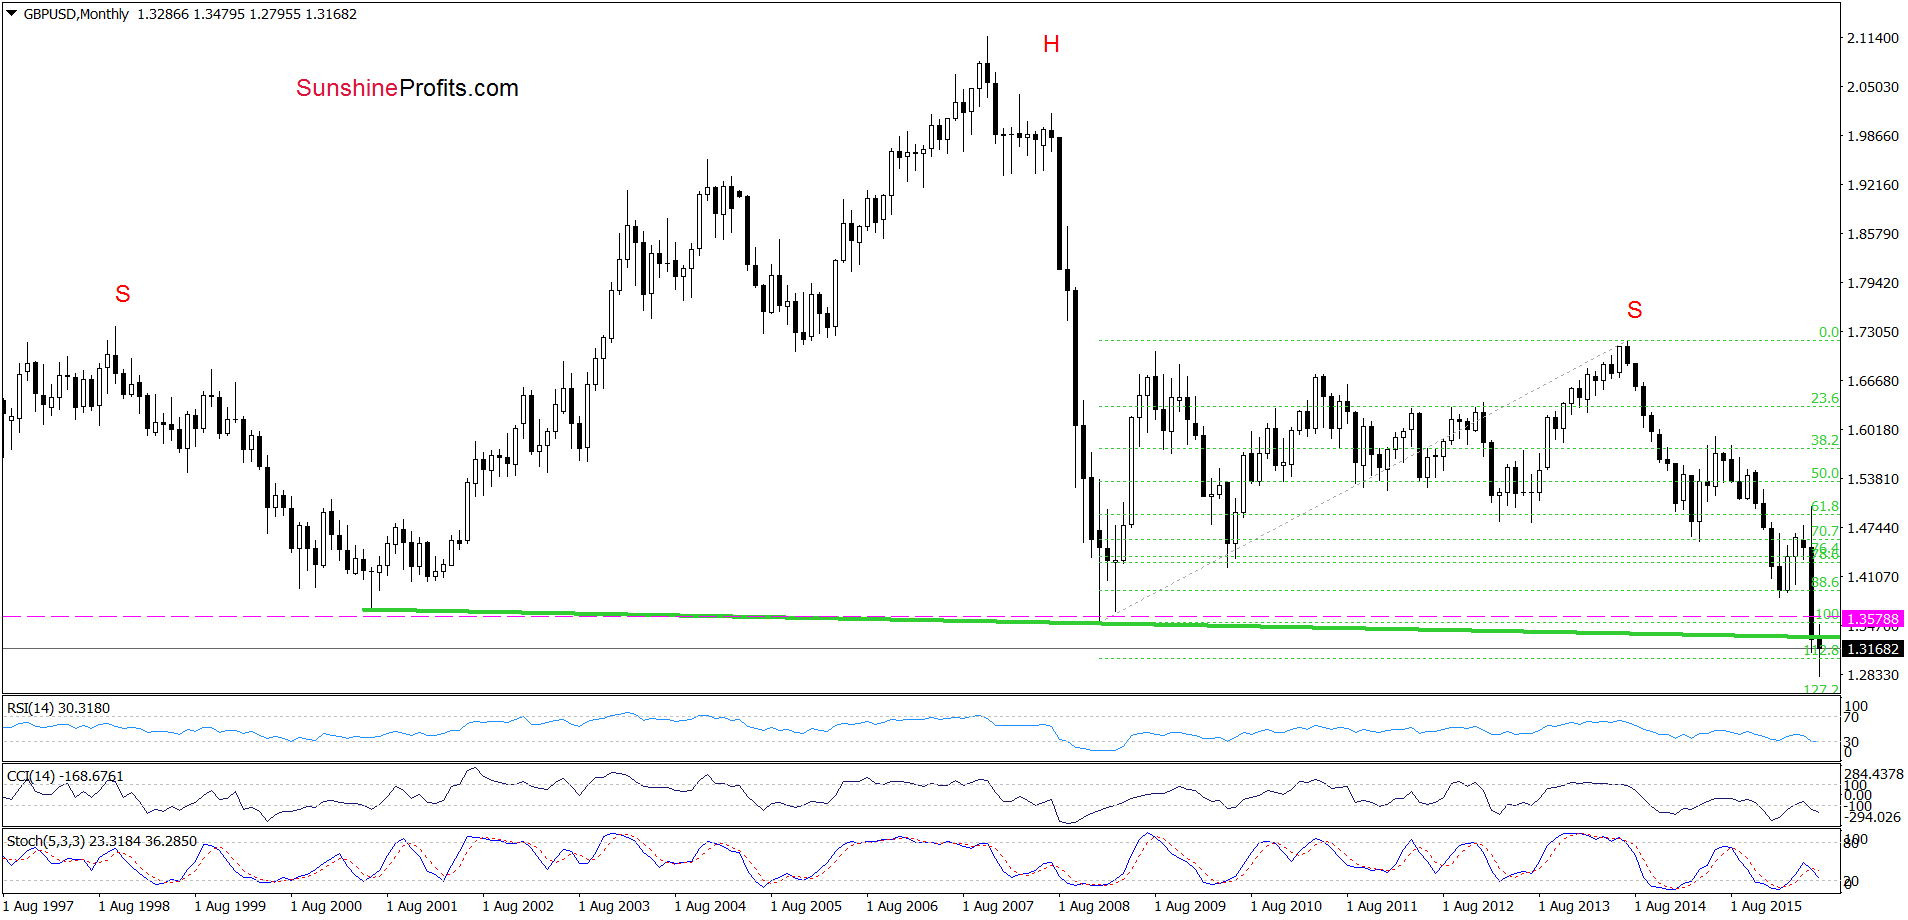
On the daily chart, we see that the overall situation in the short-term remains almost unchanged as GBP/USD is trading in a blue consolidation around a 161.8% Fibonacci extension.
Will the medium-term chart give us more clues about future moves? Let’s check.
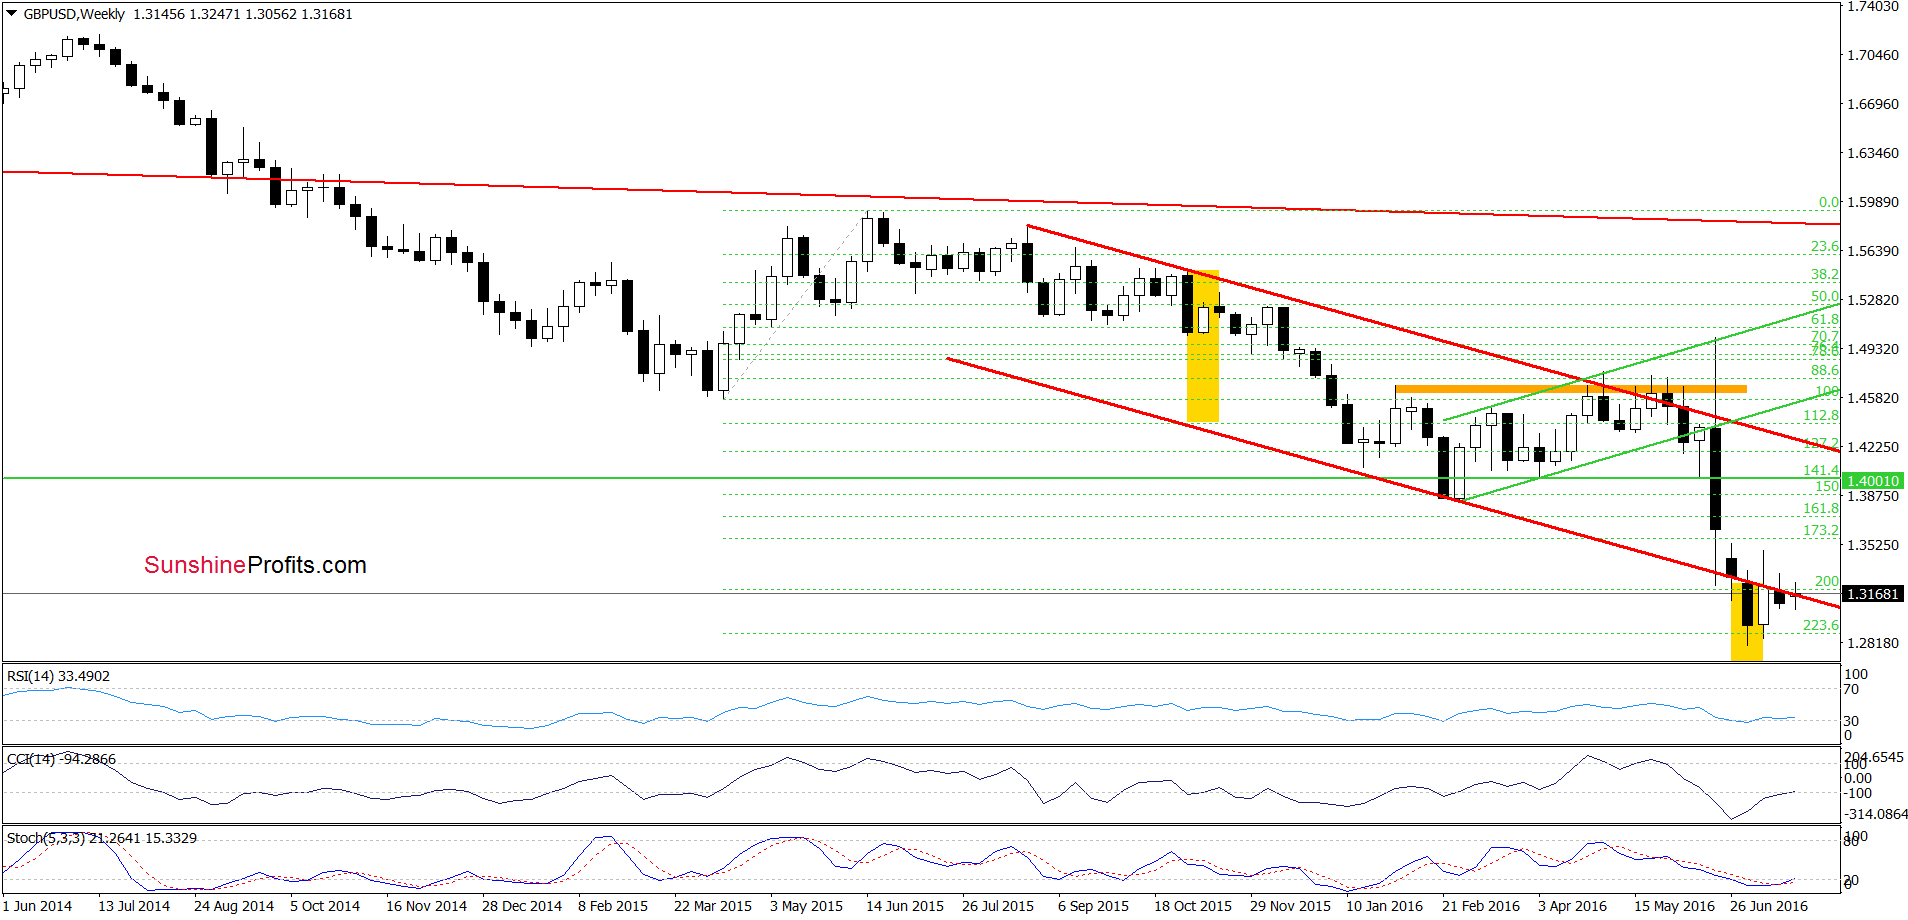
From today’s point of view, we see that the situation in the medium term also hasn’t changed much as GBP/USD is still trading around the lower border of the red declining trend channel. Nevertheless, if the pair closes this week under this important support/resistance line, we’ll receive another verification of earlier breakdown, which will likely trigger further deterioration and lower values of the exchange rate in the coming week. At this point it is also worth noting that despite this week’s price action, the pair is still trading under the neck line of the head and shoulders formation, which means that the long- and medium-term outlooks remain bearish.
Very short-term outlook: mixed with bearish bias
Short-term outlook: mixed with bearish bias
MT outlook: mixed
LT outlook: mixed
Trading position (short-term; our opinion): Short positions with a stop-loss at 1.3579 and the initial downside target at 1.2519 are justified from the risk/reward perspective at the moment. We will keep you informed should anything change, or should we see a confirmation/invalidation of the above.
USD/JPY
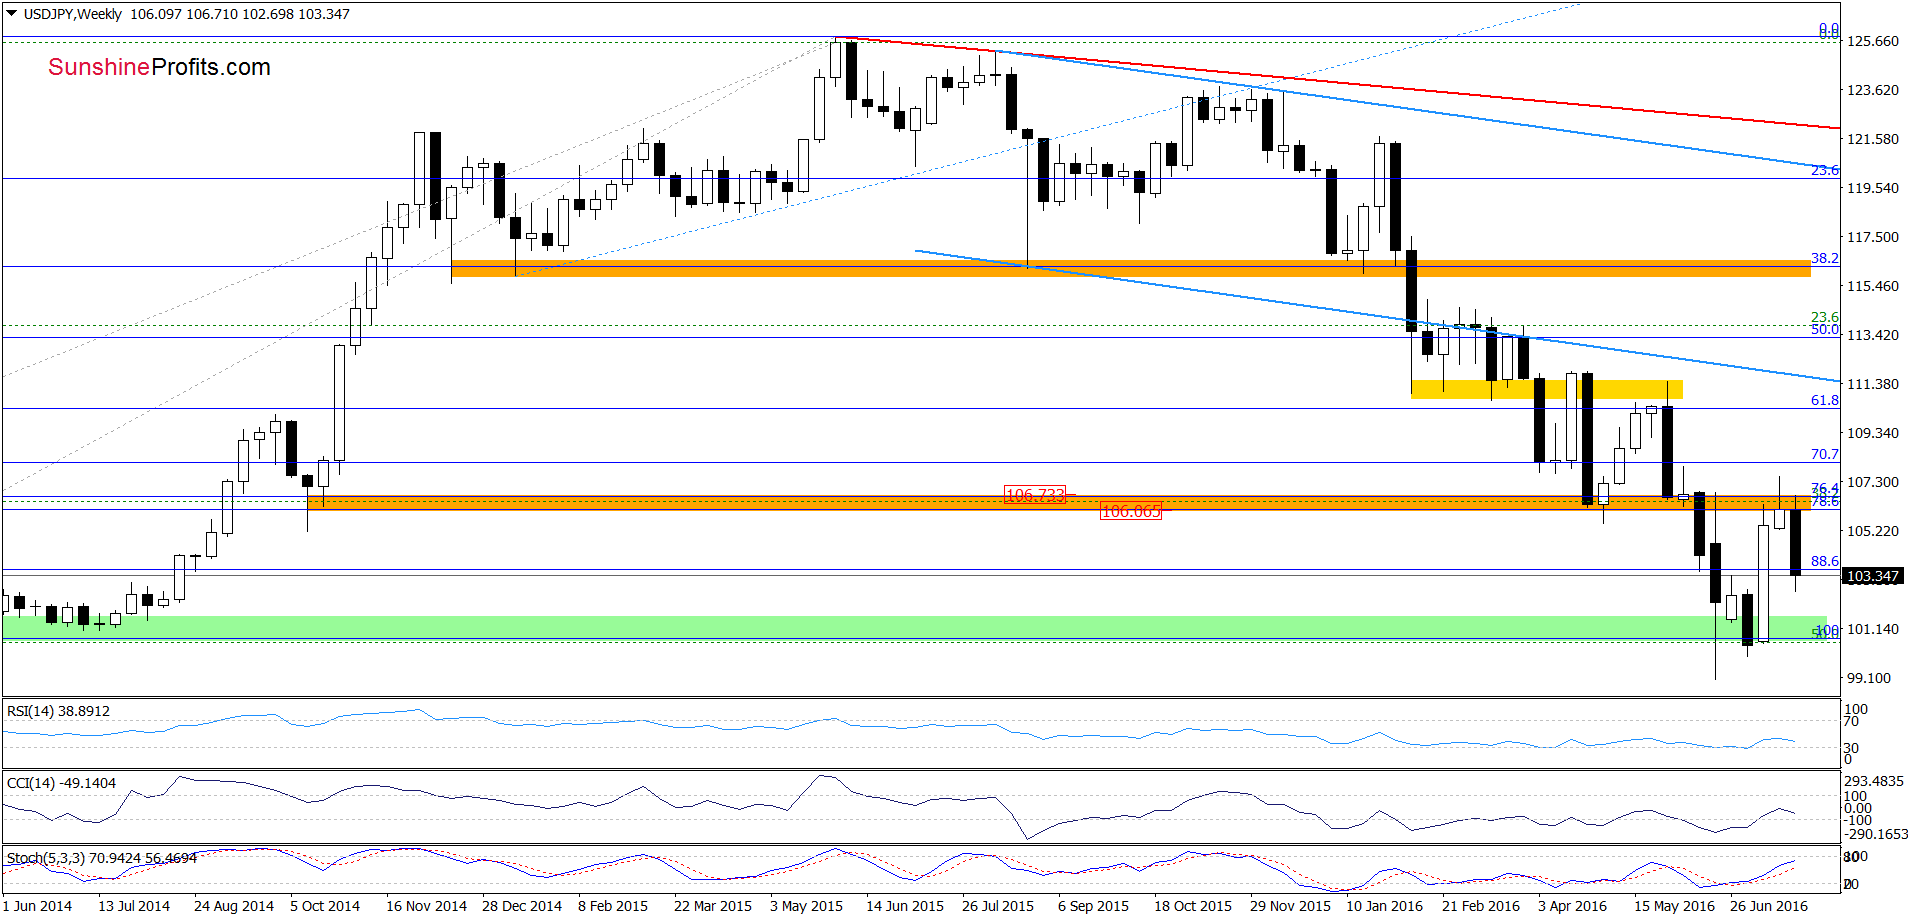
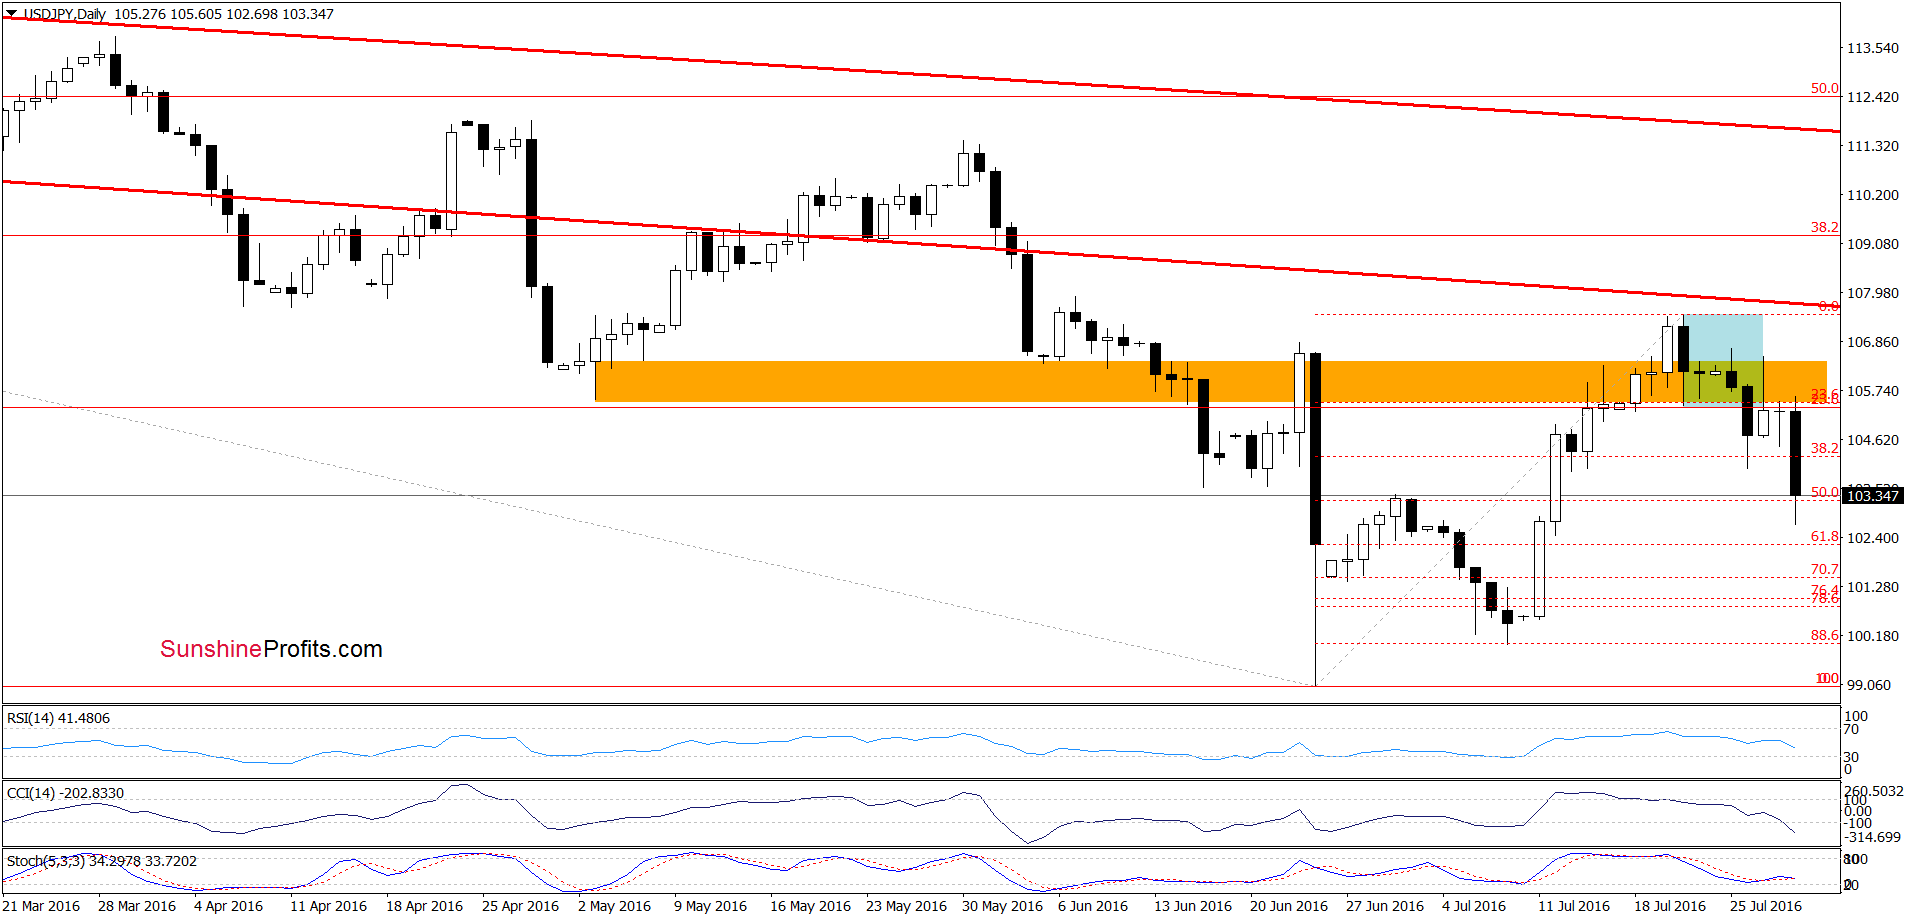
Quoting our Wednesday’s alert:
(…) the 38.2% Fibonacci retracement encouraged currency bulls to act, which resulted in a rebound earlier today. Although this is a positive signal, we think that as long as there won’t be a daily closure above the orange resistance zone (…) all upswings may be nothing more than a verification of earlier breakdown (in this case, the pair will decline from current levels and USD/JPY will likely test yesterday’s low in the coming days).
On the above chart, we see that currency bears pushed the pair under the orange zone, which resulted in verification of the breakdown (as we had expected). This negative signal triggered a sharp decline earlier today, which took the exchange rate not only to the recent low, but also to the 50% Fibonacci retracement. Although USD/JPY rebounded slightly from that support, the size of today’s decline and sell signal generated by the Stochastic Oscillator suggest that another attempt to move lower is just around the corner. If this is the case and the pair declines from here, the next downside target will be the 61.8% retracement (around 102.26) or even the support area created by the 76.8% and 78.6% Fibonacci retracement levels (around 100.84-101.02).
Very short-term outlook: bearish
Short-term outlook: mixed with bearish bias
MT outlook: mixed
LT outlook: mixed
Trading position (short-term; our opinion): No positions are justified from the risk/reward perspective at the moment. We will keep you informed should anything change, or should we see a confirmation/invalidation of the above.
Thank you.
Nadia Simmons
Forex & Oil Trading Strategist
Przemyslaw Radomski, CFA
Founder, Editor-in-chief
Gold & Silver Trading Alerts
Forex Trading Alerts
Oil Investment Updates
Oil Trading Alerts

