

Although the U.S. Department of Labor reported that the unemployment rate increased to 4.9% last month from 4.7% in May, the data also showed that the economy added 287,000 jobs in June, beating analysts’ expectations for a 175,000 increase. Thanks to these solid numbers, the USD Index rebounded and erased earlier losses. How did this move affect the euro, Canadian dollar and Swiss franc?
In our opinion the following forex trading positions are justified - summary:
- EUR/USD: short (a stop-loss at 1.1236; initial downside target at 1.0708)
- GBP/USD: short (a stop-loss at 1.3579; initial downside target at 1.2519)
- USD/JPY: none
- USD/CAD: none
- USD/CHF: none
- AUD/USD: none
EUR/USD
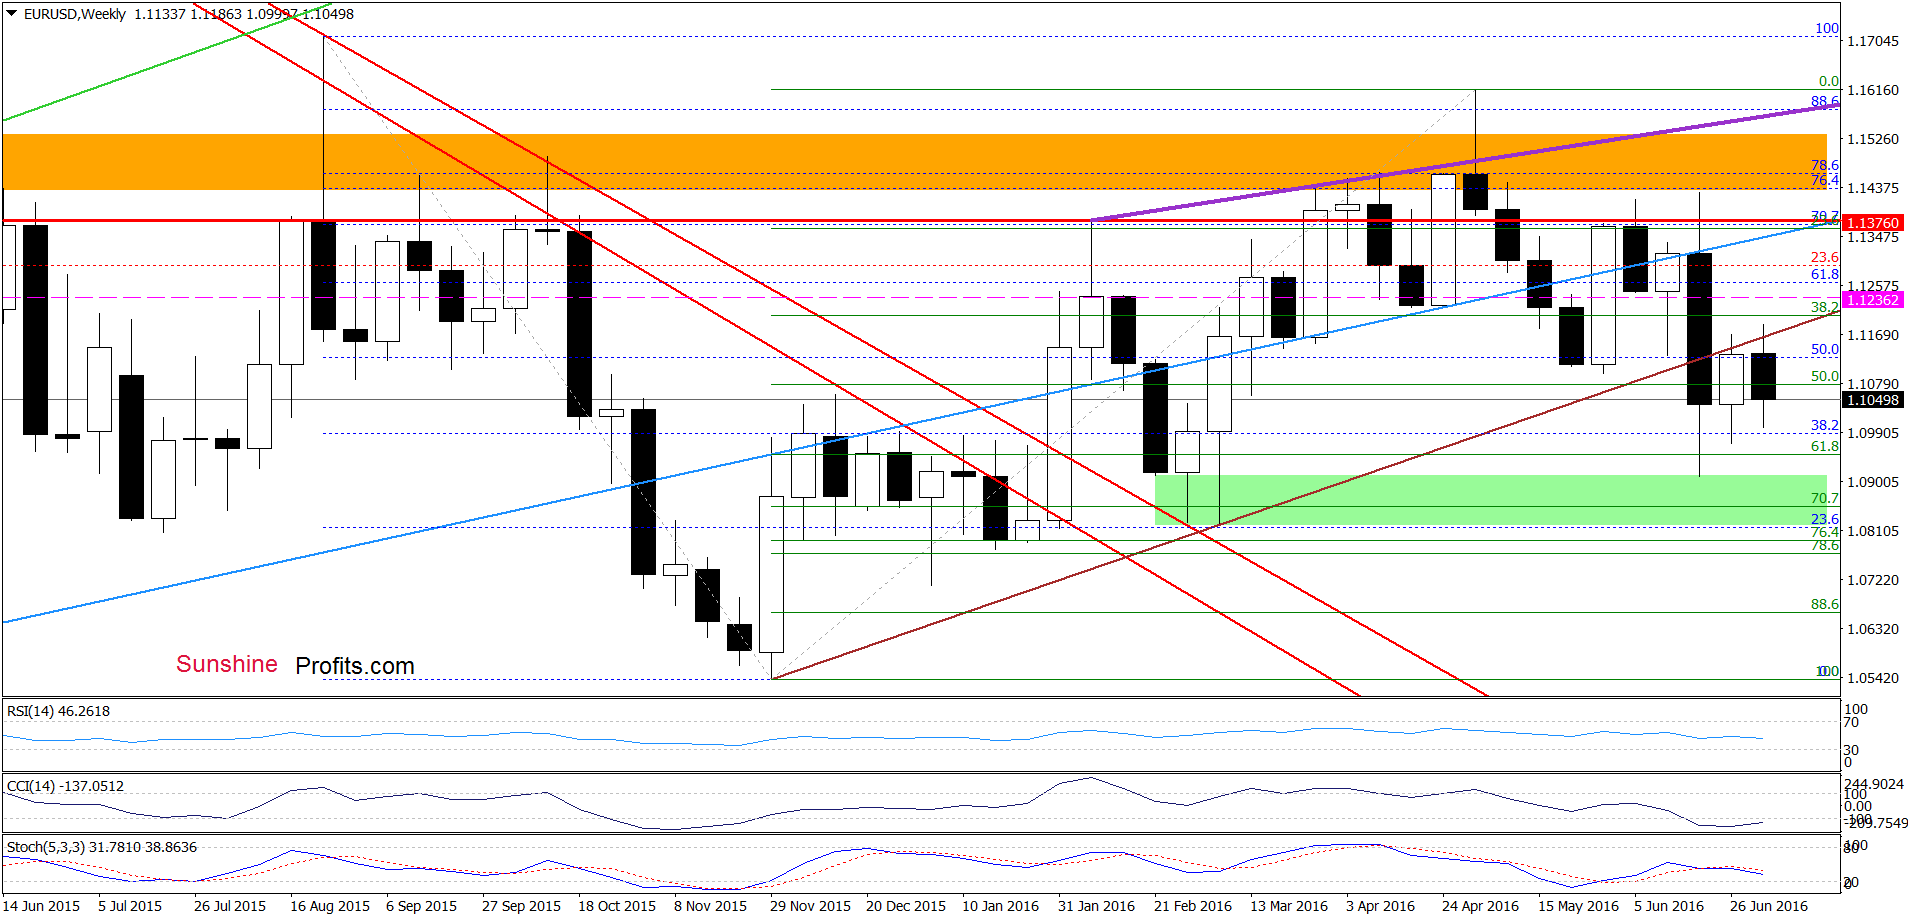
On the weekly chart, we see that the overall situation hasn’t changed much as EUR/USD remains under the previously-broken long-term brown resistance line.
Will the very short-term chart give us more clues about next moves? Let’s check.
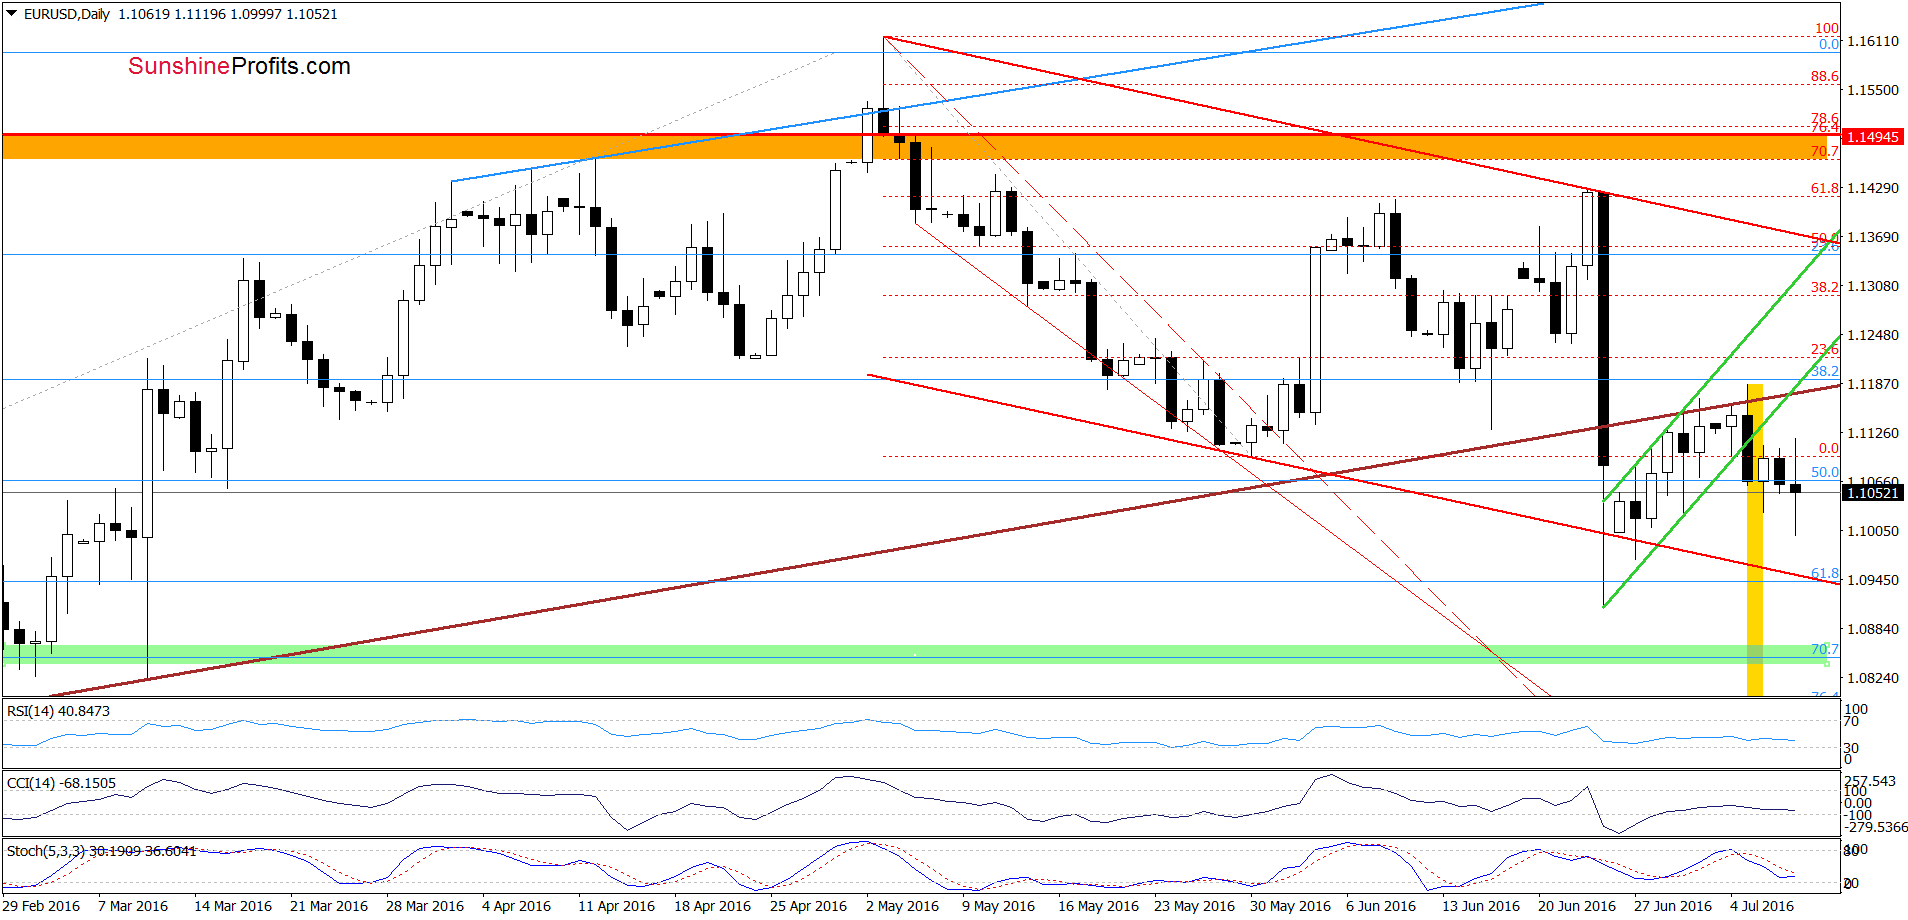
From this perspective, we see that the situation also hasn’t changed much as the exchange rate is consolidating under the previously-broken lower border of the green rising trend channel, which suggests that another attempt to move lower is just around the corner. If this is the case and the pair extends losses, the initial downside target would be the lower border of the red declining trend channel (currently around 1.0948).
Additionally, the risk of a bearish flag formation remains in play, which means that what we wrote yesterday is up-to-date:
(…) the risk of a bearish flag formation increased significantly after the exchange rate verified the breakdown under the long-term brown line and the Stochastic Oscillator generated a sell signal. Taking these facts into account, (…) we may see not only test of the recent low and the 61.8% Fibonacci retracement, but also decline even to around 1.0670, where the size of the move will correspond to the length of the first downward move (please note that slightly below this level (at 1.0660) is also the 88.6% Fibonacci retracement based on the entire Dec-May upward move, which serves as an additional support that may pause declines).
Finishing today’s commentary on his currency pair, we would like to draw your attention to the long-term chart.
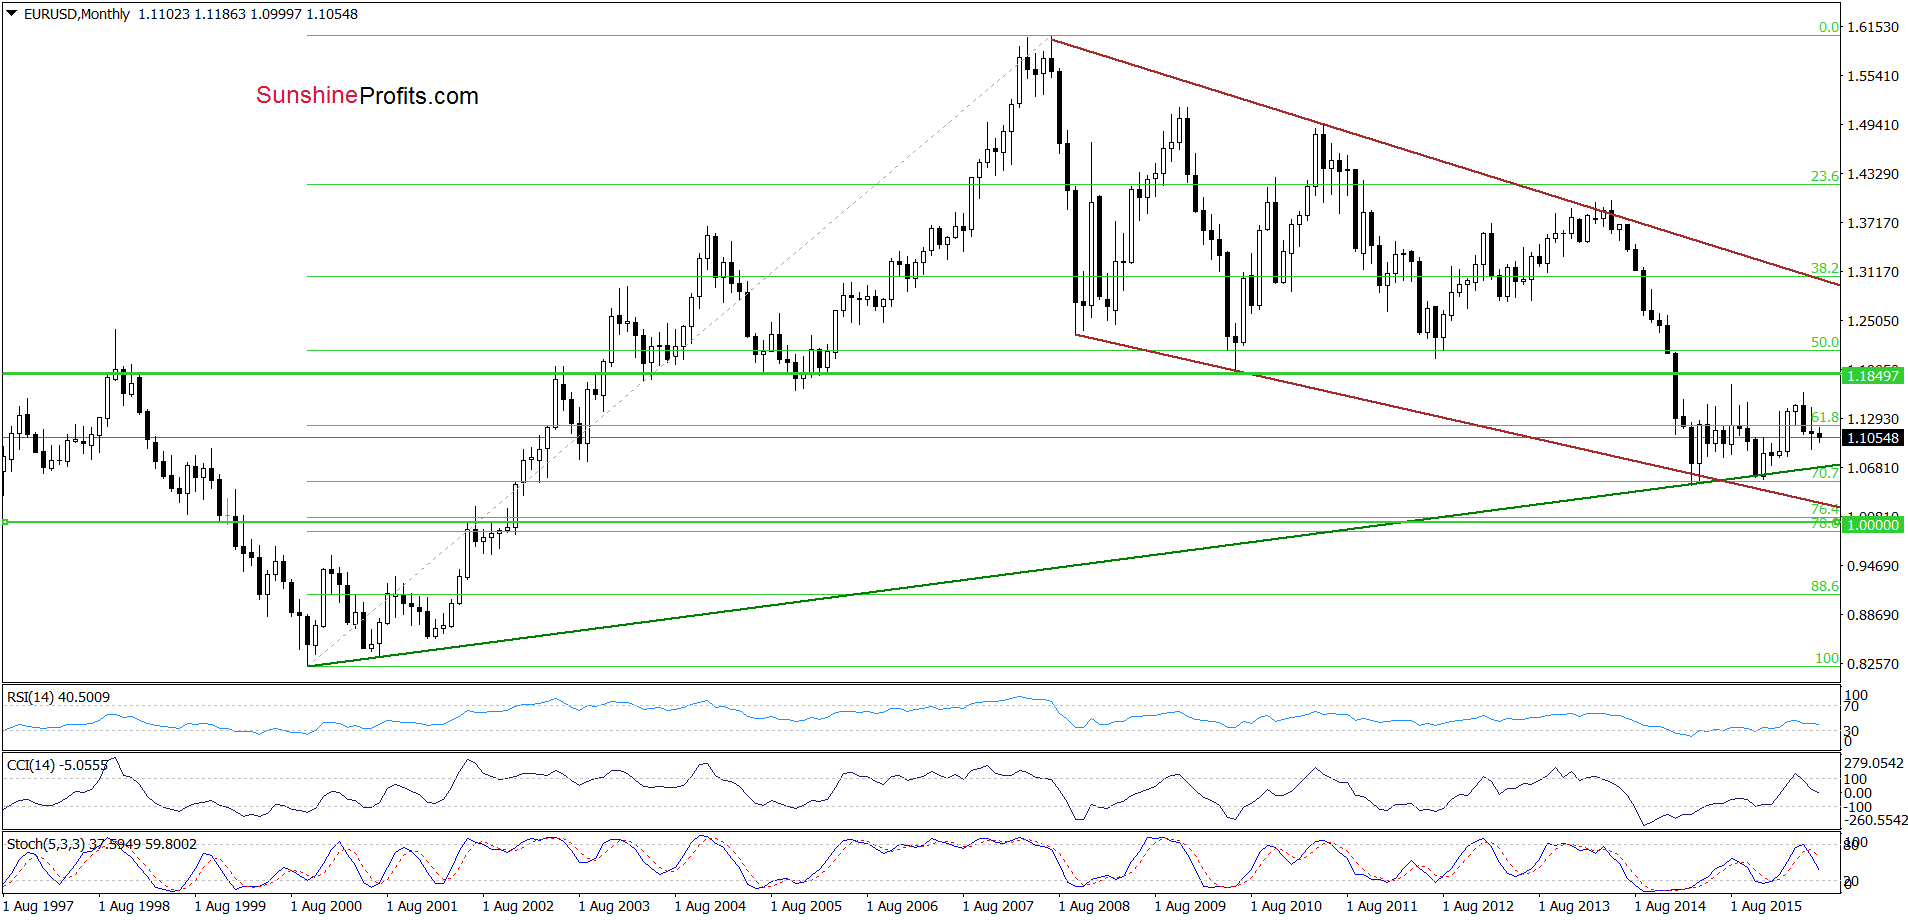
On the monthly chart, we see that sell signals generated by the indicators remain in place, supporting further deterioration and a re-test of the strength of the long-term green support line (currently around 1.0708) in the coming week(s).
Very short-term outlook: bearish
Short-term outlook: bearish
MT outlook: mixed with bearish bias
LT outlook: mixed
Trading position (short-term; our opinion): Short positions with a stop-loss order at 1.1236 and initial downside target at 1.0708 are justified from the risk/reward perspective. We will keep you informed should anything change, or should we see a confirmation/invalidation of the above.
USD/CAD
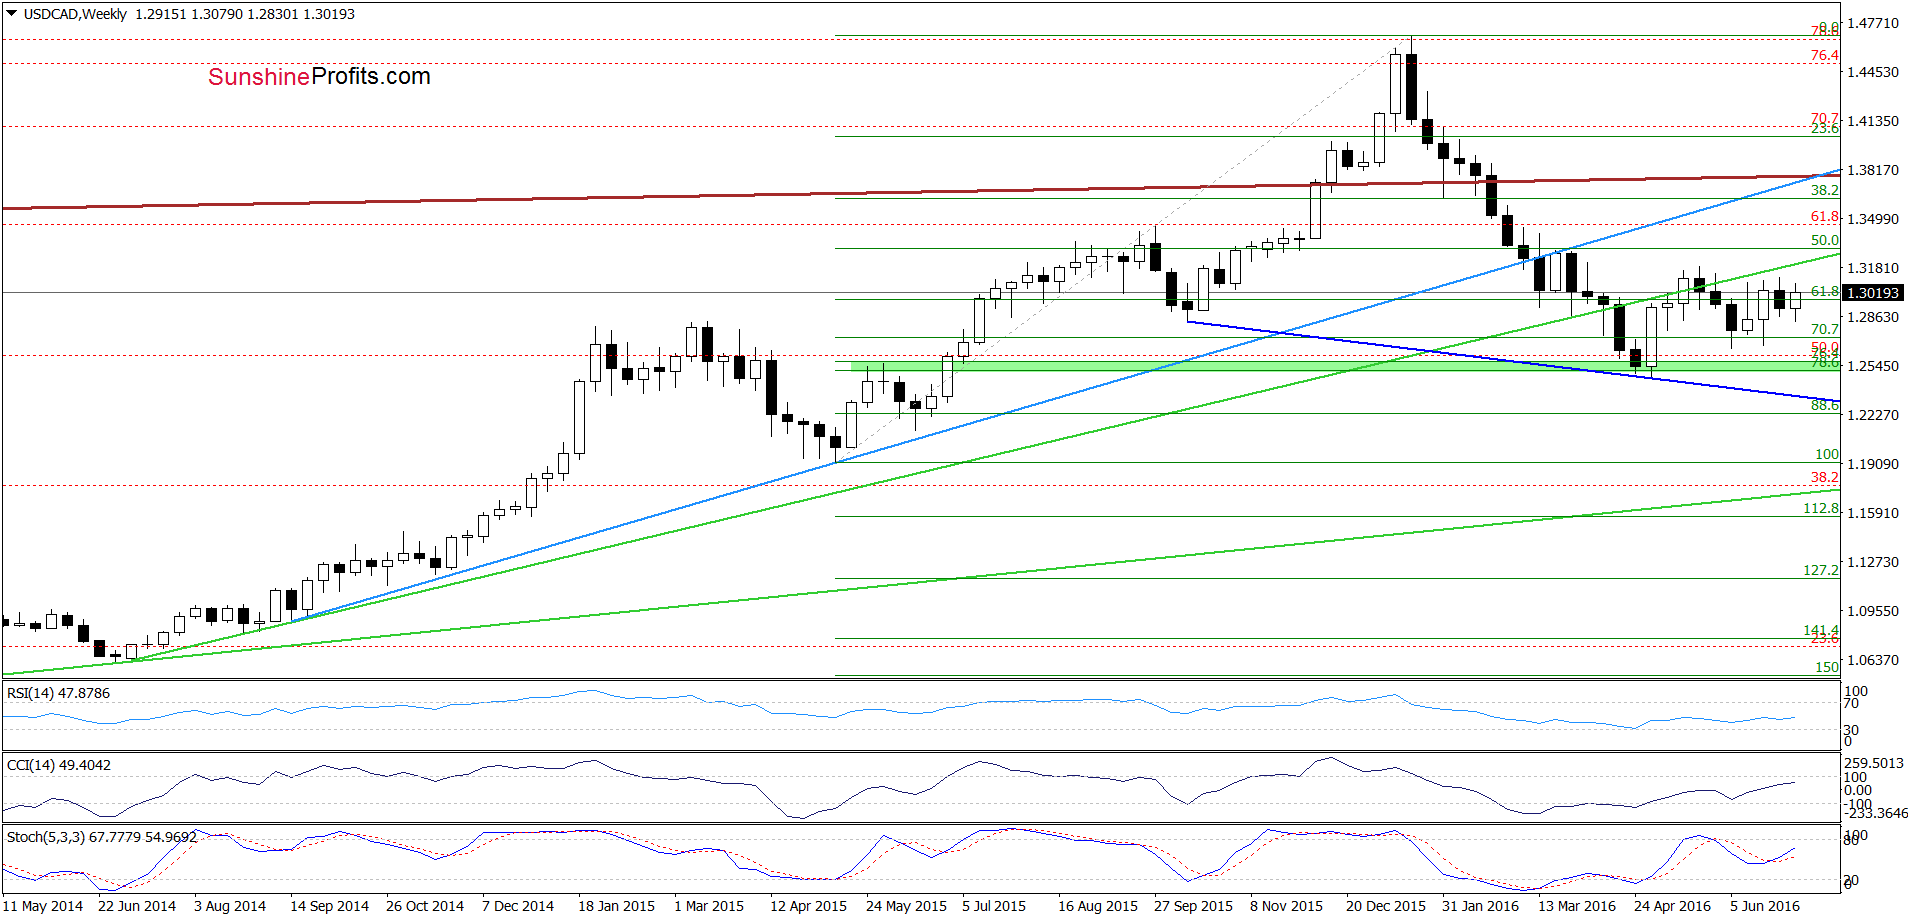
The situation in the medium-term perspective, hasn’t changed much as USD/CAD is consolidating under the long-term green rising line, which serves as the nearest resistance.
Can we infer anything more from the very short-term picture? Let’s examine the daily chart and find out.
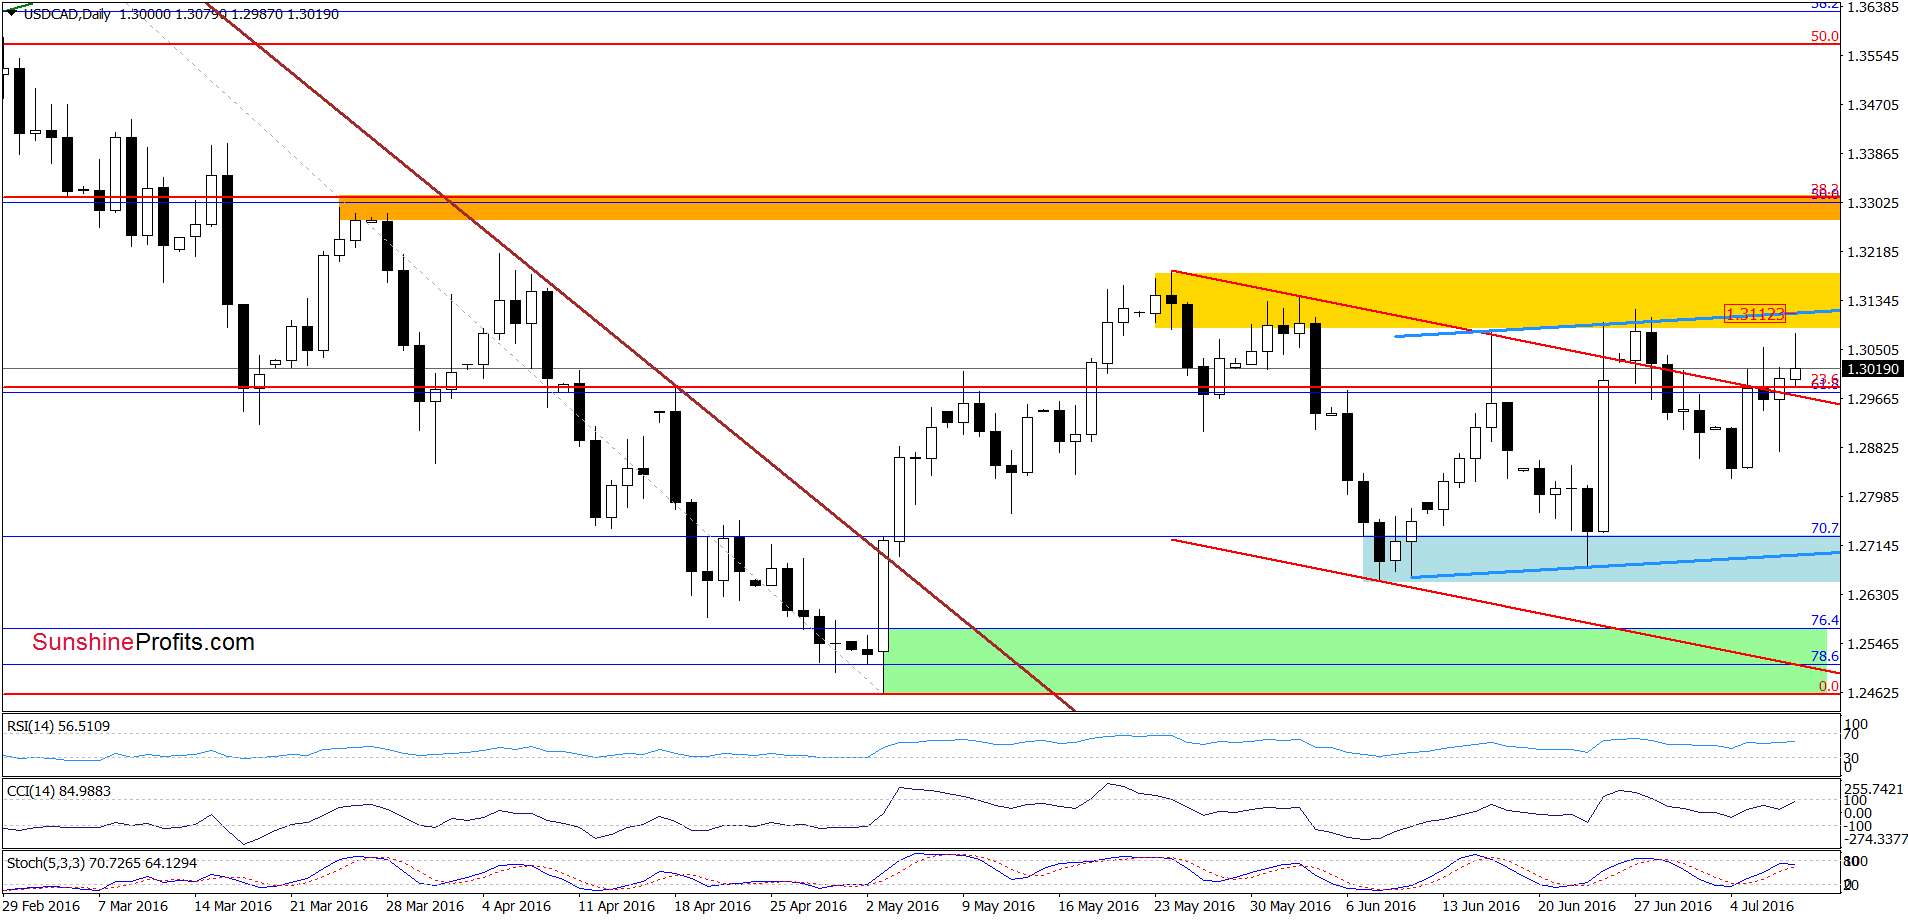
Looking at the daily chart, we see that although USD/CAD gave up some gains and slipped under the red declining line (based on the previous highs), currency bulls didn’t give up and pushed the pair higher, invalidating earlier decline, which triggered further improvement earlier today. Taking this fact into account, it seems that we’ll see further improvement and an increase to around 1.3116, where the upper border of the blue rising trend channel and the yellow resistance zone currently are.
Very short-term outlook: mixed with bullish bias
Short-term outlook: mixed with bullish bias
MT outlook: mixed
LT outlook: mixed
Trading position (short-term; our opinion): No positions are justified from the risk/reward perspective. We will keep you informed should anything change, or should we see a confirmation/invalidation of the above.
USD/CHF
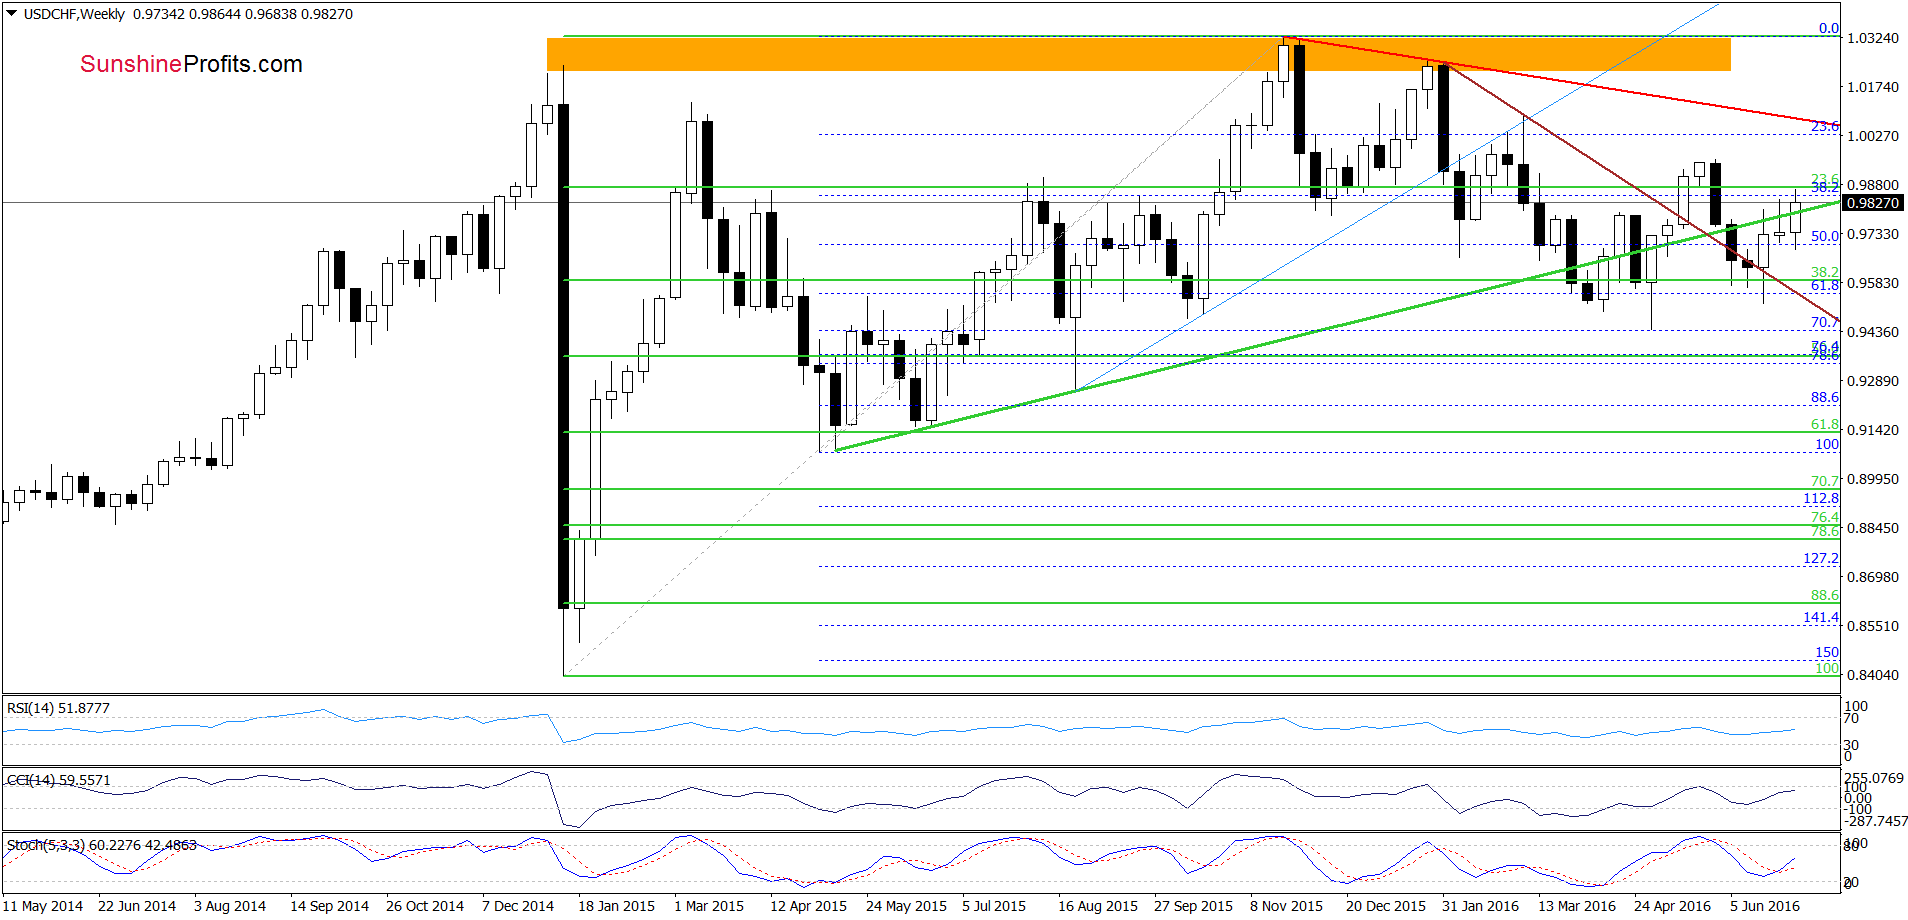
On the weekly chart, we see that USD/CHF broke above the long-term green resistance line, which is a positive signal that suggests further improvement. However, in our opinion such rice action will be more likely if the exchange rate closes the week above this important support/resistance line.
Will currency bulls manage to hold gained levels? Let’s examine the very short-term picture and look for clues about future moves.
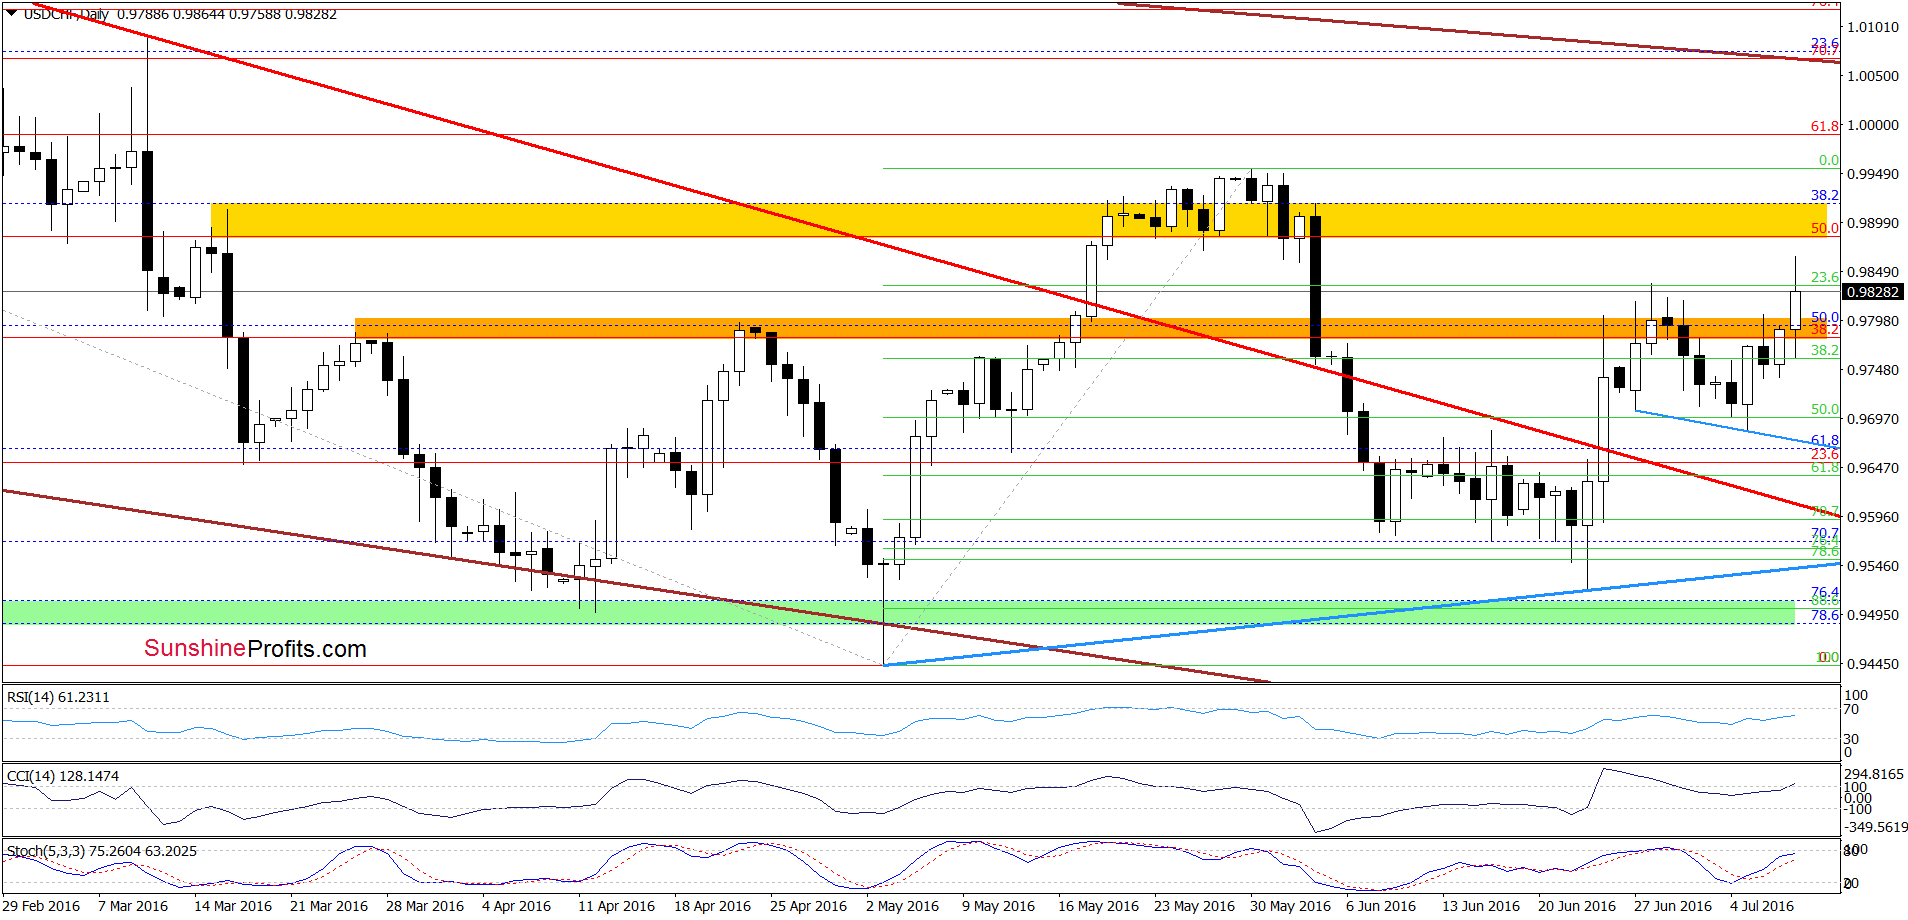
Looking at the daily chart, we see that USD/CHF extended gains in recent days, which resulted in an increase to the orange resistance zone once again. However, buy signals generated by the indicators encouraged currency bulls to act, which resulted in a breakout above this important resistance and a fresh monthly high. What’s next? Taking all the above into account and combining it with buy signals, which are still in lay, we think that the pair will test the yellow resistance zone in the coming week.
Very short-term outlook: mixed with bullish bias
Short-term outlook: mixed with bullish bias
MT outlook: mixed
LT outlook: mixed
Trading position (short-term; our opinion): No positions are justified from the risk/reward perspective. We will keep you informed should anything change, or should we see a confirmation/invalidation of the above.
Thank you.
Nadia Simmons
Forex & Oil Trading Strategist
Przemyslaw Radomski, CFA
Founder, Editor-in-chief
Gold & Silver Trading Alerts
Forex Trading Alerts
Oil Investment Updates
Oil Trading Alerts

