

Earlier today, the USD Index extended losses and slipped under the May 11 low as uncertainty around the next U.S. rate hike continued to weigh on the U.S. currency. Thanks to these circumstances, USD/CAD broke under 1.2700. How low could the exchange rate go in the coming days?
In our opinion the following forex trading positions are justified - summary:
- EUR/USD: none
- GBP/USD: short (stop-loss order at 1.4785; initial downside target at 1.4220)
- USD/JPY: none
- USD/CAD: none
- USD/CHF: none
- AUD/USD: none
EUR/USD
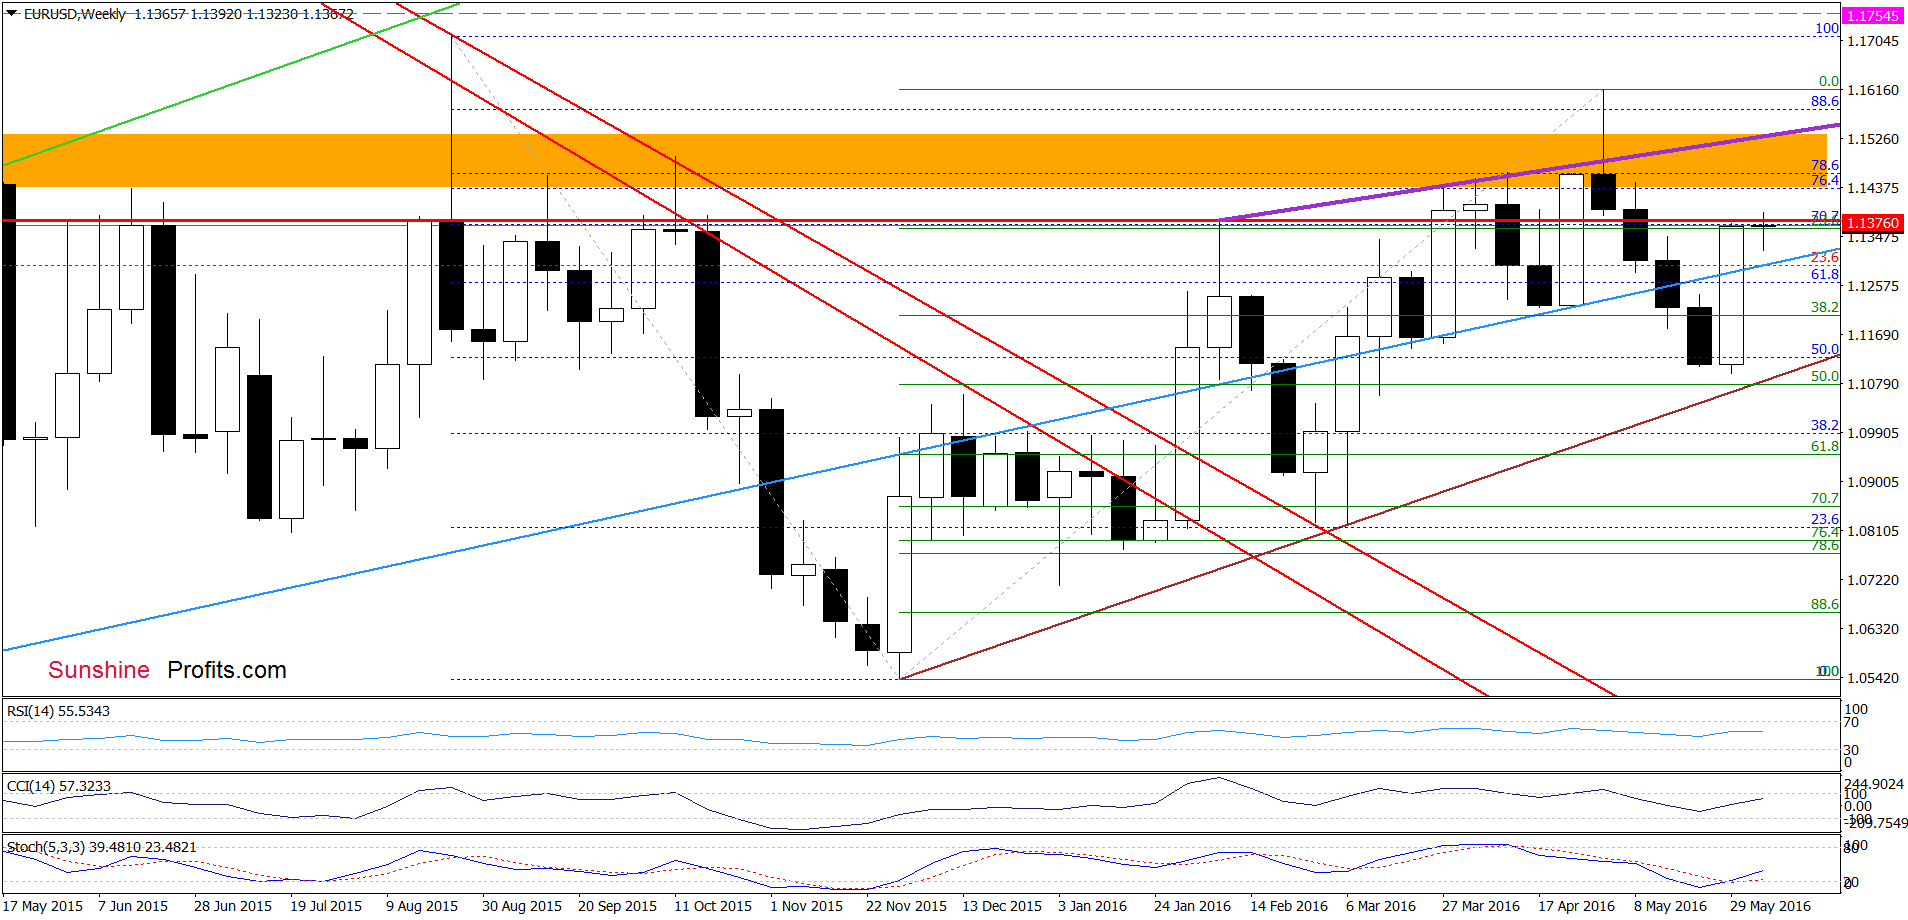
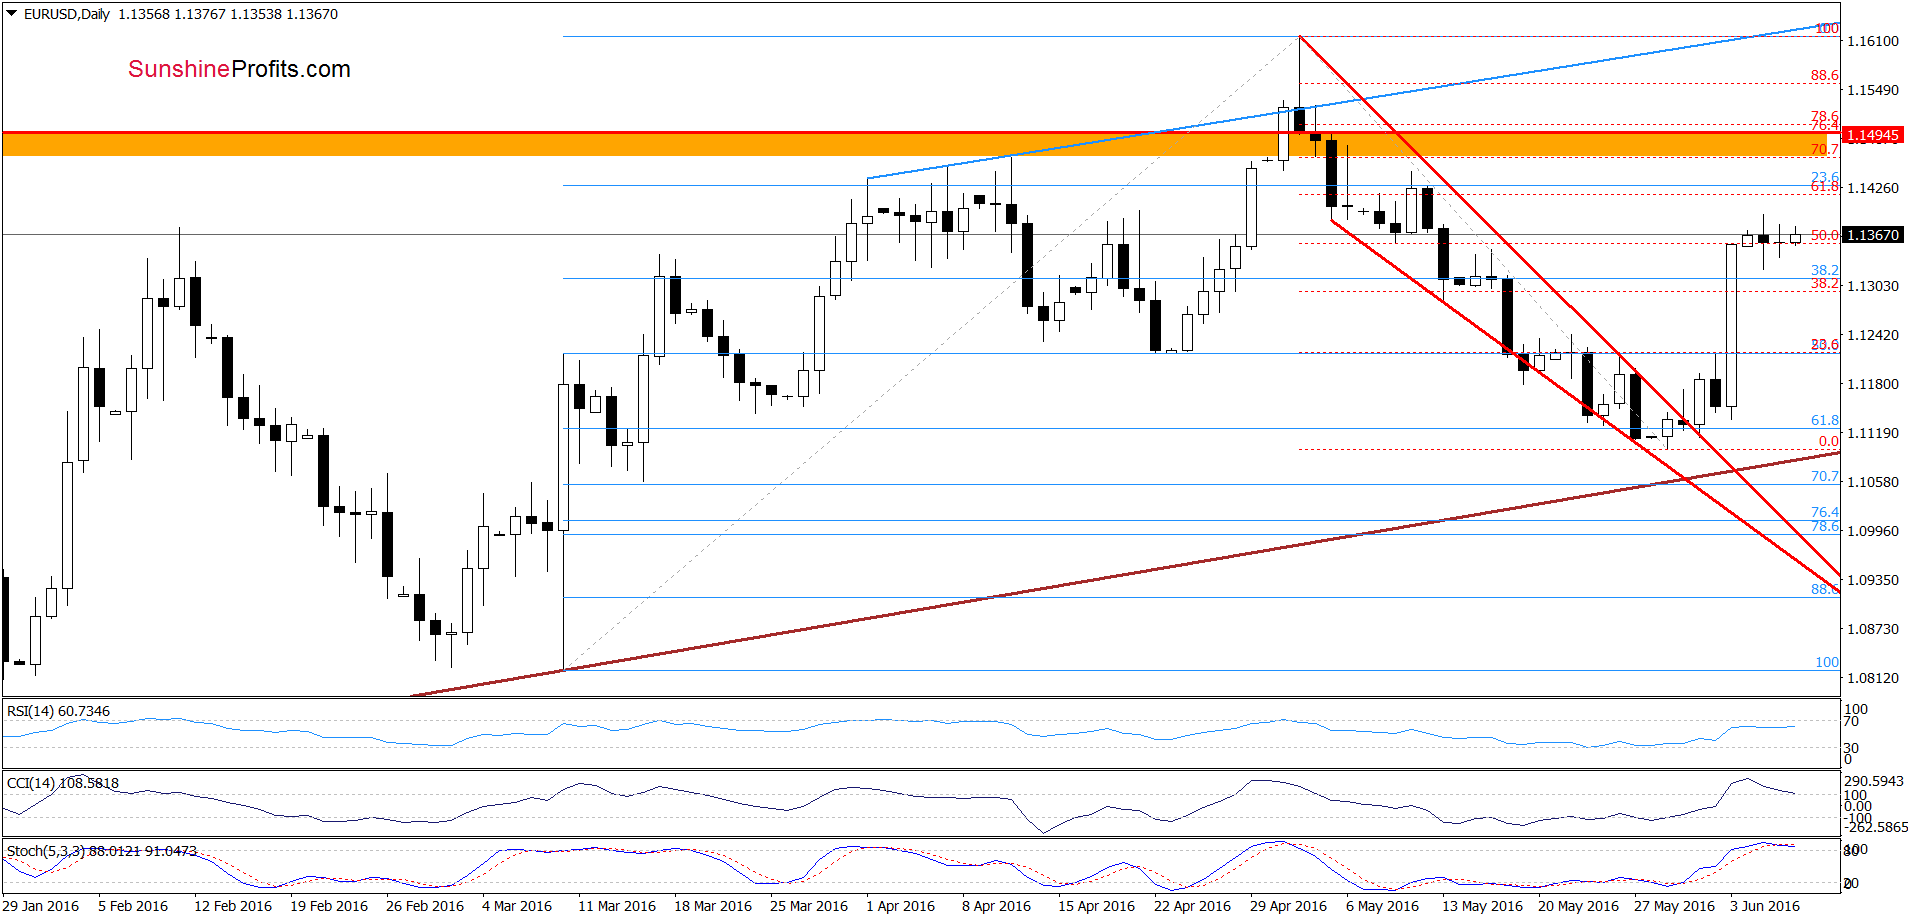
Looking at the above charts, we see that the situation remains almost unchanged as EUR/USD is still trading in a narrow range around the 50% Fibonacci retracement. Therefore, our Monday’s commentary on this currency pair is up-to-date:
(…) currency bulls pushed the exchange rate not only to our initial upside target, but also to the 50% Fibonacci retracement. Taking this fact into account and combining it with the current position of the indicators (the CCI and Stochastic Oscillator are overbought) it seems that reversal is just around the corner. Nevertheless, as long as there won’t be sell signals another attempt to move higher (to the 61.8% retracement and the May 11 and May 12 highs) is likely.
Very short-term outlook: mixed
Short-term outlook: mixed
MT outlook: mixed
LT outlook: mixed
Trading position (short-term; our opinion): No positions are justified from the risk/reward perspective. We will keep you informed should anything change, or should we see a confirmation/invalidation of the above.
USD/CAD
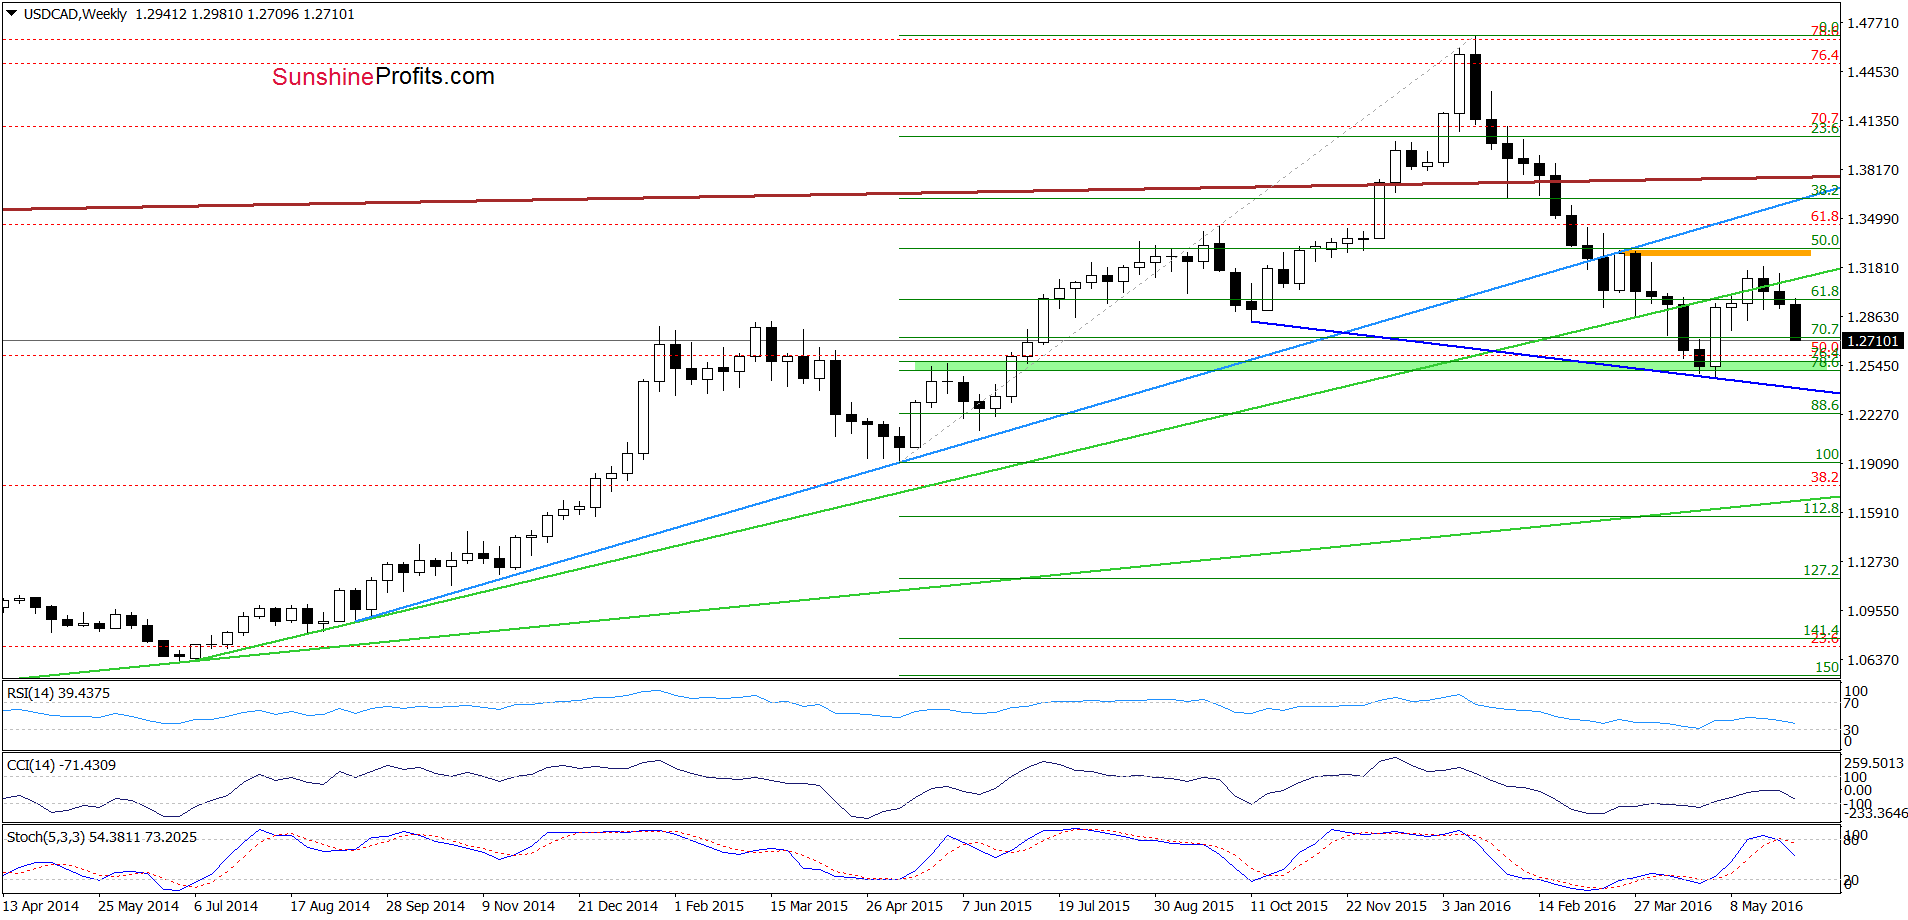
Quoting our last commentary on this currency pair:
(…) USD/CAD verified earlier breakdown under the green line, which triggered a decline. Earlier today, the pair extended losses, which in combination with a sell signal generated by the Stochastic Oscillator suggests further deterioration in the coming week.
On the weekly chart, we see that the situation developed in tune with the above scenario and USD/CAD extended losses, which suggests a test of the green support zone in the coming days.
What impact did this drop have on the very short-term picture? Let’s check.
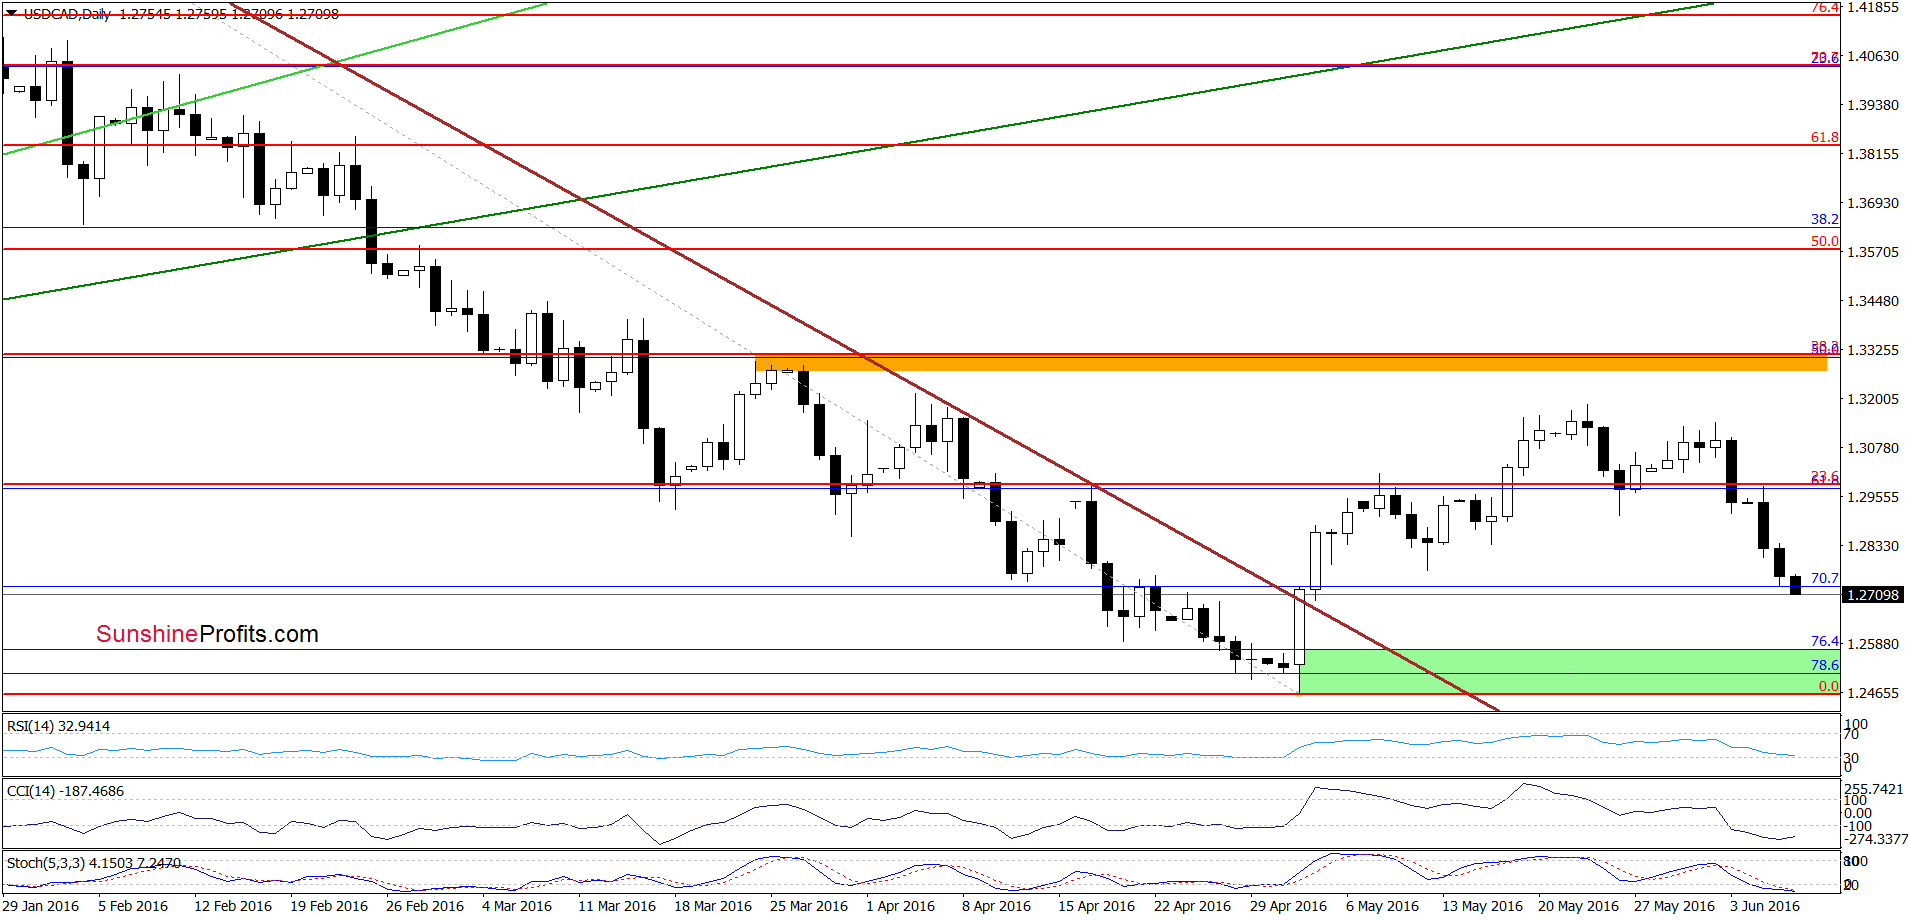
From this perspective, we see that USD/CAD declined under the mid-May low, which triggered further deterioration. Taking this fact into account and combining it with the medium-term picture, we think that the pair would re-test recent lows in the coming days.
Very short-term outlook: bearish
Short-term outlook: mixed with bearish bias
MT outlook: mixed
LT outlook: mixed
Trading position (short-term; our opinion): No positions are justified from the risk/reward perspective. We will keep you informed should anything change, or should we see a confirmation/invalidation of the above.
AUD/USD
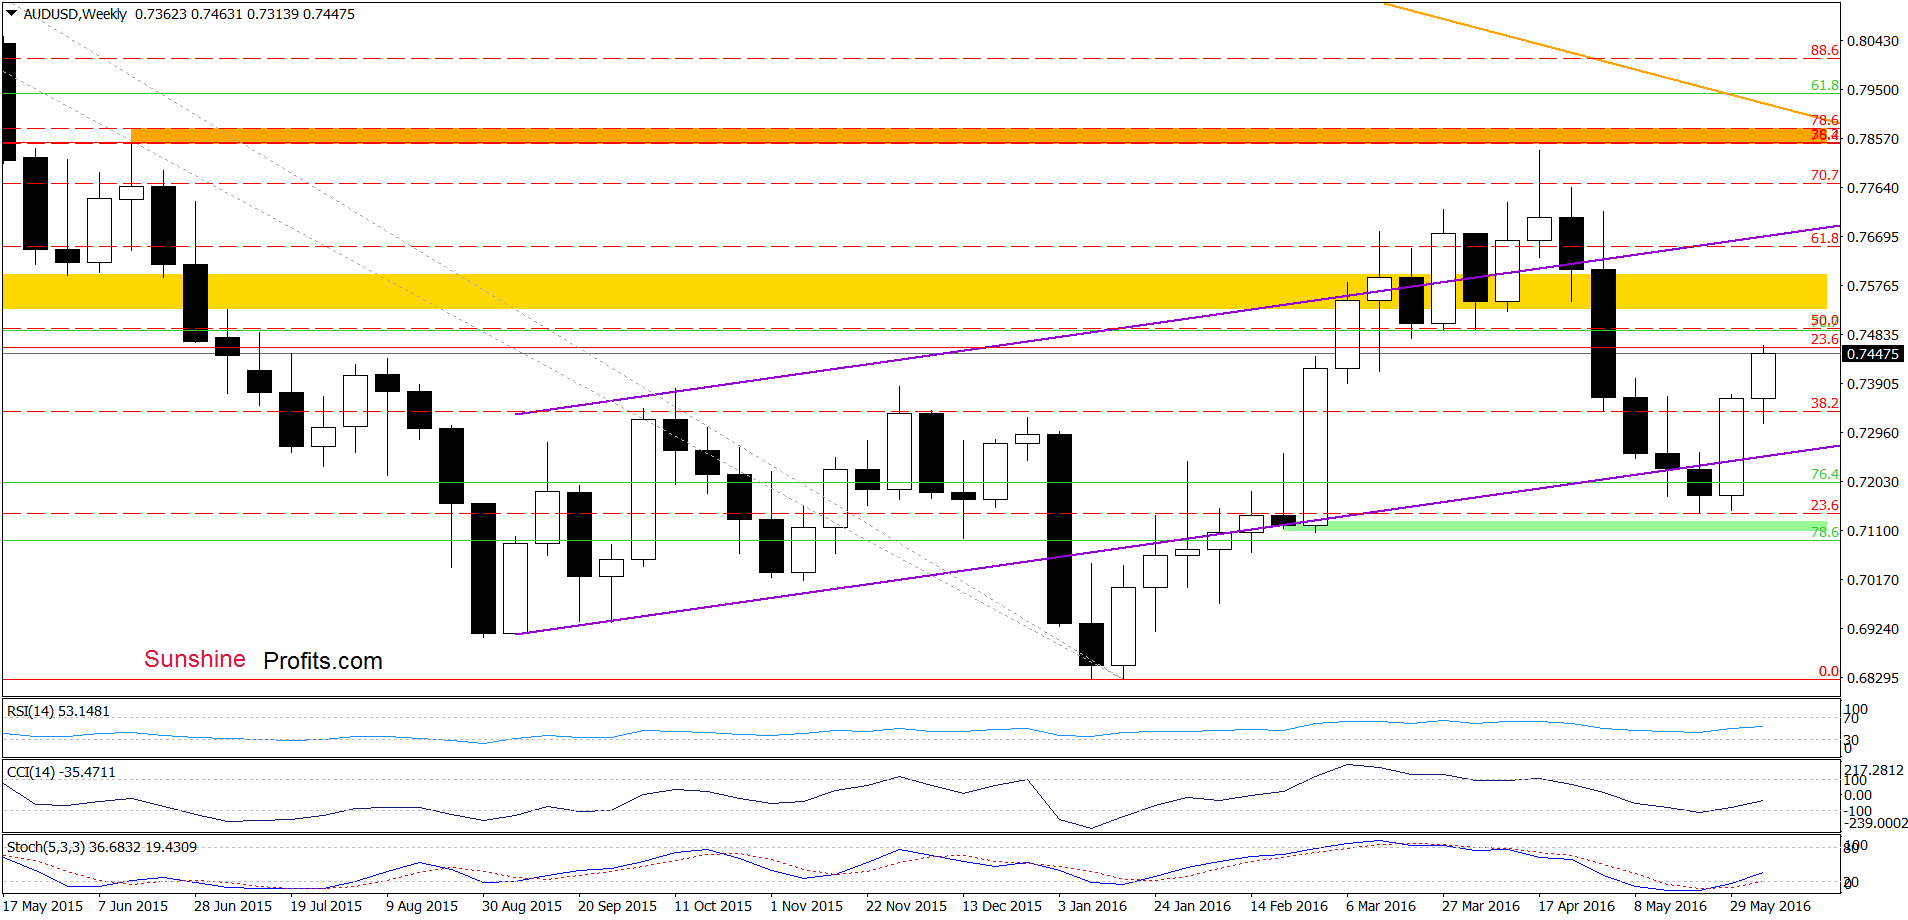
On Monday, we wrote:
The first thing that catches the eye on the weekly chart is invalidation of the breakdown under the lower border of the purple rising trend channel, which is a positive signal that suggests further improvement in the coming week. This scenario is also supported by the current position of the indicators – the CCI and Stochastic Oscillator generated buy signals, supporting currency bulls.
As you see on the weekly chart, currency bulls pushed the pair higher, which resulted in a climb above 0.7400. How did this increase affect the daily chart? Let’s check.
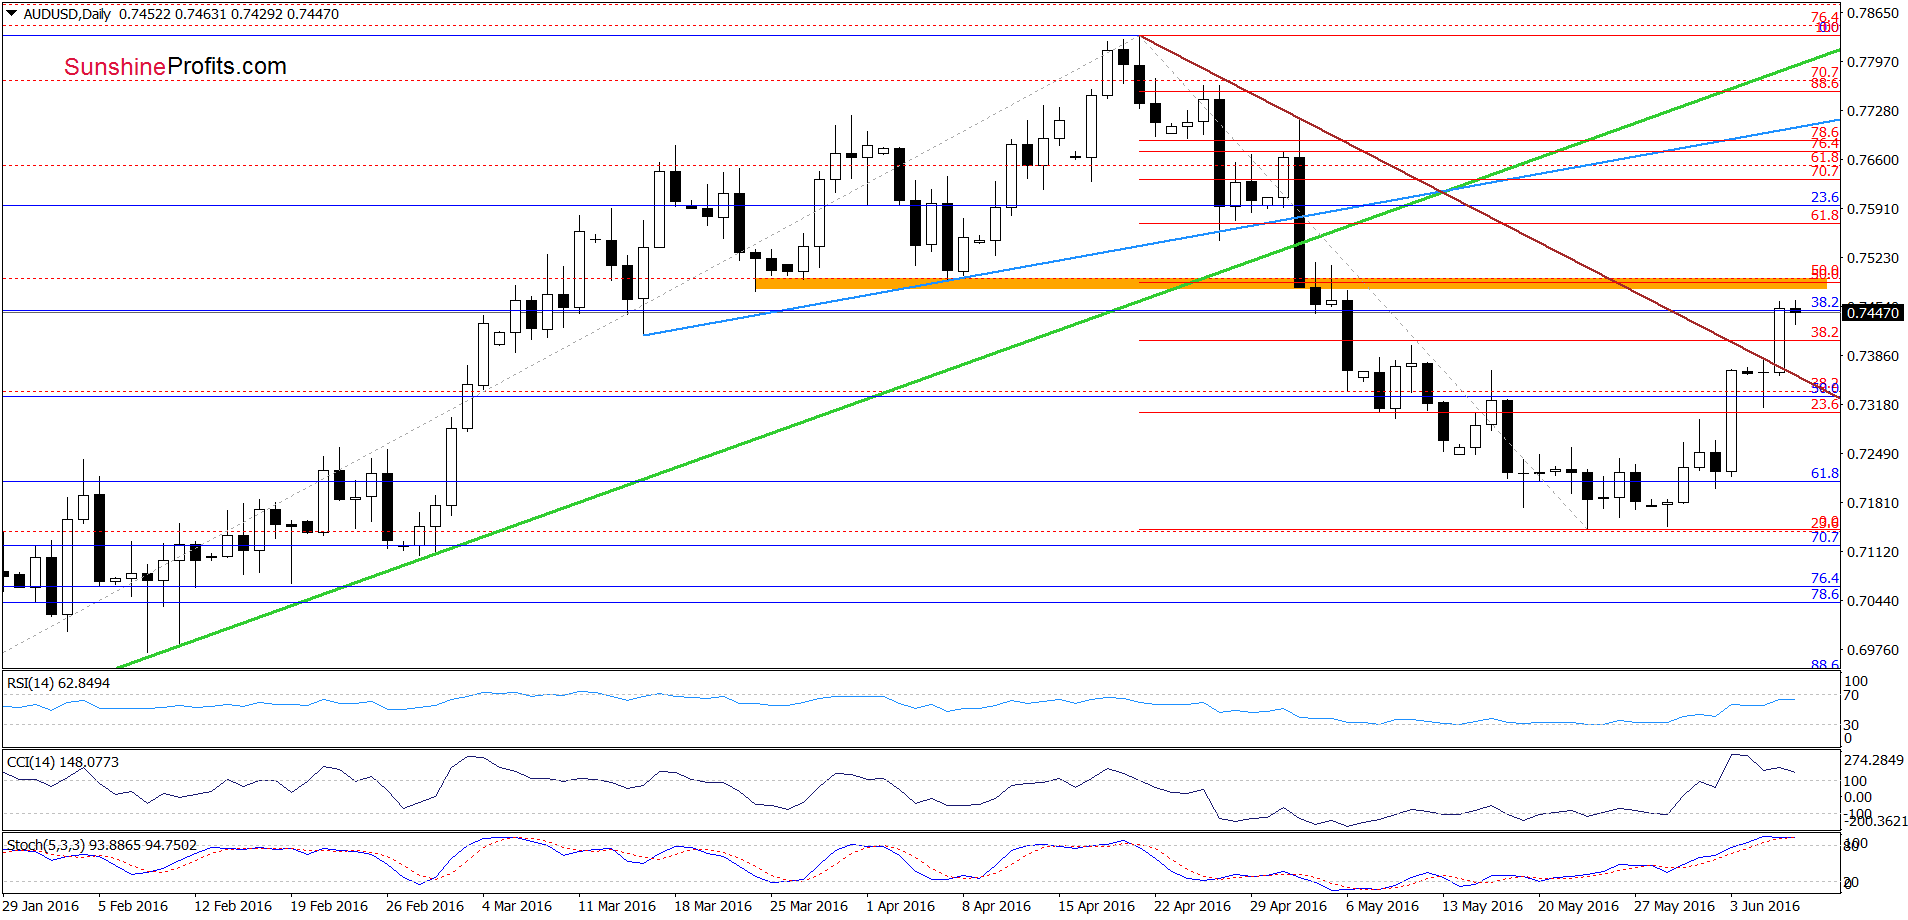
From today’s point of view, we see that currency bulls pushed the pair above the brown declining resistance line (based on the Apr and May highs) and the May 11 peak, which triggered further improvement. As a result, AUD/USD approached the orange resistance zone created by the late-Mar and early Apr lows and the 50% Fibonacci retracement (based on the Apr-May downward move), which may stop further improvement – especially when we factor in the current position of the CCI and Stochastic Oscillator (both indicators are overbought and close to generating sell signals). If this is the case and the pair declines from here, the initial downside target would be the brown declining line, which serves now as support (currently around 0.7357).
Very short-term outlook: mixed with bearish bias
Short-term outlook: mixed
MT outlook: mixed
LT outlook: mixed
Trading position (short-term; our opinion): No positions are justified from the risk/reward perspective. We will keep you informed should anything change, or should we see a confirmation/invalidation of the above.
Thank you.
Nadia Simmons
Forex & Oil Trading Strategist
Przemyslaw Radomski, CFA
Founder, Editor-in-chief
Gold & Silver Trading Alerts
Forex Trading Alerts
Oil Investment Updates
Oil Trading Alerts

