

Earlier today, official data showed that the euro zone’s industrial production dropped by 0.8%, missing analysts’ forecasts of a 0.1% gain. As a result, EUR/USD gave up some gains and approached the level of 1.1400. Will we see further deterioration in the coming days?
In our opinion the following forex trading positions are justified - summary:
- EUR/USD: short (stop-loss order at 1.1754; initial downside target at 1.1222)
- GBP/USD: short (stop-loss order at 1.4819; initial downside target at 1.4303)
- USD/JPY: none
- USD/CAD: long (stop-loss order at 1.2182; initial upside target at 1.3000)
- USD/CHF: none
- AUD/USD: none
EUR/USD
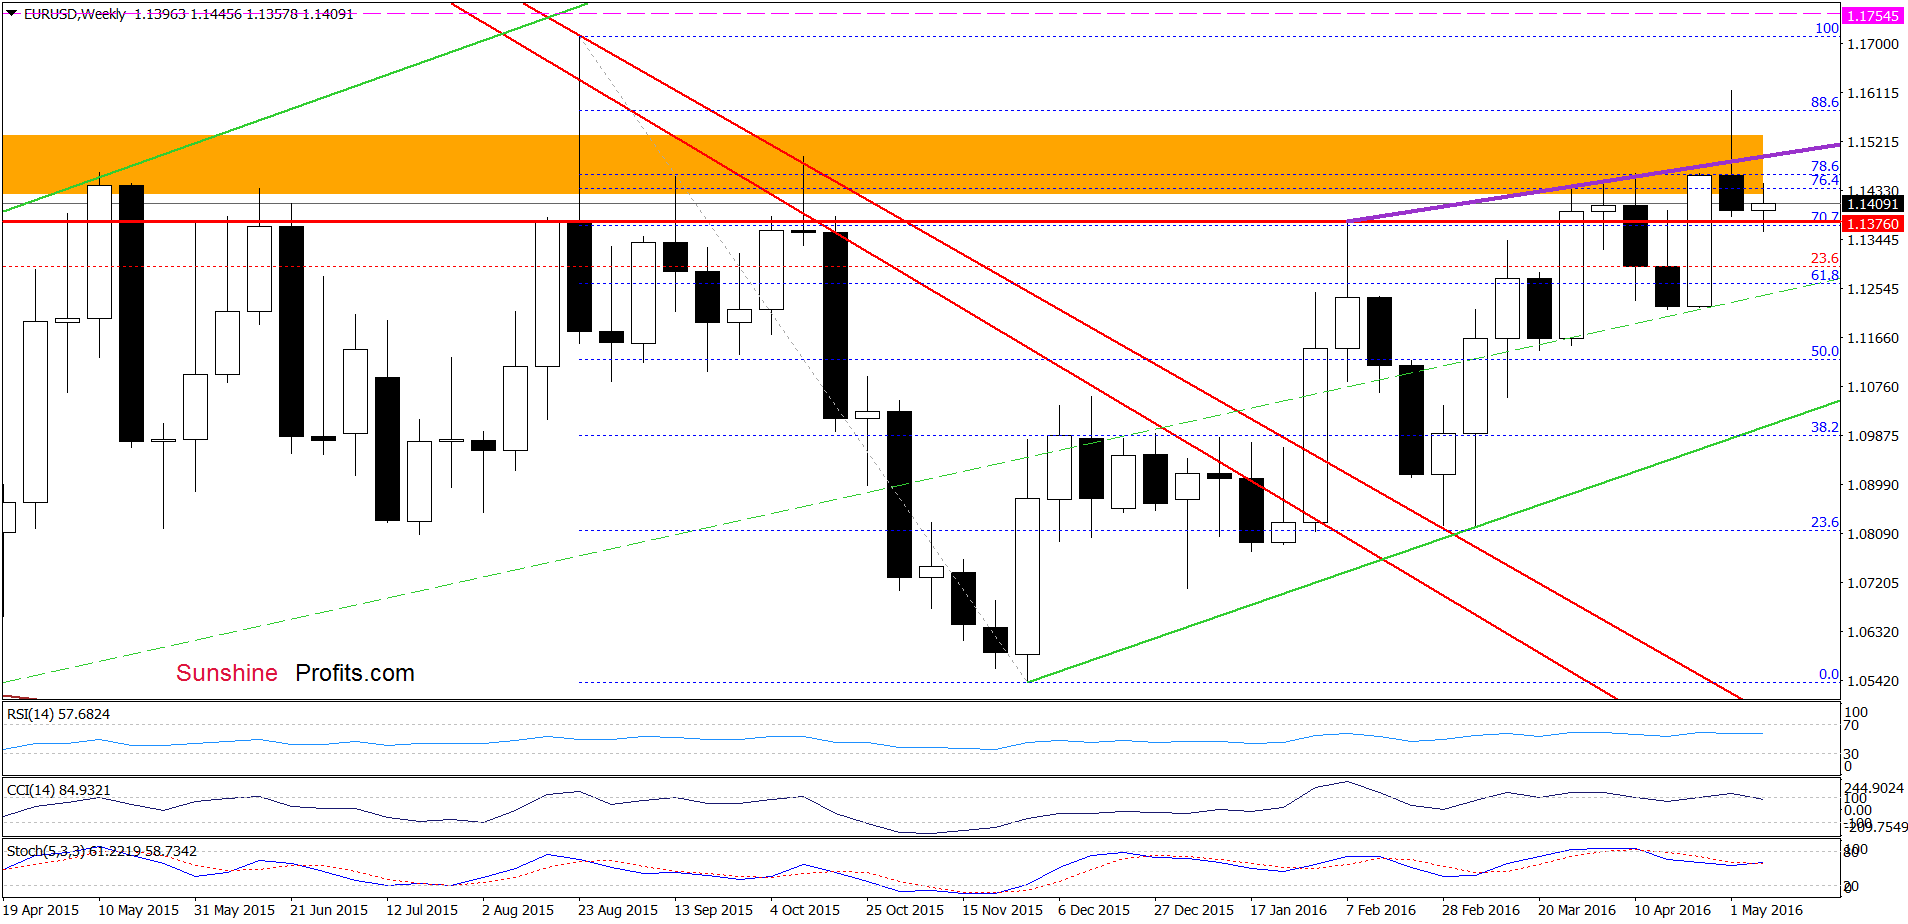
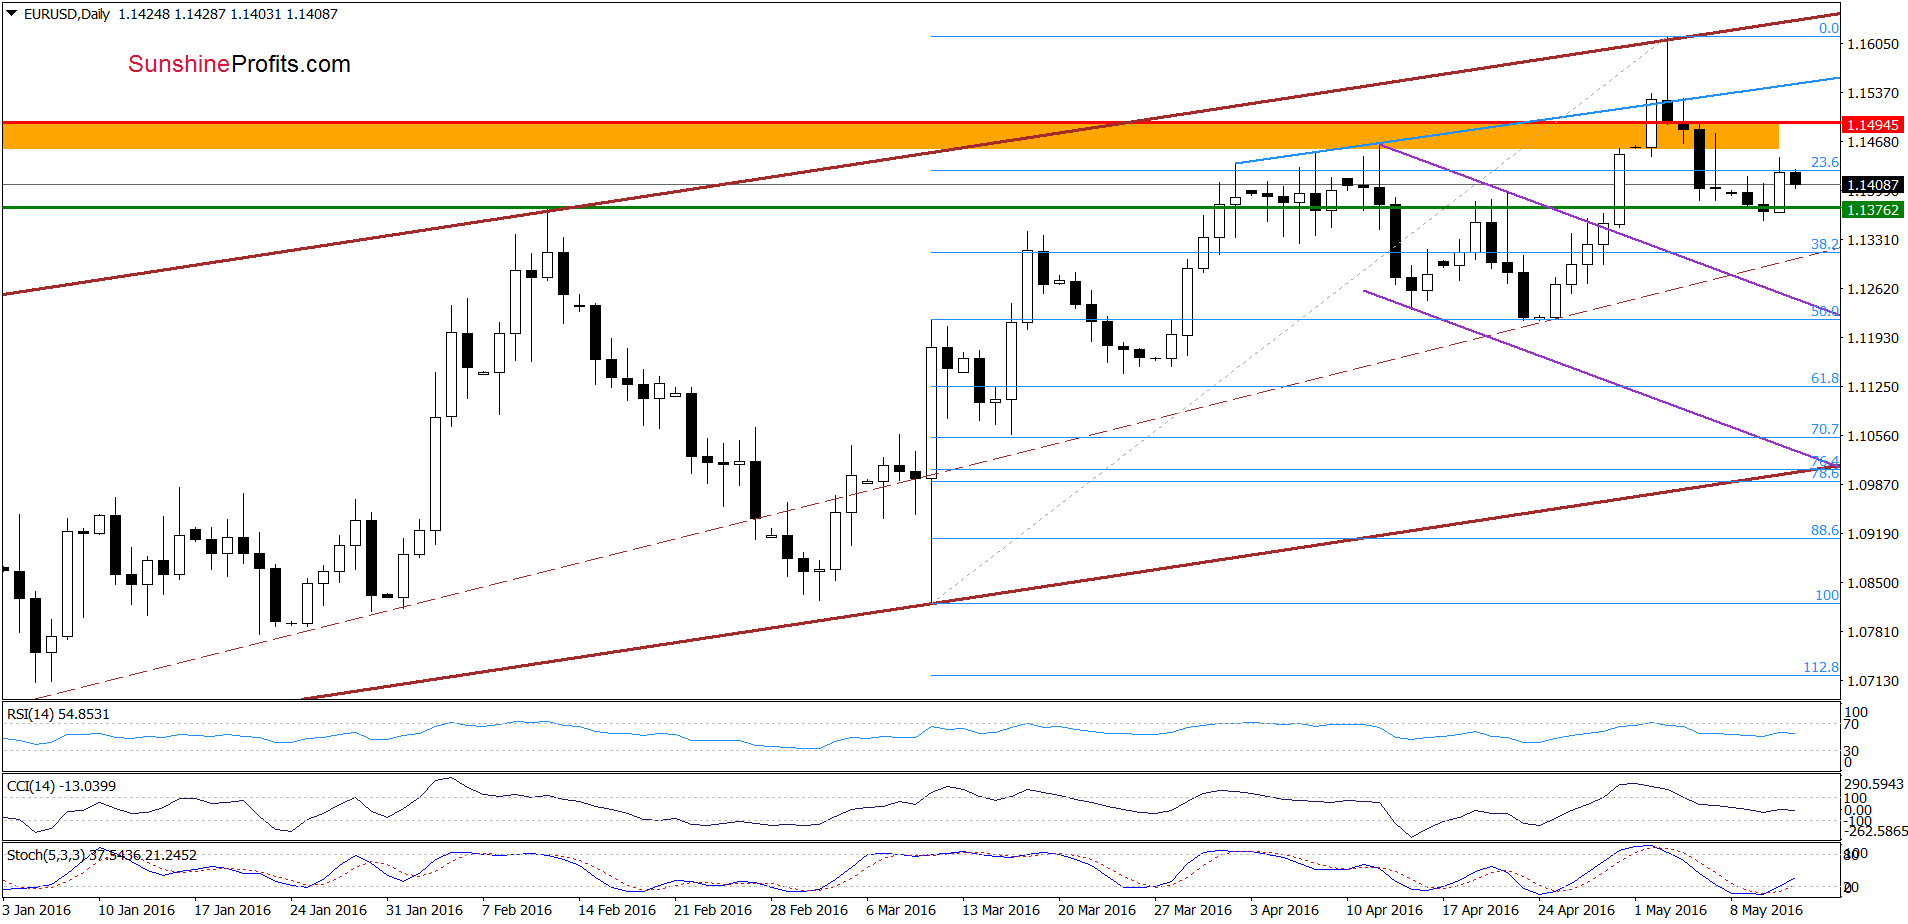
Looking at the charts, we see that although EUR/USD came back above the green horizontal support line based on the Feb high, invalidating earlier small breakdown, the key resistance area (created by the 76.4%, 78.6% Fibonacci retracements, the blue and purple resistance lines based on previous highs and the Apr highs) continues to keep gains in check. Therefore, we think that another downswing is just around the corner. If this is the case and the exchange rate extends declines, the next downside target would be the 32.8% Fibonacci retracement (based on the March-May rally) around 1.1313.
Very short-term outlook: bearish
Short-term outlook: bearish
MT outlook: mixed with bearish bias
LT outlook: mixed
Trading position (short-term; our opinion): Short positions (with a stop-loss order at 1.1754 and the initial downside target at 1.1222) are justified from the risk/reward perspective. We will keep you informed should anything change, or should we see a confirmation/invalidation of the above.
USD/JPY
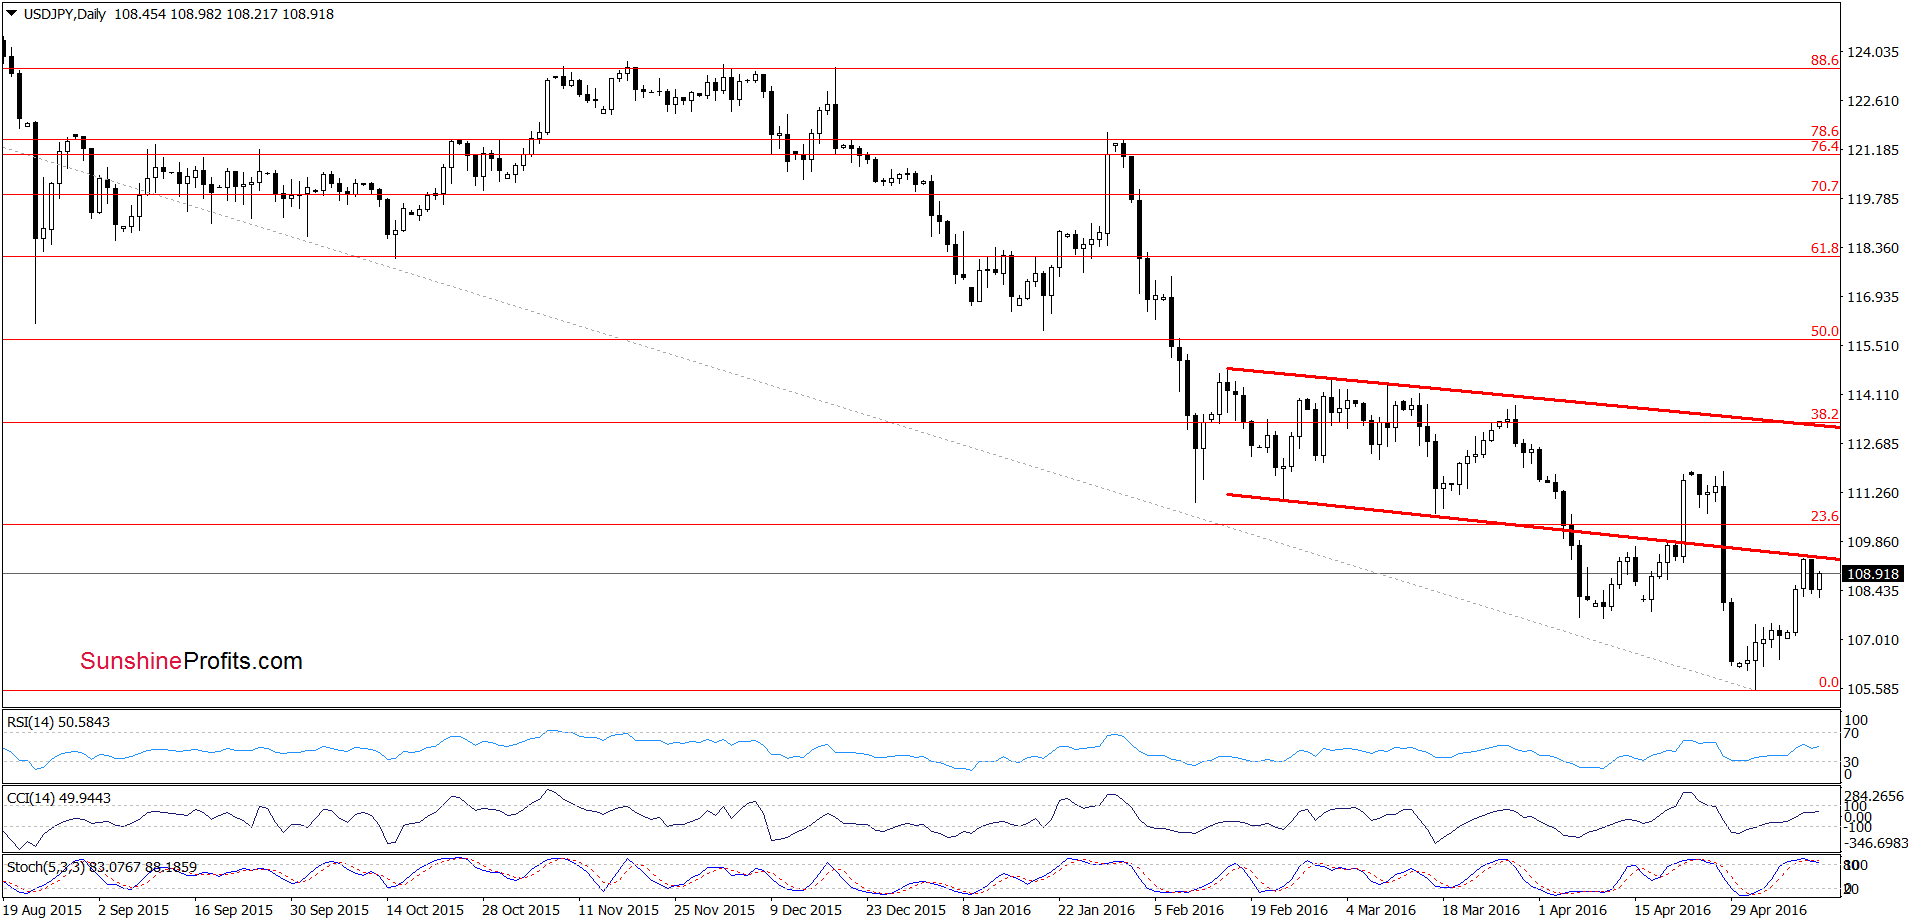
The overall situation in the long- and medium-term perspective hasn’t changed much as USD/JPY is still trading above the 38.2% Fibonacci retracement (based on the entire Jun-May downward move) and the green zone created by the Fibonacci retracements (based on the Feb 2014-Jun 2015 rally). Today, we’ll focus on the very short-term changes.
On Tuesday, we wrote the following:
(…) USD/JPY extended gains, but slightly above current levels is the lower border of the previously-broken red declining trend channel and the 23.6% Fibonacci retracement based on the entire Jun 2015-May 2016 downward move, which together could encourage currency bears to act – especially when we factor in the fact tha the Stochastic Oscillator is overbought and very close to generating a sell signal.
From today’s point of view, we see that currency bears pushed USD/JPY lower as we had expected. Although the pair rebounded earlier today, we still think that as long as there won’t be a daily closure above these resistance levels further rally is questionable. Finishing today’s commentary on this currency pair, it’s worth keep in mind that a pro-bearish scenario is also reinforced by the current position of daily indicators (the Stochastic Oscillator generated a sell signal).
Very short-term outlook: mixed
Short-term outlook: mixed with bullish bias
MT outlook: mixed
LT outlook: mixed
Trading position (short-term; our opinion): No positions are justified from the risk/reward perspective at the moment. We will keep you informed should anything change, or should we see a confirmation/invalidation of the above.
USD/CHF
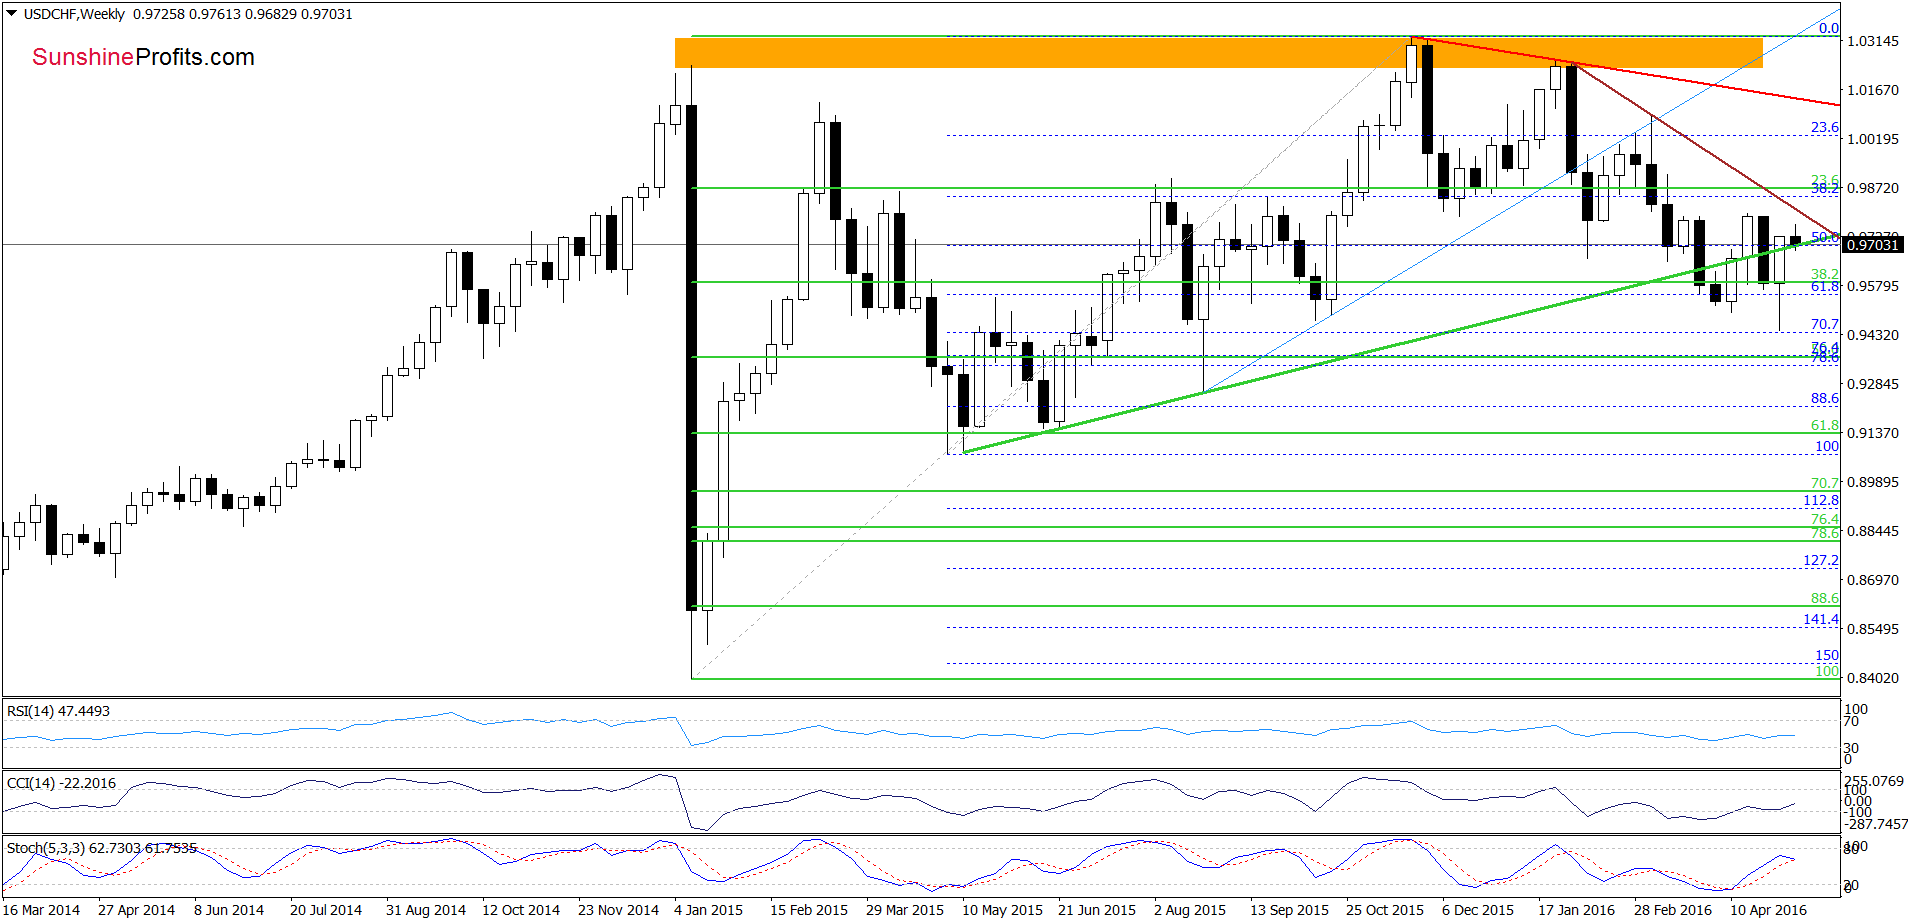
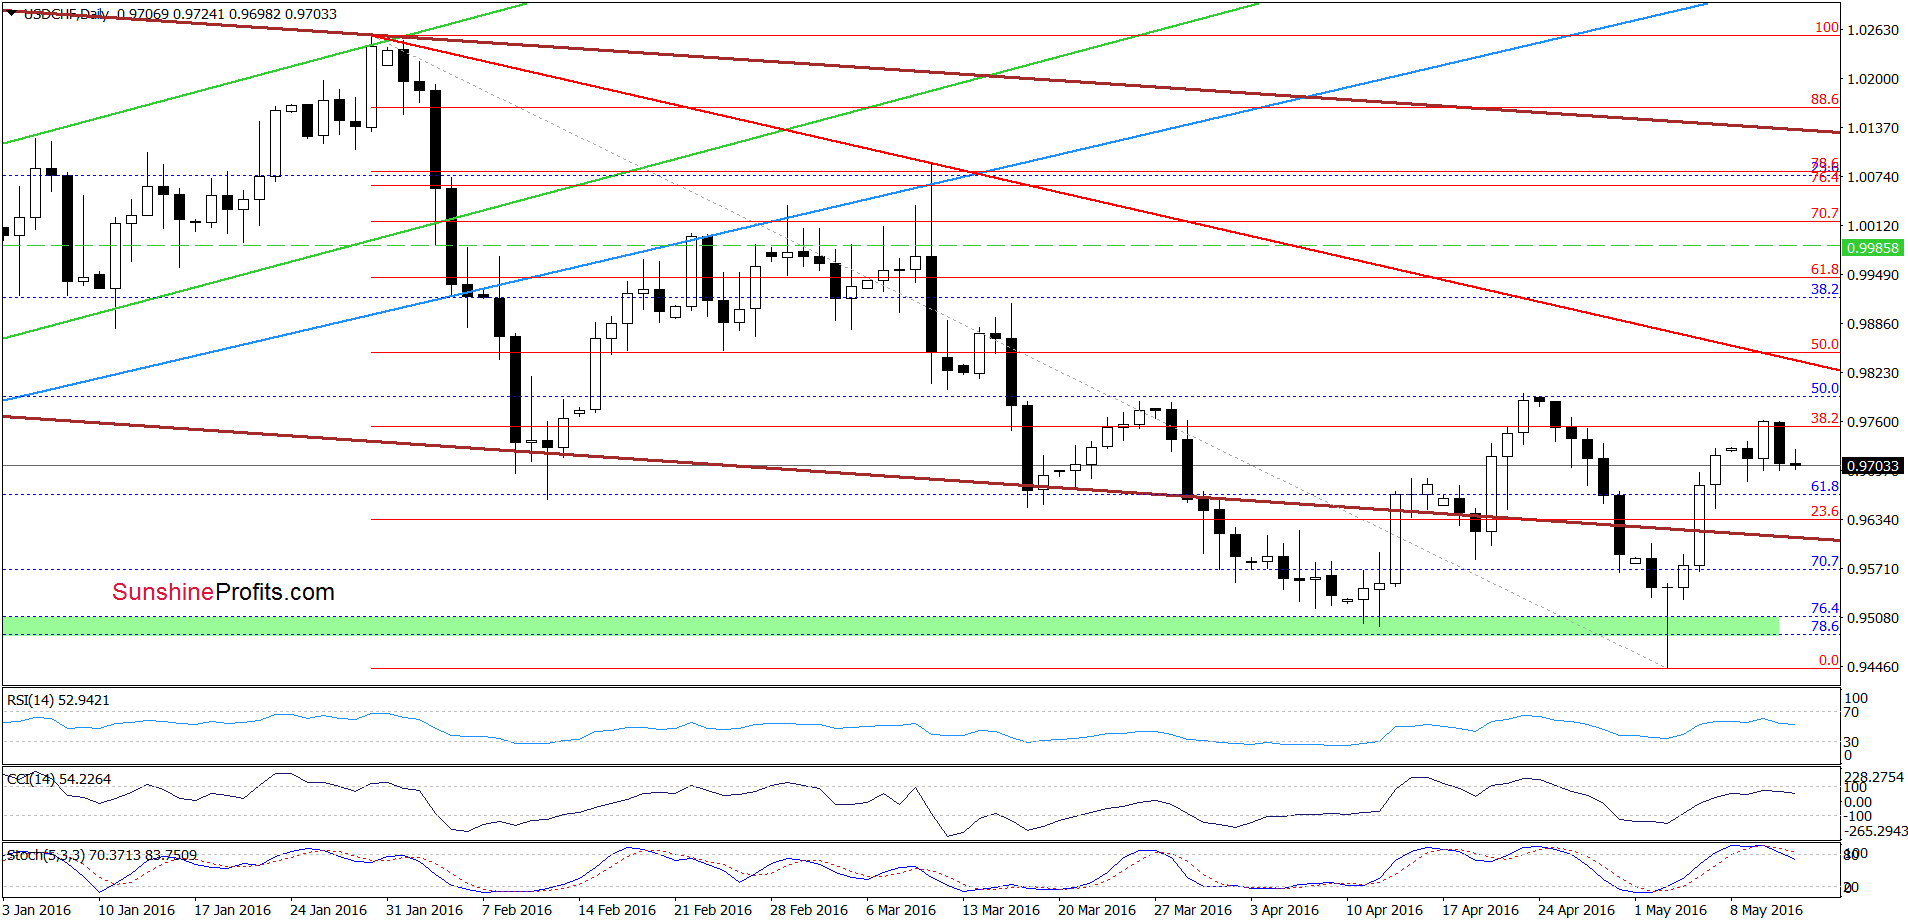
Looking at the daily chart, we see that the 38.2% Fibonacci retracement encouraged currency bears to act, which resulted in a drop under this resistance level and invalidation of earlier small breakout. Taking this negative signal into account and combining it with sell signals generated by the indicators, we think that further deterioration is just around the corner. Nevertheless, such price action would be more likely if USD/CHF declines under the medium-term green support line marked on the weekly chart (especially if the weekly Stochastic Oscillator generates a sell signal). In this case, we’ll likely see a test of the strength of the previously-broken brown support line (currently around 0.9607) in the following days.
Very short-term outlook: mixed with bearish bias
Short-term outlook: mixed
MT outlook: mixed
LT outlook: mixed
Trading position (short-term; our opinion): No positions are justified from the risk/reward perspective. We will keep you informed should anything change, or should we see a confirmation/invalidation of the above.
As a reminder – “initial target price” means exactly that – an “initial” one, it’s not a price level at which we suggest closing positions. If this becomes the case, we will refer to these levels as levels of exit orders. Stop-loss levels, however, are naturally not “initial”, but something that, in our opinion, might be entered as an order.
Thank you.
Nadia Simmons
Forex & Oil Trading Strategist
Przemyslaw Radomski, CFA
Founder, Editor-in-chief
Gold & Silver Trading Alerts
Forex Trading Alerts
Oil Investment Updates
Oil Trading Alerts

