

Earlier today, the U.S. dollar moved higher against the yen after Japan’s Finance Minister warned that his country could intervene in the currency market if necessary. Thanks to this news, USD/JPY extended gains and moved away from important supports. What happened at the same time with our other currency pairs?
In our opinion the following forex trading positions are justified - summary:
- EUR/USD: short (stop-loss order at 1.1754; initial downside target at 1.1222)
- GBP/USD: short (stop-loss order at 1.4819; initial downside target at 1.4303)
- USD/JPY: none
- USD/CAD: long (stop-loss order at 1.2182; next upside target at 1.3155)
- USD/CHF: none
- AUD/USD: none
EUR/USD
On Friday, we wrote:
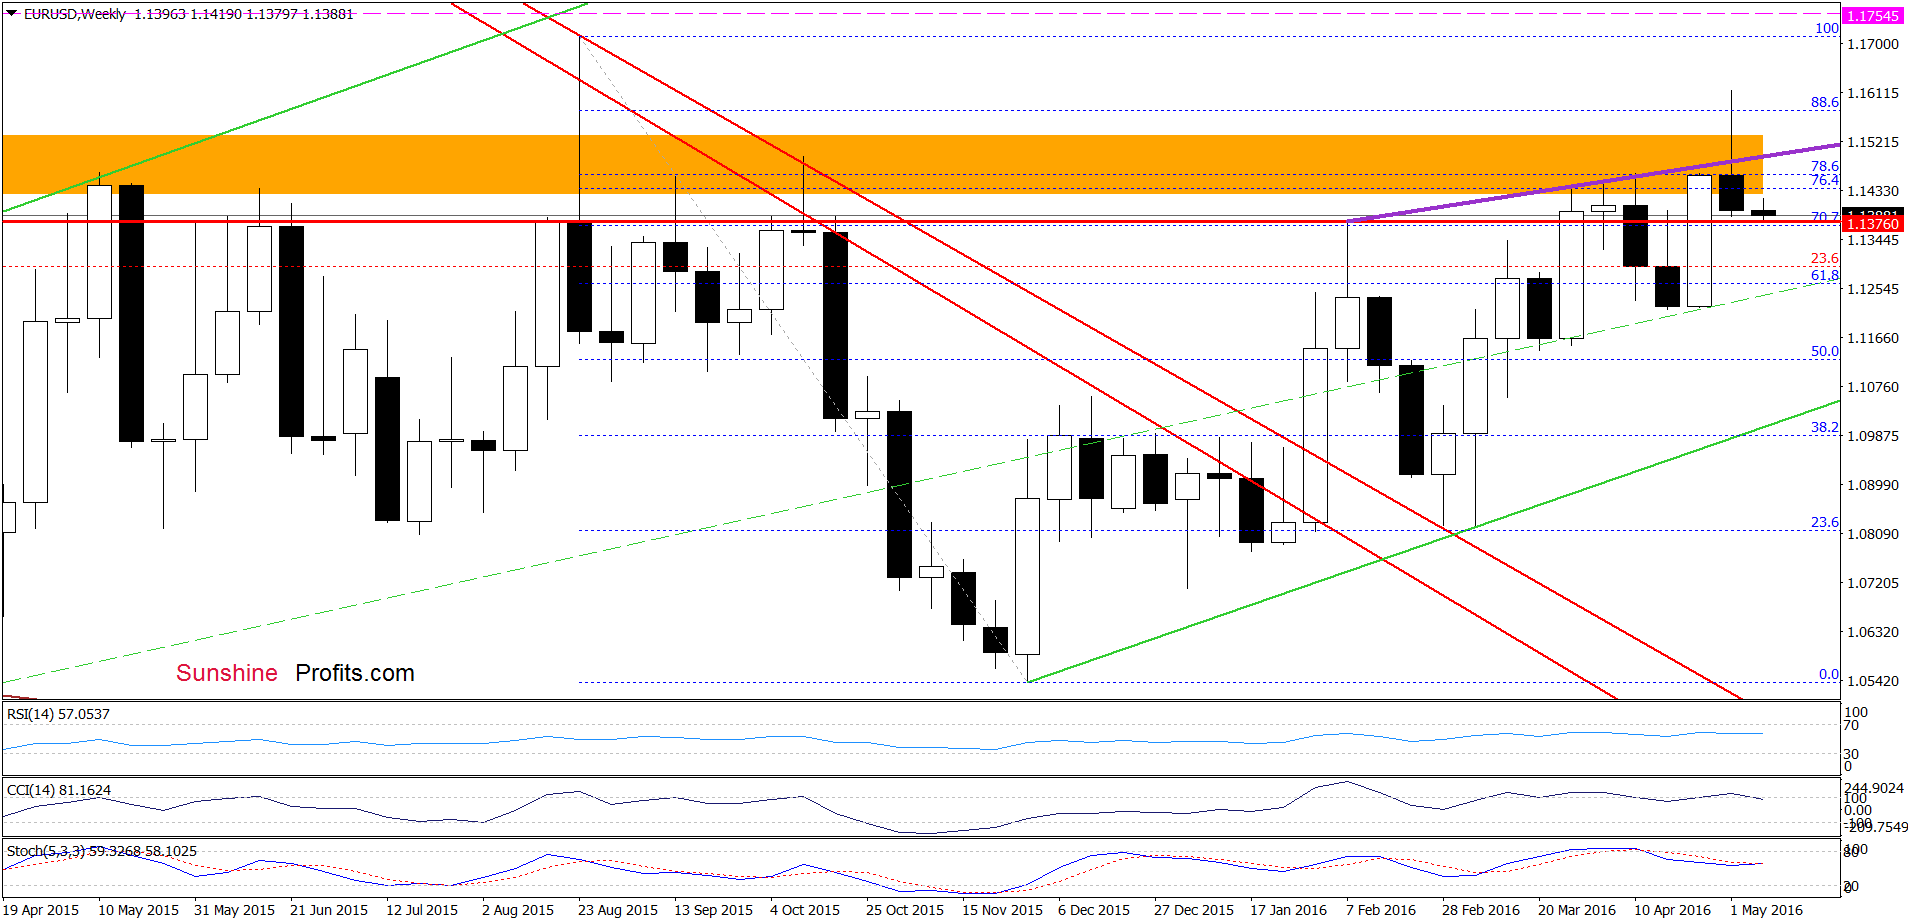
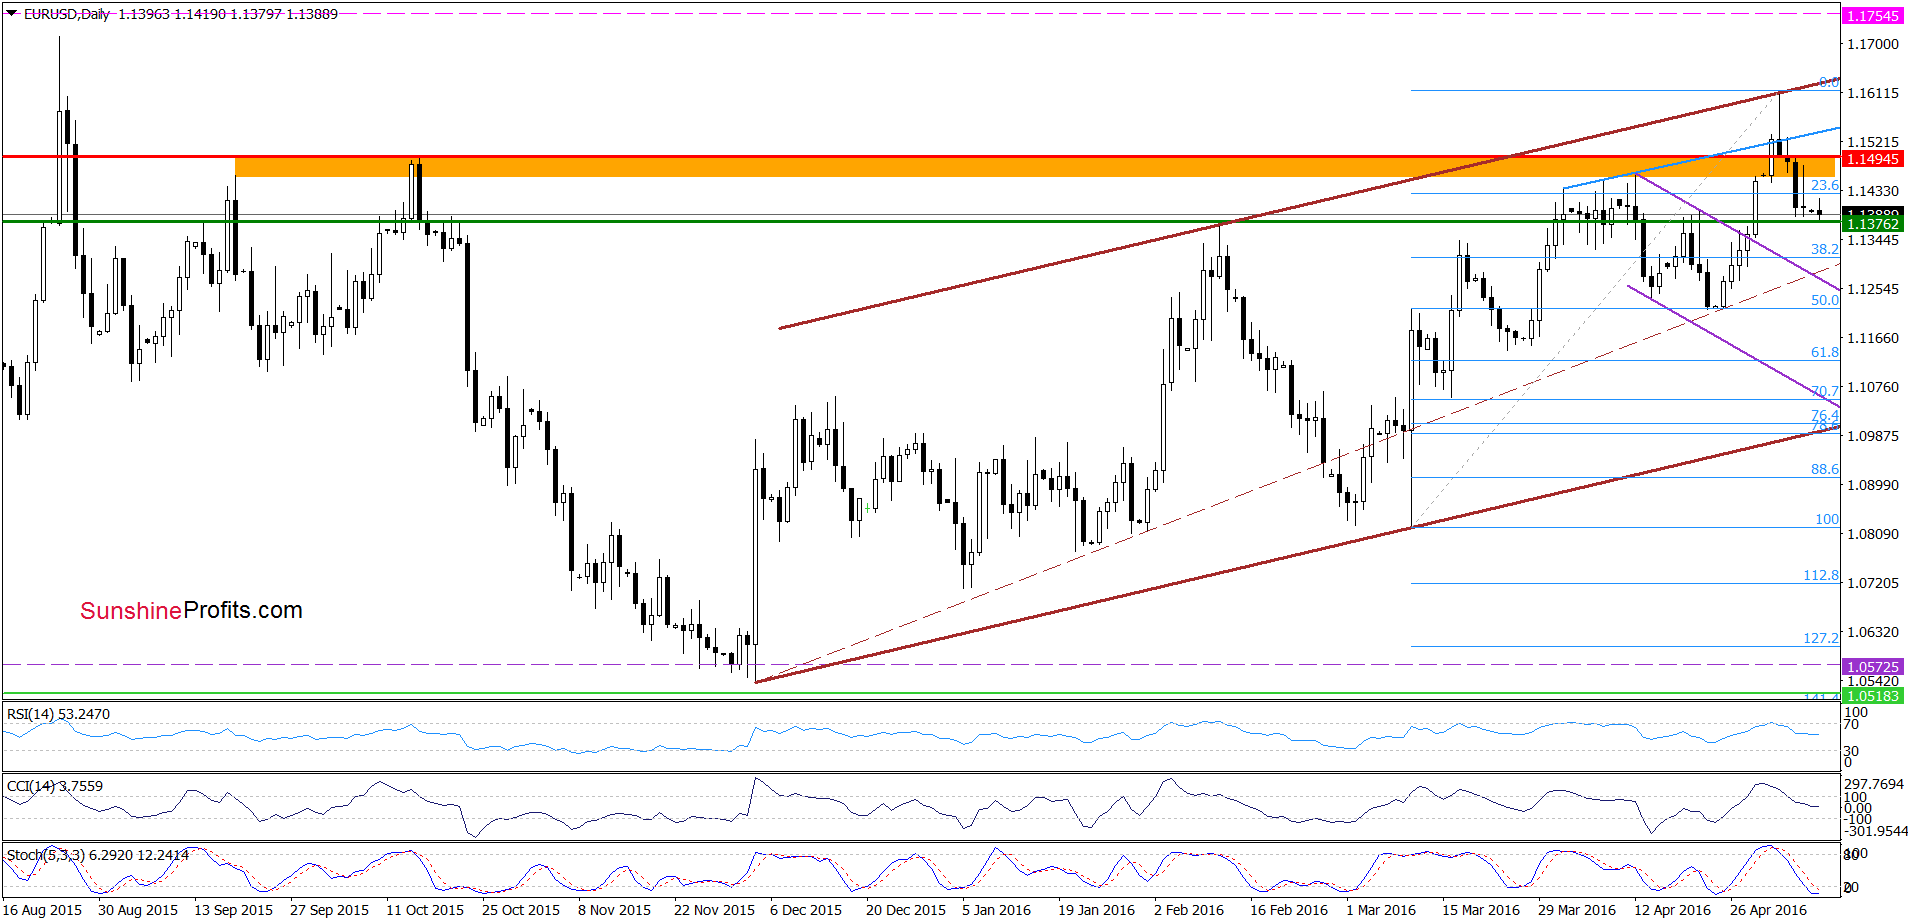
(…) the exchange rate still remains under the orange resistance zone and the previous highs, which in combination with sell signals generated by the indicators suggests another attempt to move lower in the coming days – especially if the pair closes the week under the purple line marked on the weekly chart and all resistance levels seen on the daily chart.
From today’s point of view, we see that the situation developed in line with the Friday’s scenario and EUR/USD closed last week under all the above-mentioned levels, which suggests that our next downside target from the previous alert would be in play in the coming day(s):
If we see (…) a drop under the Feb high, the next downside target would be around 1.1289, where the upper border of the purple declining trend channel is.
Finishing today’s commentary on this currency pair, please keep in mind that EUR/USD is still trading under the previously-broken purple support/resistance line based on recent highs, which means that invalidation of earlier breakout and its negative impact on the exchange rate is still in effect, suggesting further deterioration in the coming week.
Very short-term outlook: bearish
Short-term outlook: bearish
MT outlook: mixed with bearish bias
LT outlook: mixed
Trading position (short-term; our opinion): Short positions (with a stop-loss order at 1.1754 and the initial downside target at 1.1222) are justified from the risk/reward perspective. We will keep you informed should anything change, or should we see a confirmation/invalidation of the above.
GBP/USD
Quoting our Thursday’s alert:
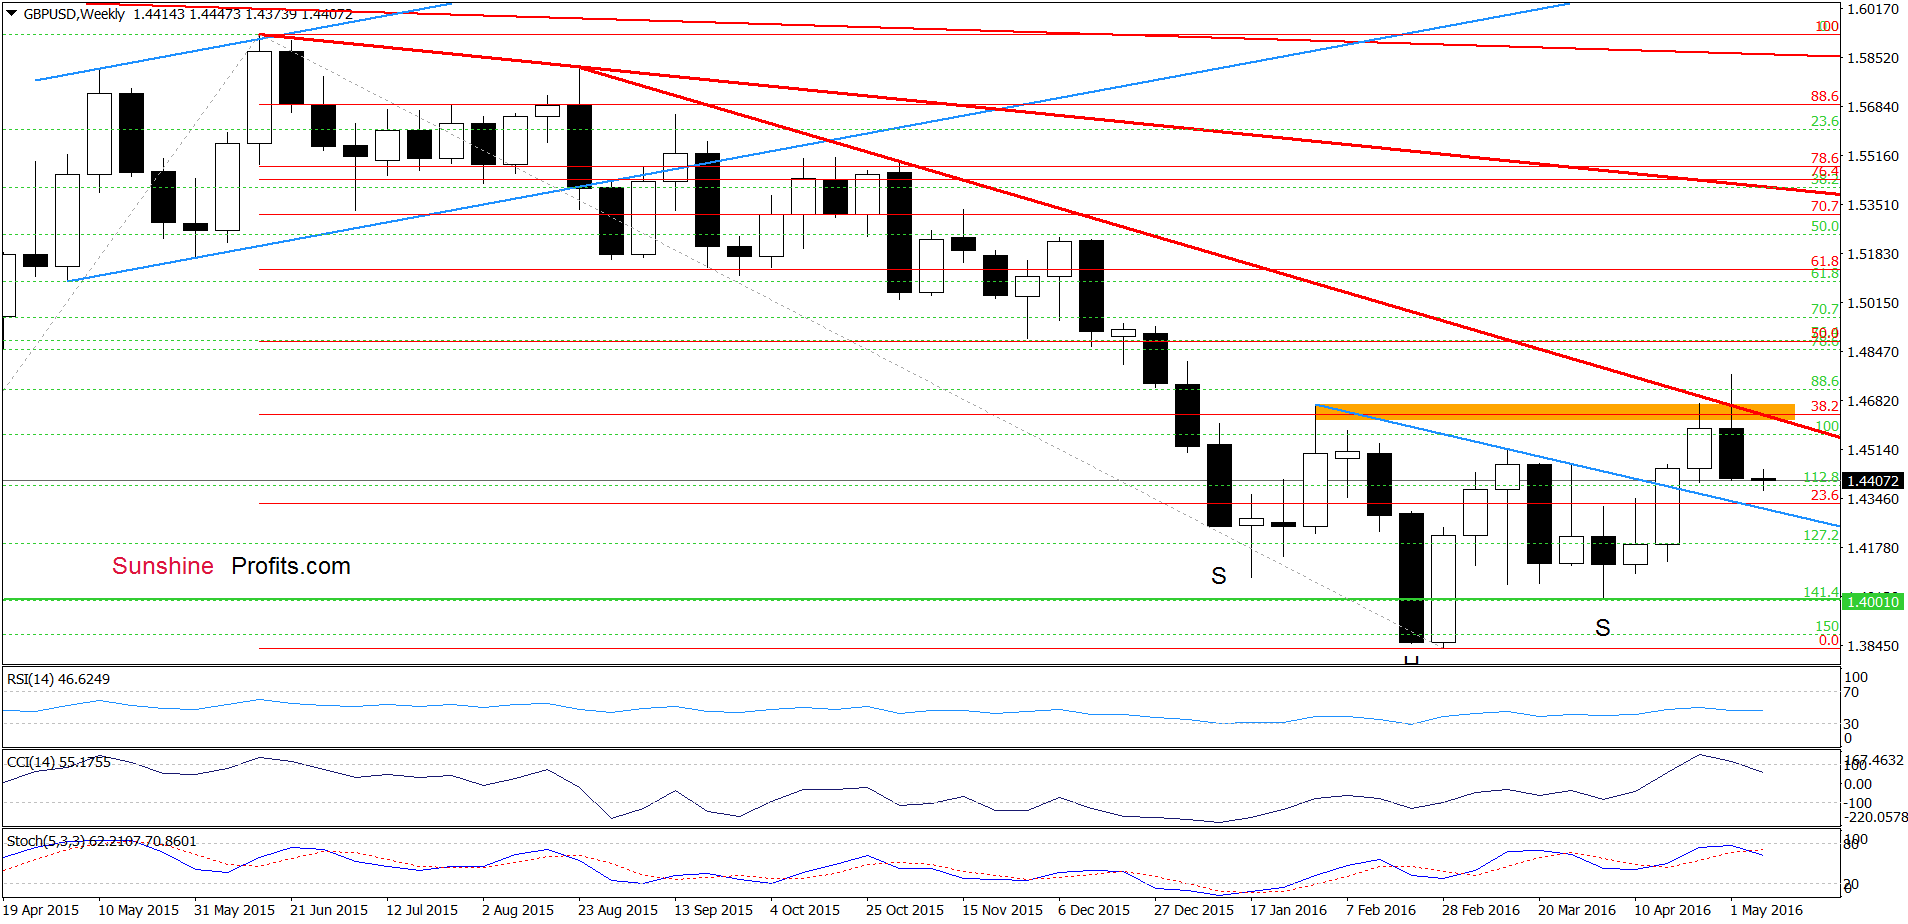
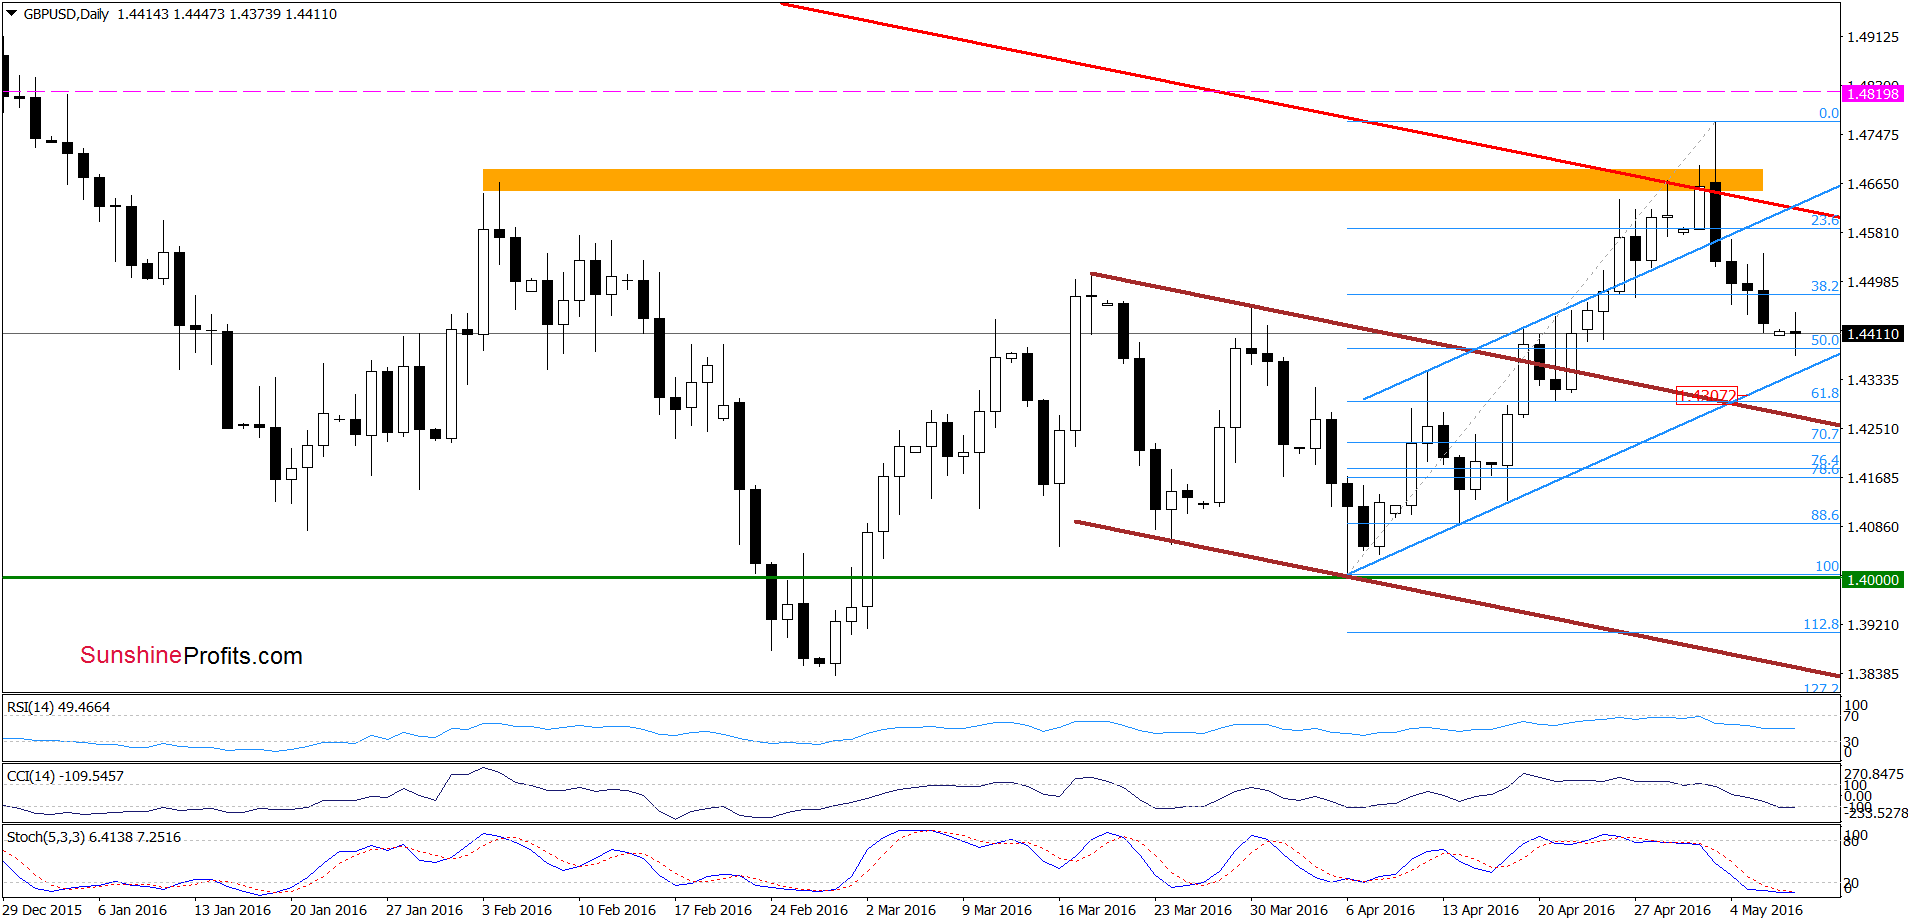
(…) the pair slipped to the 38.2% Fibonacci retracement, which could trigger a small rebound from here. Nevertheless, invalidation of earlier breakouts and its negative impact on the exchange rate is still in effect. Additionally, sell signals generated by the indicators remain in play, supporting further deterioration.
As you see on the charts, currency bears pushed GBP/USD lower as we had expected. With this downward move, the pair slipped slightly below the 50% Fibonacci retracement and approached the lower border of the blue rising trend channel, which could encourage currency bulls to act in the coming day(s). Nevertheless, even if we see such price action, please keep in mind that sell signals generated by the weekly indicators are still in play, suggesting that the exchange rate will likely test the previously-broken neck line of reverse head and shoulders formation (currently around 1.4310) and the 61.8% Fibonacci retracement in the coming week.
Very short-term outlook: bearish
Short-term outlook: bearish
MT outlook: mixed with bearish bias
LT outlook: mixed
Trading position (short-term; our opinion): Short positions (with a stop-loss order at 1.48.19 and the initial downside target at 1.4303) are justified from the risk/reward perspective at the moment. We will keep you informed should anything change, or should we see a confirmation/invalidation of the above.
USD/JPY
On Friday, we wrote the following:
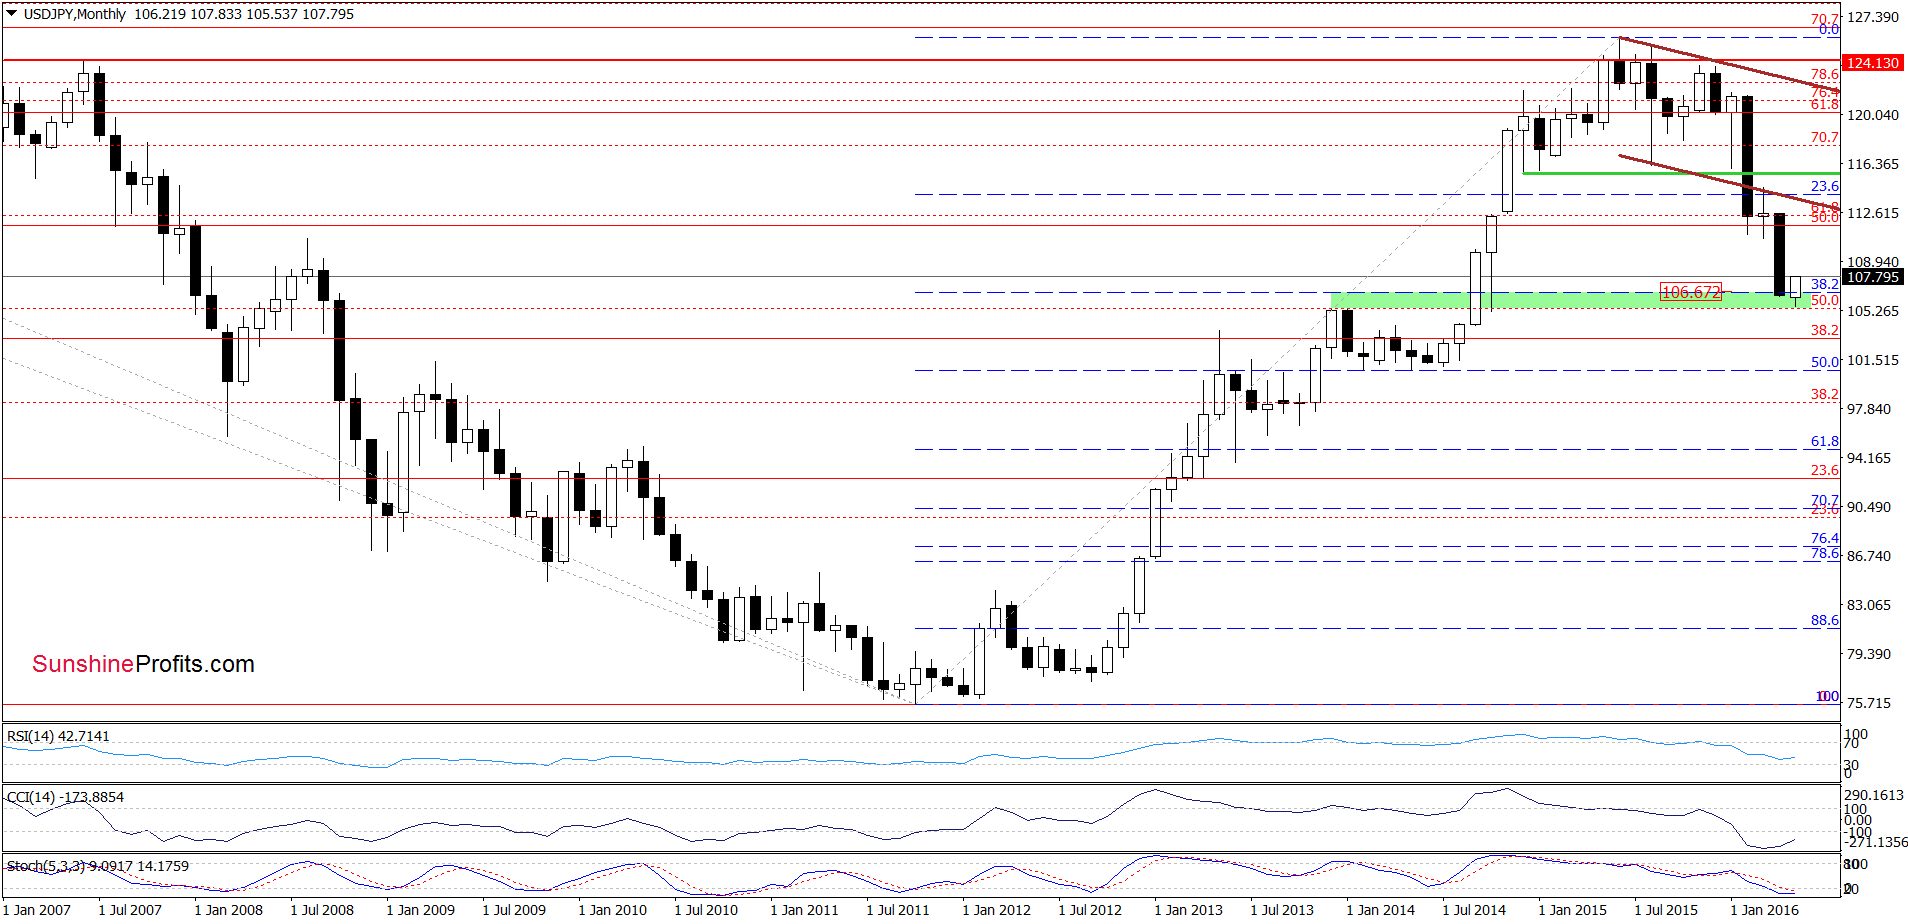
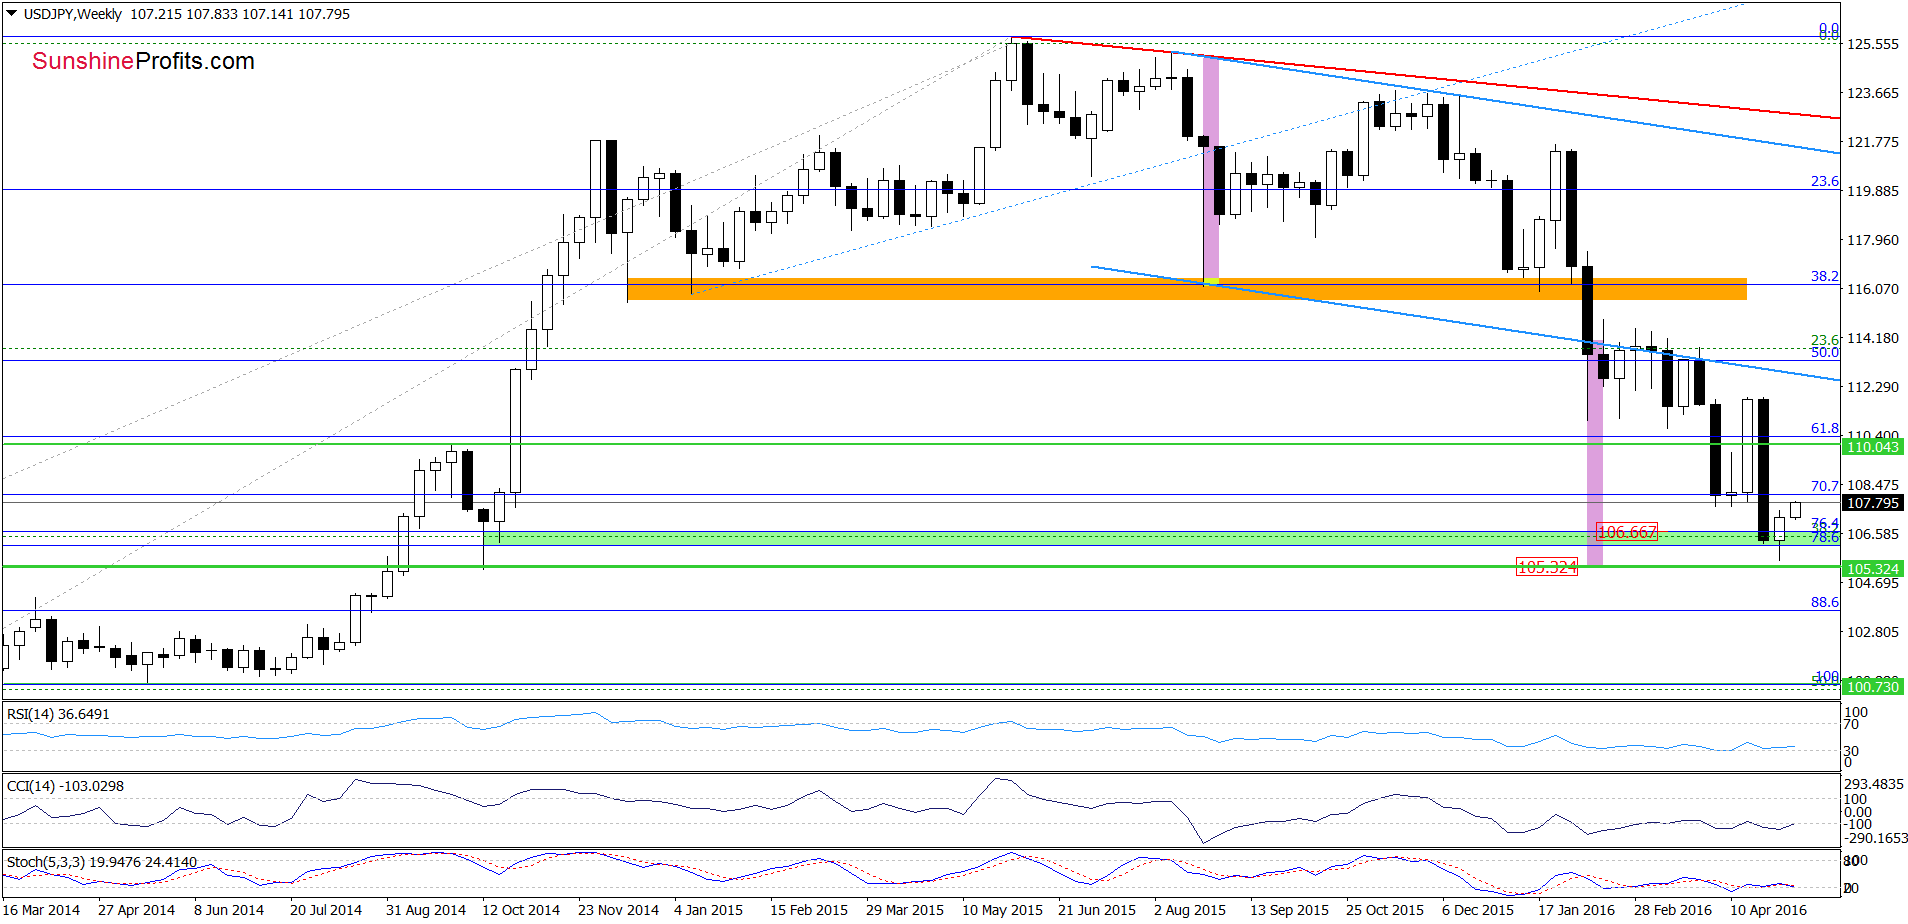
(…) USD/JPY extended gains slightly and climbed above the previously broken 38.2% Fibonacci retracement (marked on the monthly chart) and the green zone seen on the weekly chart. Although this is a positive signal that suggests further improvement (potential invalidation of earlier breakdown), we still think that as long as there won’t be weekly closure above the green zone further improvement is questionable.
The first things that catch the eye on the above charts are invalidations of earlier breakdowns under the 38.2% Fibonacci retracement (marked on the monthly chart) and the green zone seen on the weekly chart. As you see, USD/JPY closed last week above them, which triggered further improvement earlier this week. Additionally, the current position of weekly and monthly indicators suggests that higher values of the exchange rate are just around the corner.
Very short-term outlook: bullish
Short-term outlook: mixed with bullish bias
MT outlook: mixed
LT outlook: mixed
Trading position (short-term; our opinion): No positions are justified from the risk/reward perspective at the moment. We will keep you informed should anything change, or should we see a confirmation/invalidation of the above.
USD/CAD
On Friday, we wrote:
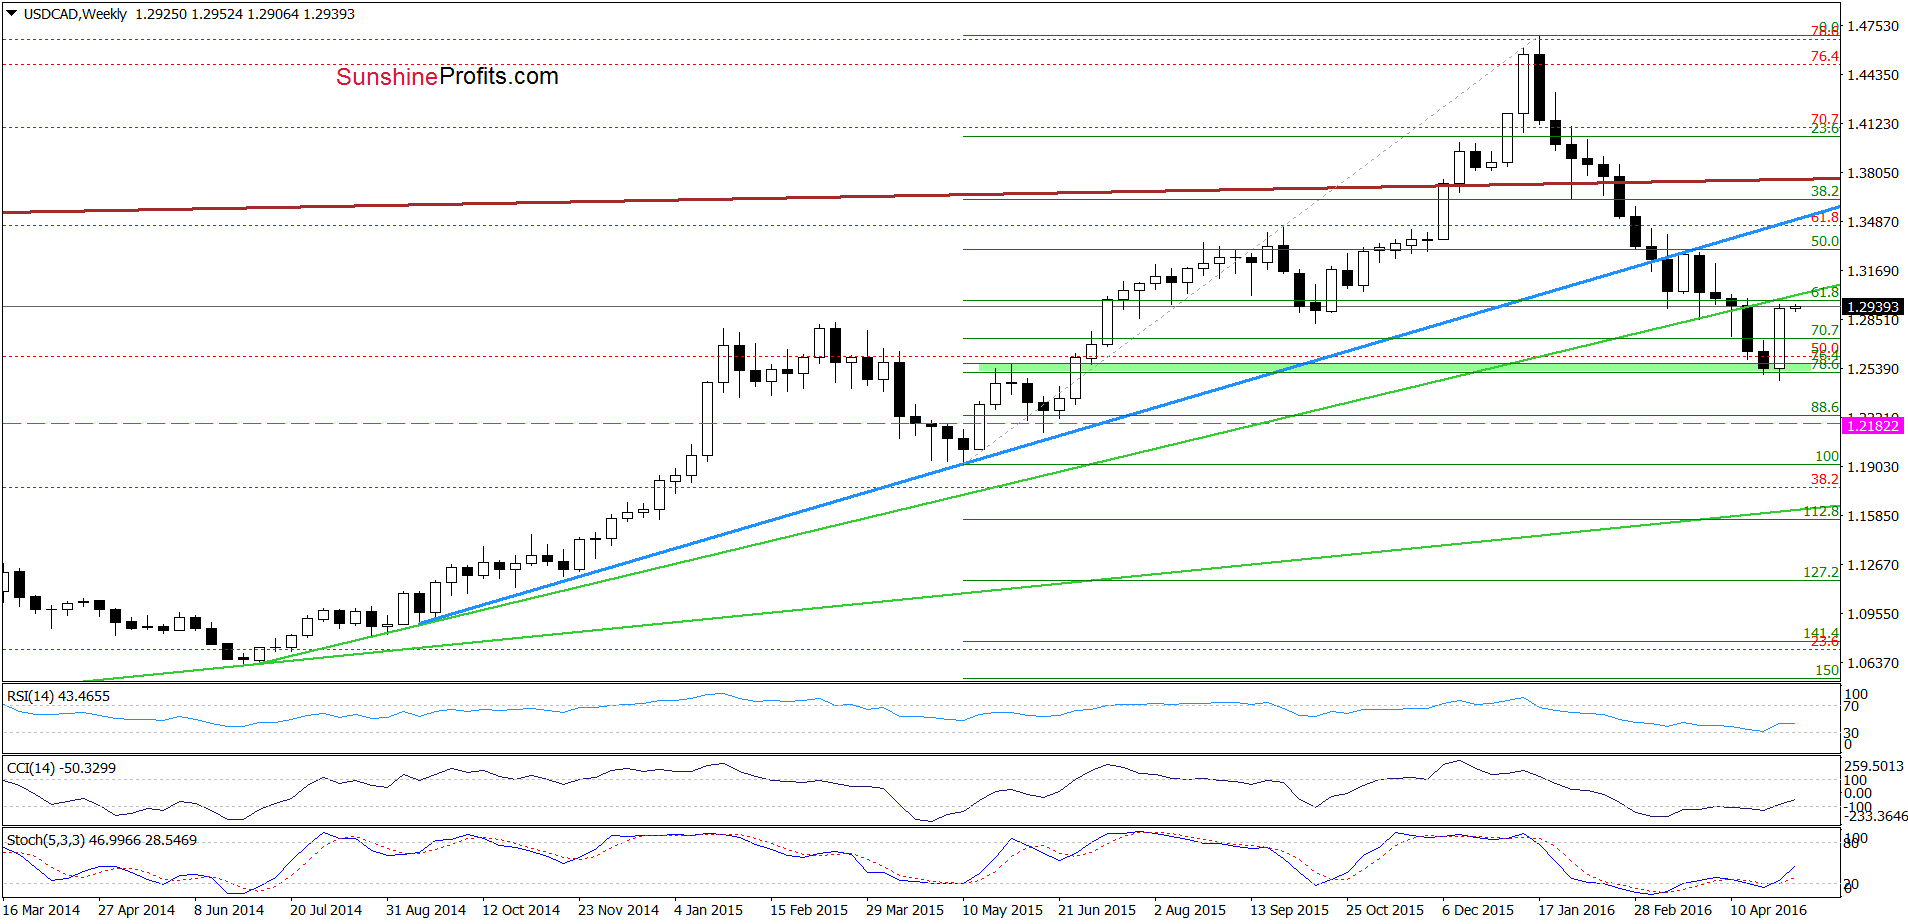
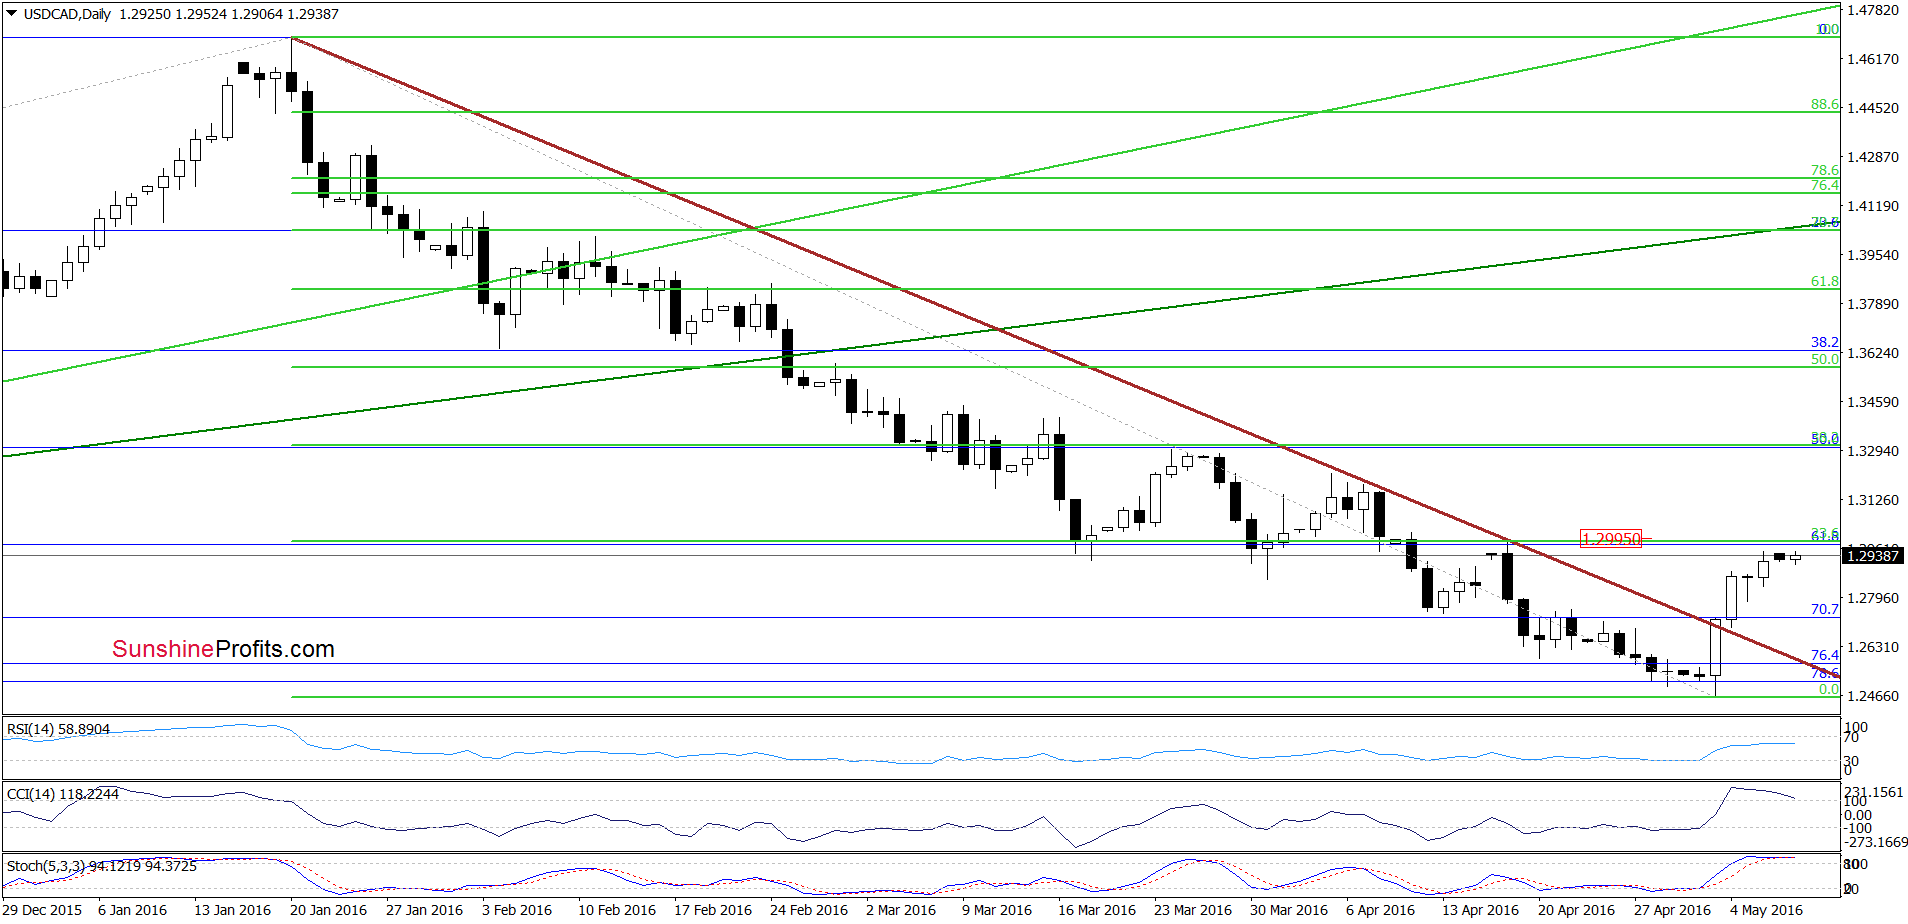
(…) the pair confirmed earlier breakout above the brown medium-term declining resistance line by three consecutive closures above it, which is a bullish signal. Although CCI and Stochastic Oscillator are overbought at the moment, we think that as long as there are no sell signals another attempt to move higher is likely. If this is the case and the exchange rate increases from here, the initial upside target would be around 1.3000, where the first Fibonacci retracement and the Apr 18 high are.
From today’s point of view, we see that USD/CAD extended gains after our alert was posted. With this upswing, the pair approached our initial upside target, which in combination with the current position of the indicators could trigger a pullback in the coming day(s). Nevertheless, the current picture of crude oil suggests that the commodity will extend losses in the coming days, which will likely push the Canadian dollar lower against its U.S. counterpart. Therefore, holding long positions is justified from the risk/reward perspective.
Very short-term outlook: bullish
Short-term outlook: mixed with bullish bias
MT outlook: mixed
LT outlook: mixed
Trading position (short-term; our opinion): Long positions (with a stop-loss order at 1.2182 and the next upside target at 1.3155) are justified from the risk/reward perspective. We will keep you informed should anything change, or should we see a confirmation/invalidation of the above.
USD/CHF
Quoting our Thursday’s alert:
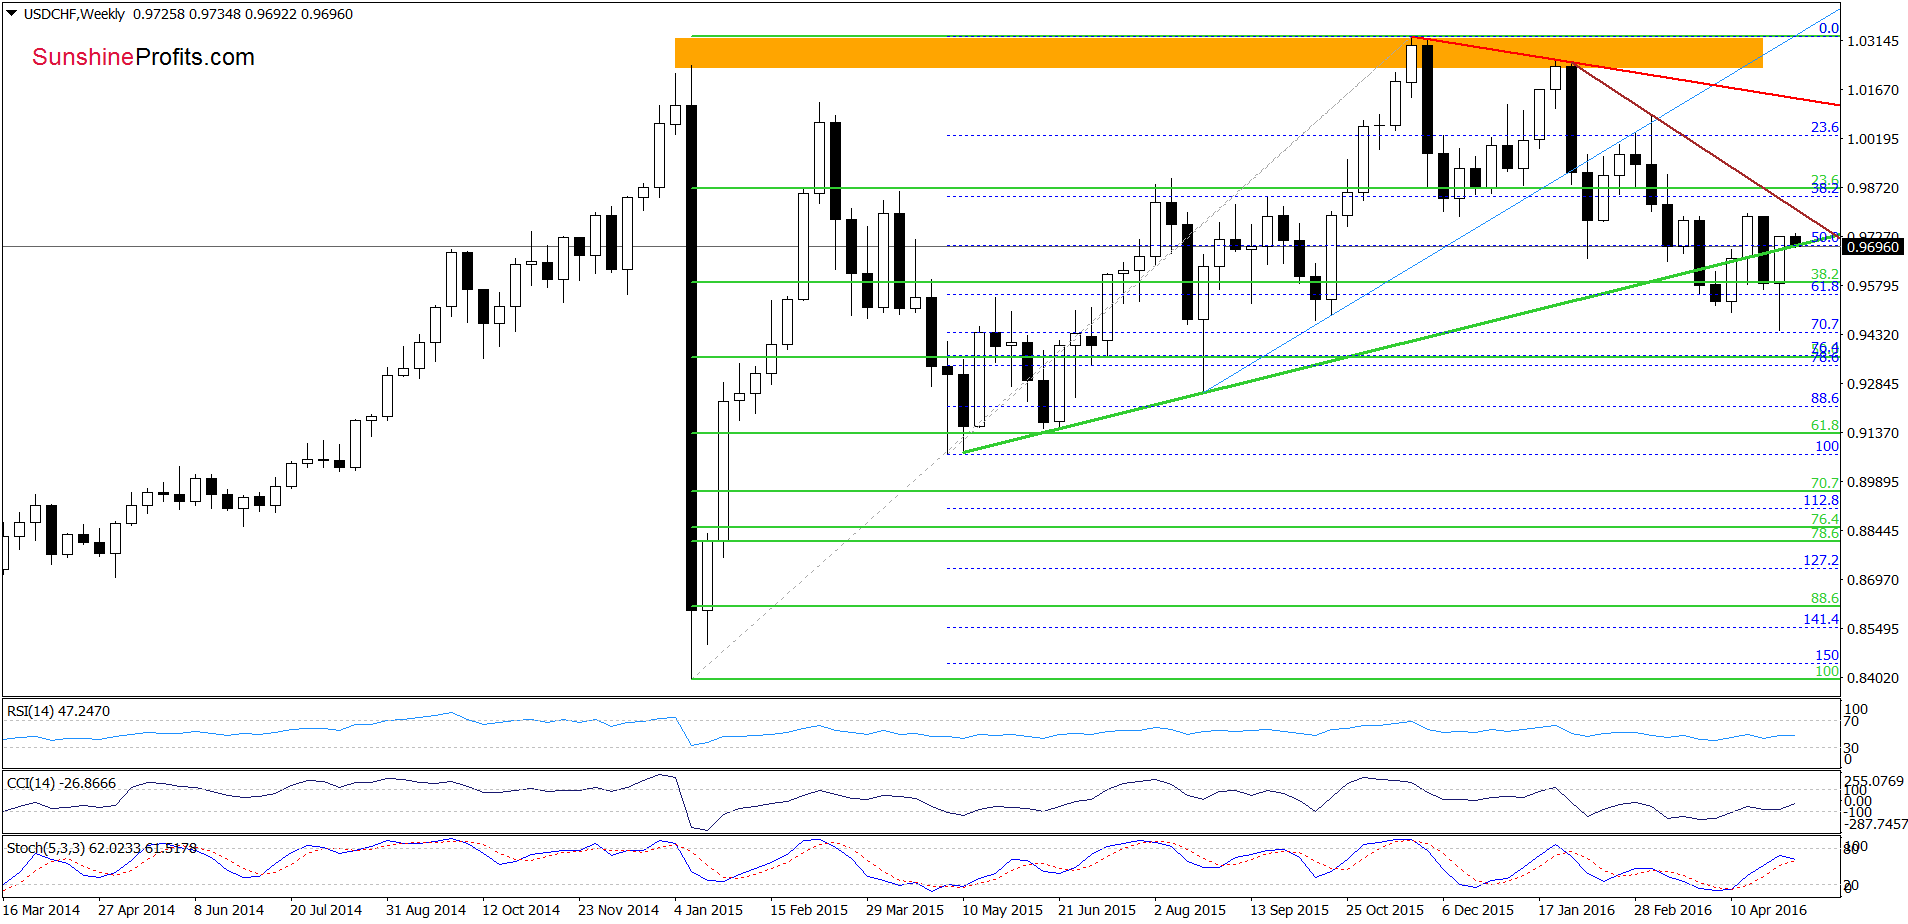
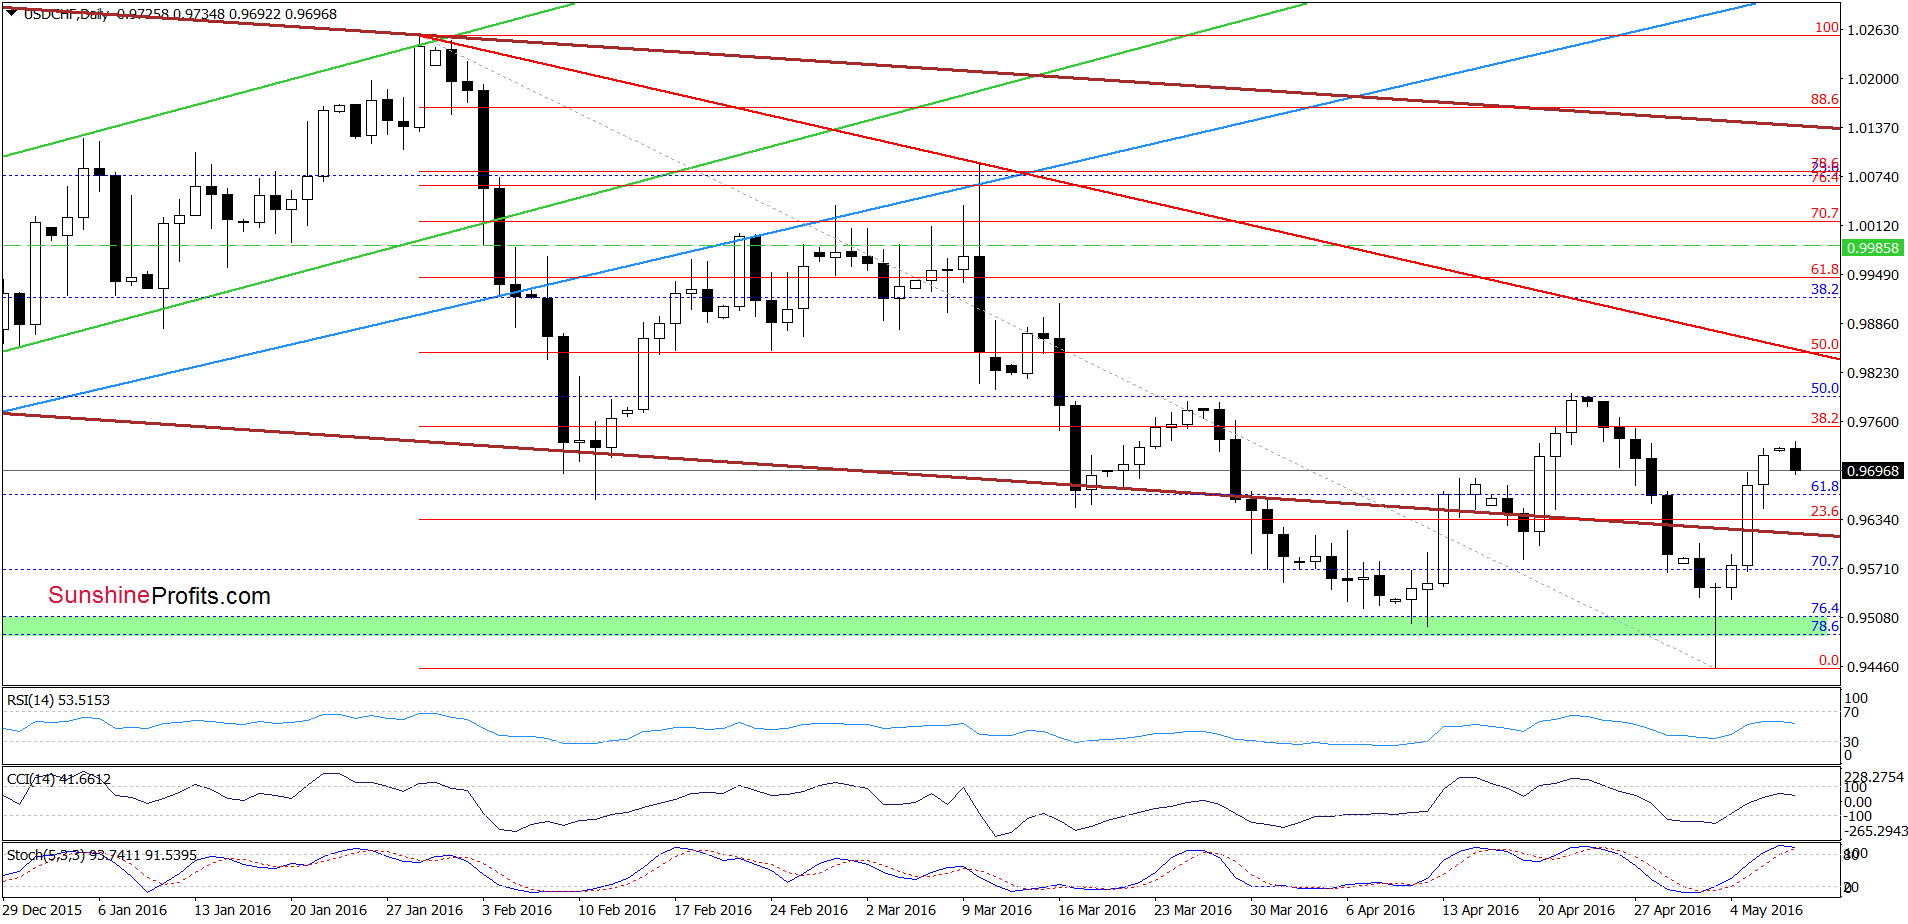
(…) the exchange rate increased to the lower border of the brown declining trend channel (marked on the daily chart). Although this resistance could encourage currency bears to act (especially when we factor in the proximity to the 23.6% Fibonacci retracement), buy signals are still in play, suggesting further improvement in the coming days.
On the above charts, we see that currency bulls pushed USD/CHF higher as we had expected. With this upward move, the pair climbed above the lower border of the brown declining trend channel and the green support/resistance line (marked on the weekly chart), invalidating earlier breakdowns. This is a positive signal, which suggests further improvement and a test of the Apr high. Nevertheless, before we see such price action, the current position of the indicators suggests that the pair could reverse and verified upswing above the brown line (currently around 0.9614) in the coming days.
Very short-term outlook: mixed with bullish bias
Short-term outlook: mixed with bullish bias
MT outlook: mixed
LT outlook: mixed
Trading position (short-term; our opinion): No positions are justified from the risk/reward perspective. We will keep you informed should anything change, or should we see a confirmation/invalidation of the above.
AUD/USD
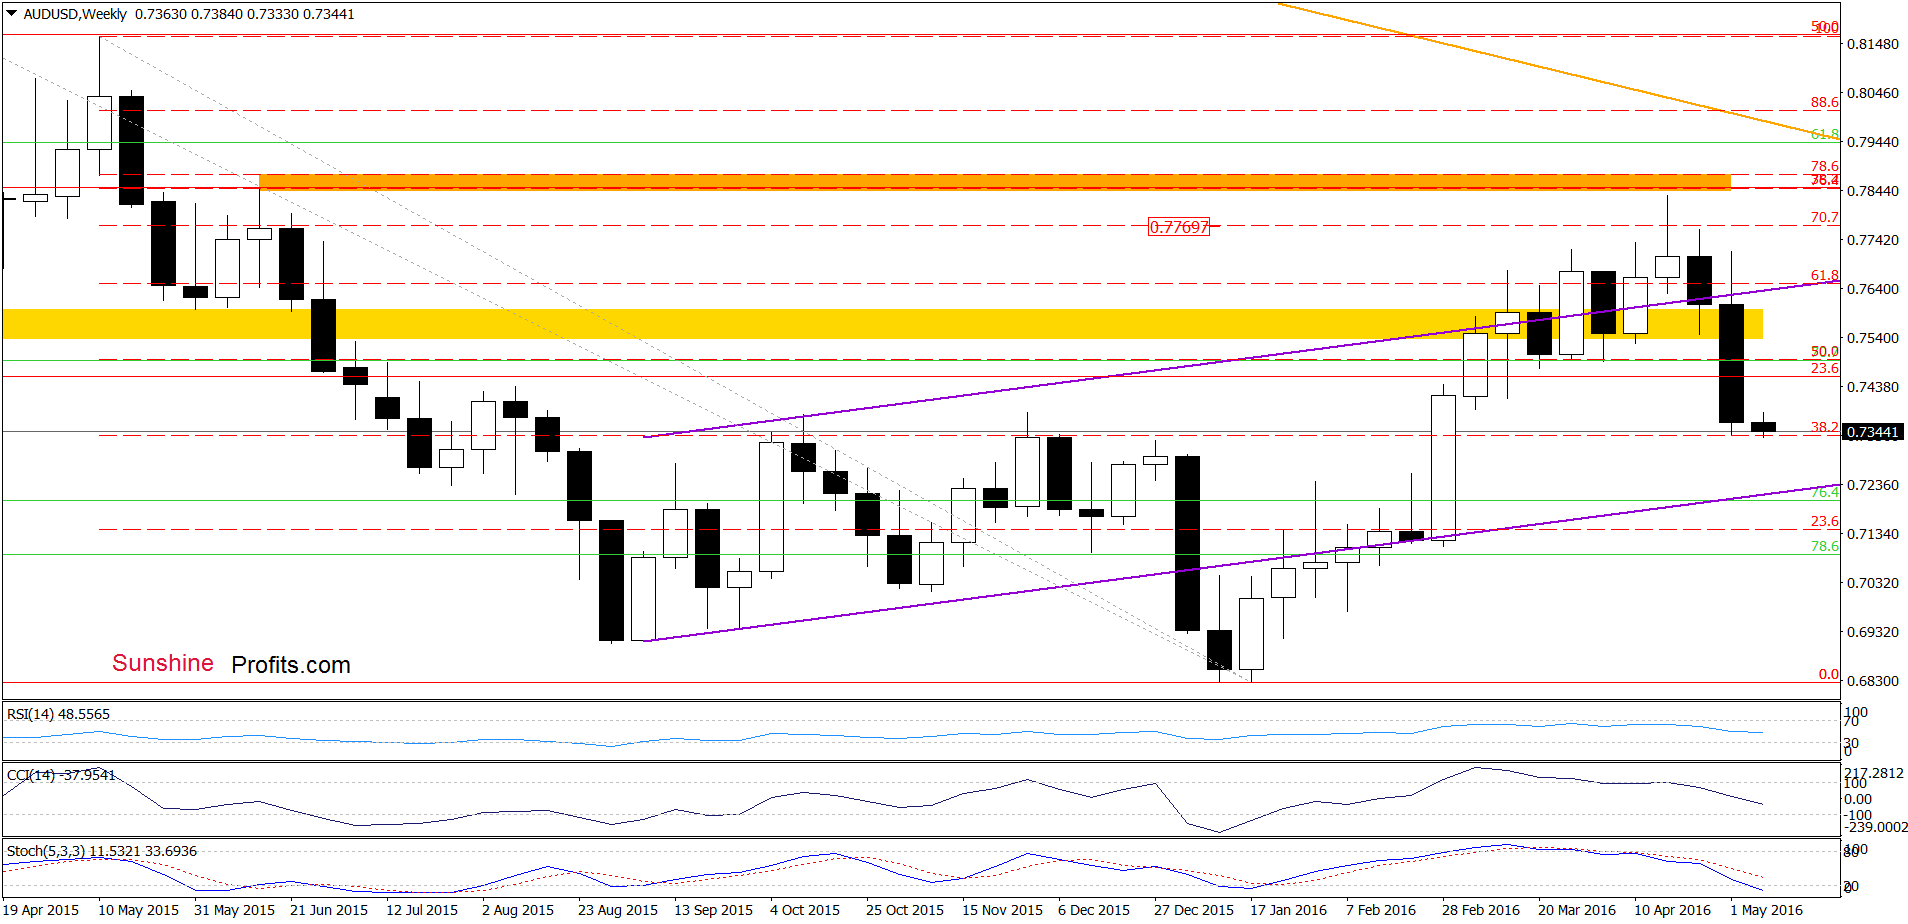
As you see on the medium-term chart, invalidation of the breakout above the previously-broken upper border of the rising purple trend channel triggered a sharp decline. How did this move affect the very short-term picture? Let’s check.
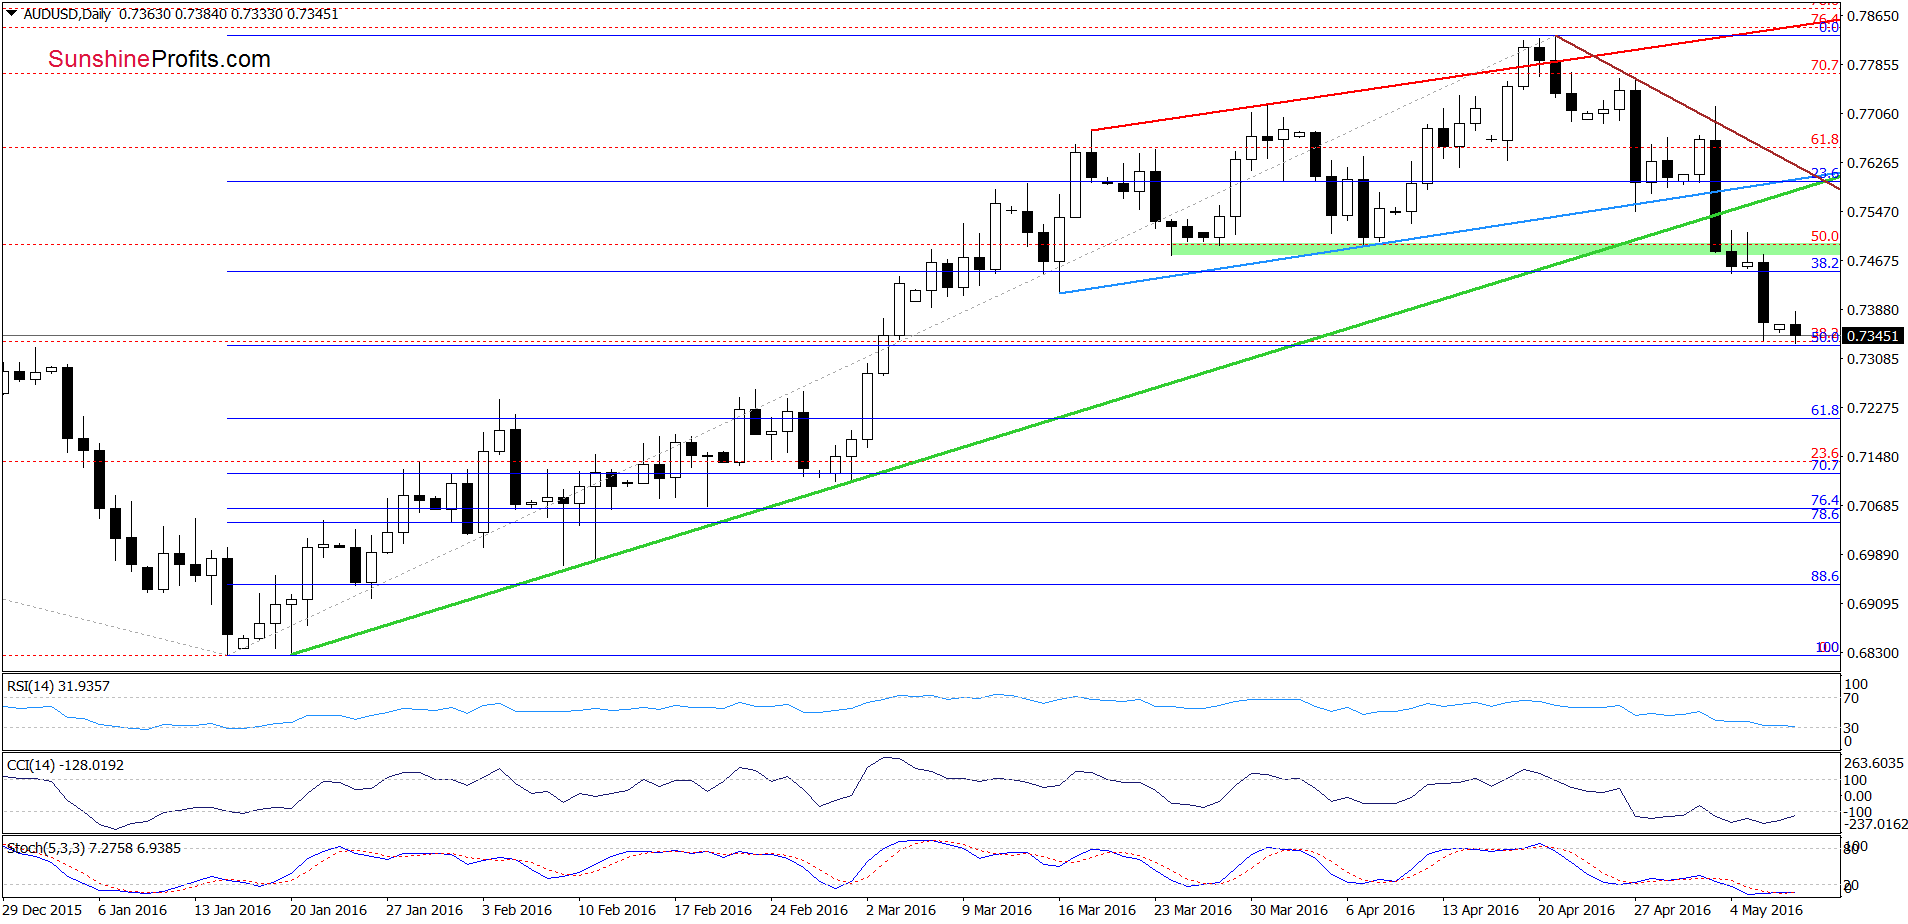
Looking at the daily chart, we see that AUD/USD broke below the green support line and the green support zone, which triggered a sharp decline on Friday. With this downward move the pair dropped to the 50% Fibonacci retracement, which in combination with the current position of the indicators suggests that we may see a reversal in the coming day(s) – especially if the CCI and Stochastic Oscillator generate buy signals.
Very short-term outlook: mixed
Short-term outlook: mixed
MT outlook: mixed
LT outlook: mixed
Trading position (short-term; our opinion): No positions are justified from the risk/reward perspective. We will keep you informed should anything change, or should we see a confirmation/invalidation of the above.
As a reminder – “initial target price” means exactly that – an “initial” one, it’s not a price level at which we suggest closing positions. If this becomes the case, we will refer to these levels as levels of exit orders. Stop-loss levels, however, are naturally not “initial”, but something that, in our opinion, might be entered as an order.
Thank you.
Nadia Simmons
Forex & Oil Trading Strategist
Przemyslaw Radomski, CFA
Founder, Editor-in-chief
Gold & Silver Trading Alerts
Forex Trading Alerts
Oil Investment Updates
Oil Trading Alerts

