

Although today’s official data showed that German Ifo Business Climate Index dropped to 106.6 in Apr, the euro moved higher against the greenback as this week’s Federal Reserve’s policy meeting weighed on investors’ sentiment. What happened at the same time with other currency pairs?
In our opinion the following forex trading positions are justified - summary:
- EUR/USD: short (stop-loss order at 1.1512; initial downside target at 1.0572)
- GBP/USD: none
- USD/JPY: none
- USD/CAD: none
- USD/CHF: none
- AUD/USD: none
EUR/USD
On Thursday, we wrote the following:
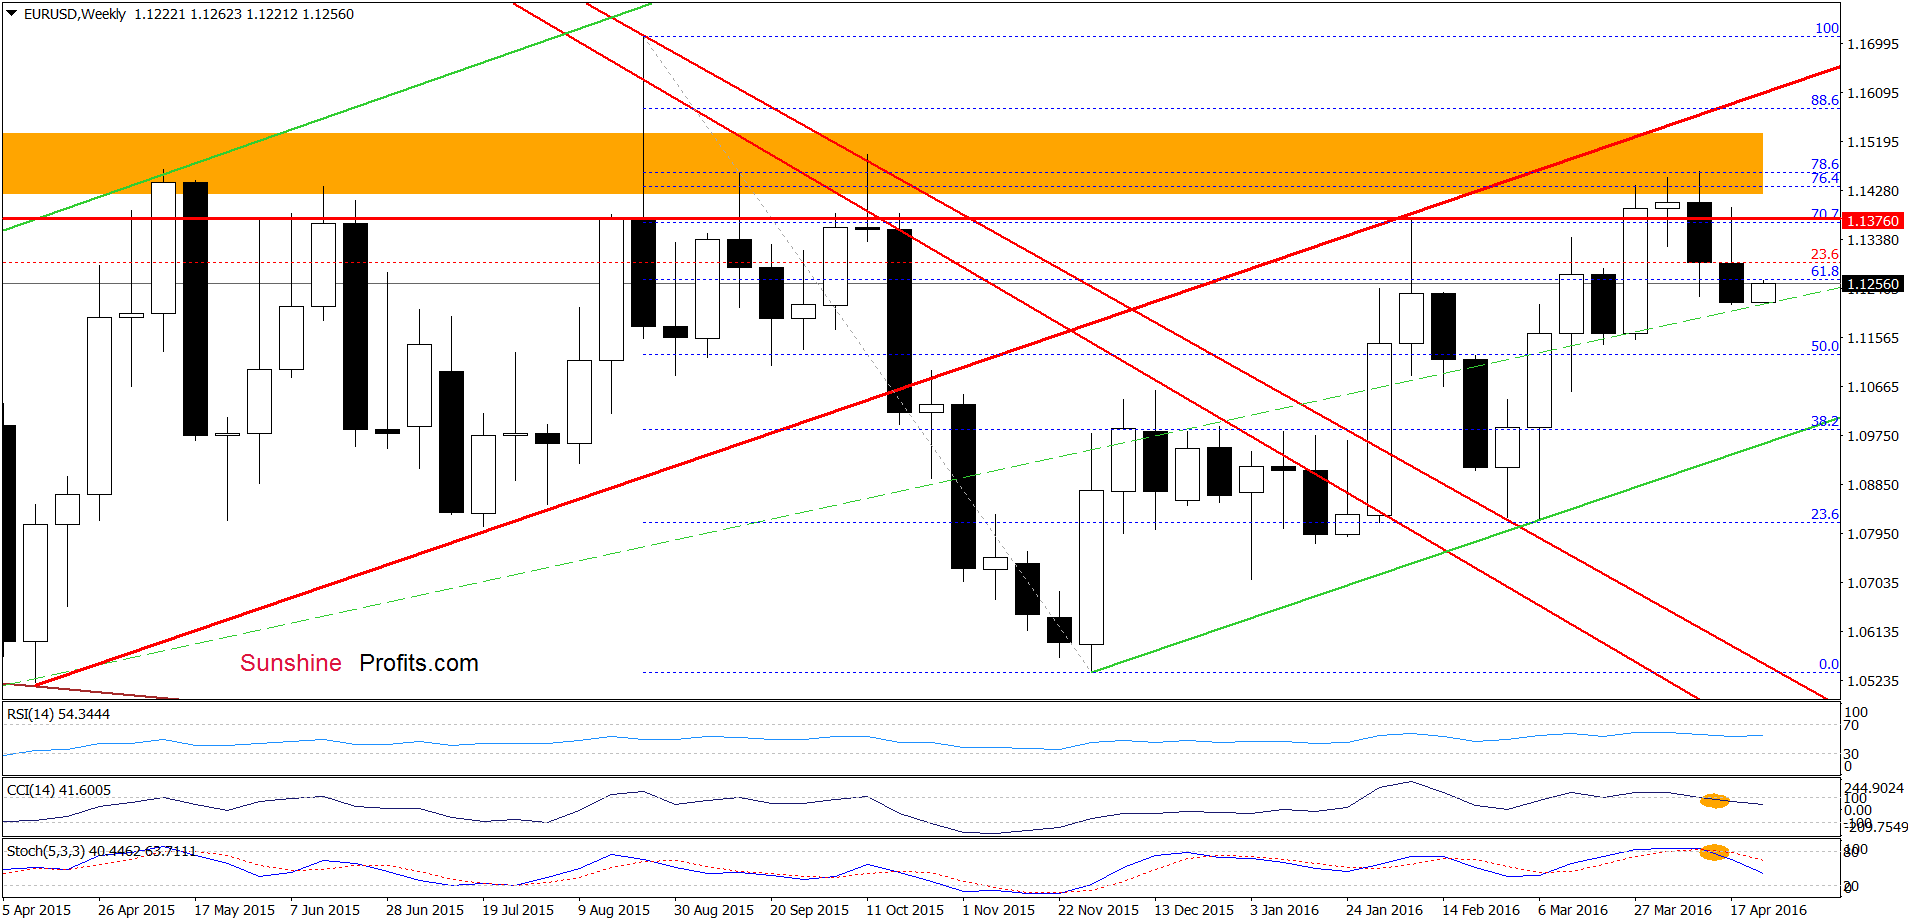
(…) the exchange rate reversed and declined quite sharply in the following hours. Thanks to this move, the pair closed another day under Feb high, invalidating earlier increase, which suggests further deterioration – especially when we factor in the fact that the Stochastic Oscillator is very close to generating another sell signal. If this is the case, and we see another downswing, the initial downside target would be around 1.1219-1.1233, where the 38.2% Fibonacci retracement (based on the March-Apr upward move) and the recent lows are.
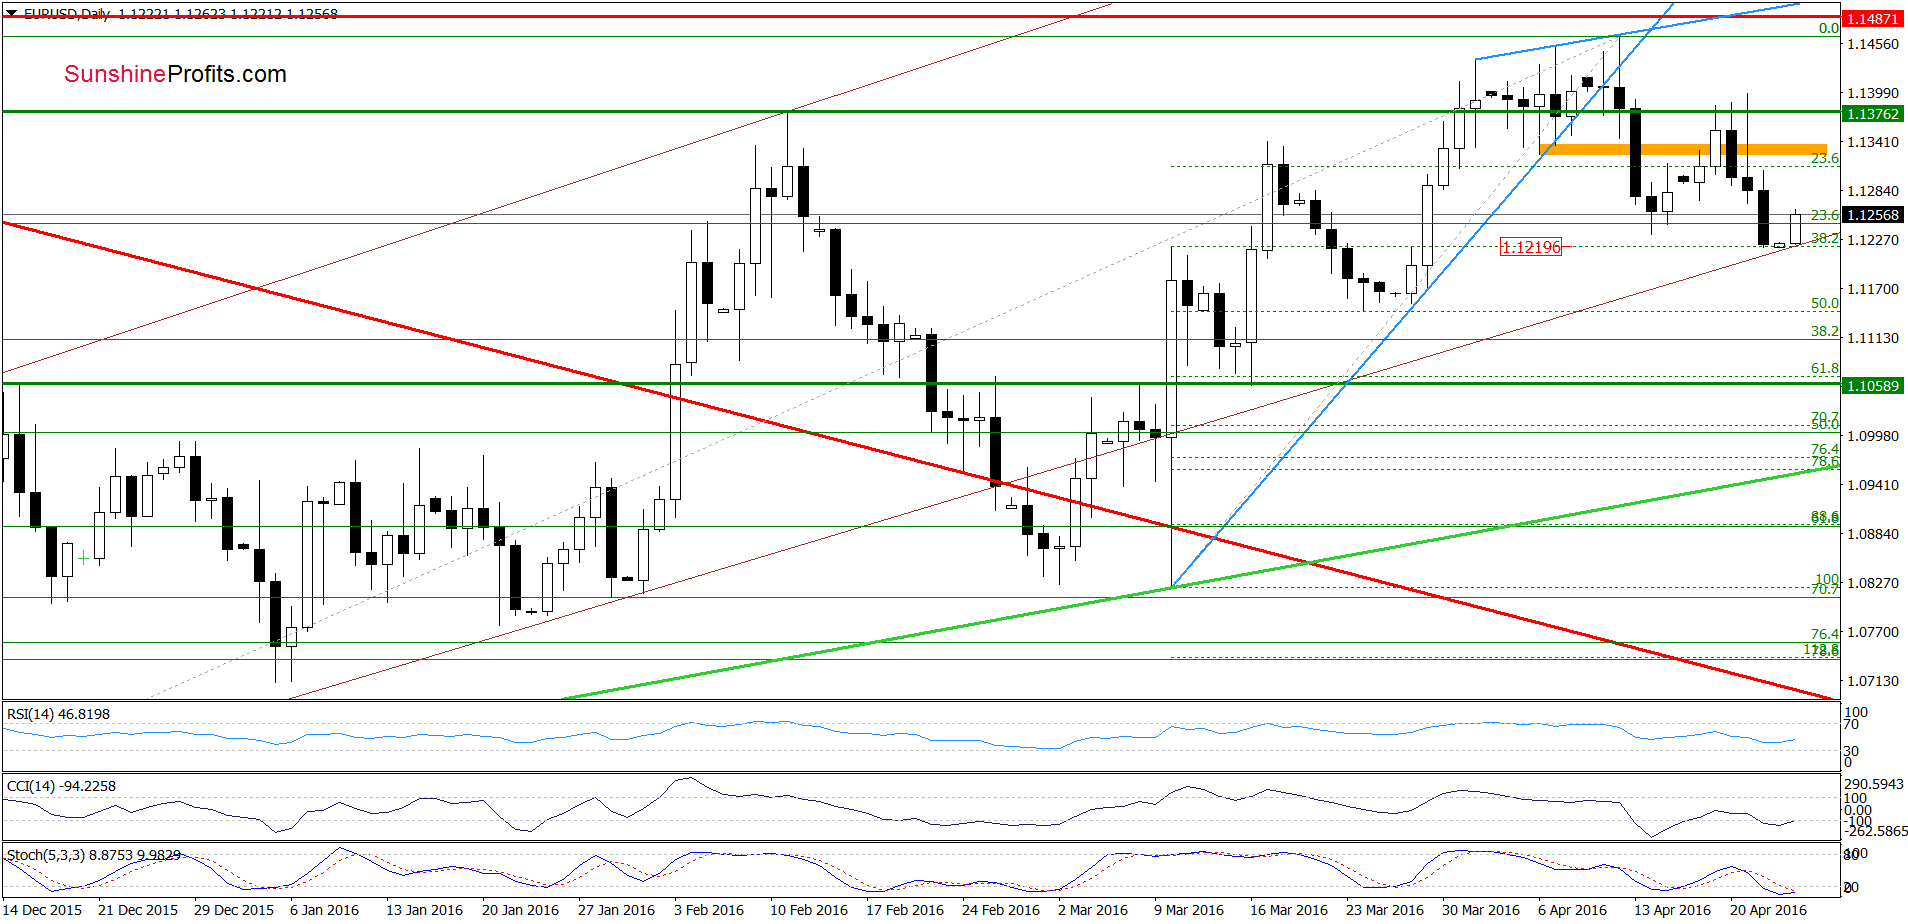
Looking at the daily chart, we see that the situation developed in line with the above scenario and EUR/USD reached our initial downside target on Friday. As you see, this support level in combination with the lower border of the brown rising trend channel encouraged currency bulls to act, which resulted in upswing earlier today. Taking this fact and the current position of the indicators into account, it seems that the exchange rate may extend gains and re-test the Feb high in the coming day(s). Nevertheless, even if we see such price action, sell signals generated by the weekly indicators suggest that further deterioration is just a matter of time.
Very short-term outlook: bearish
Short-term outlook: bearish
MT outlook: mixed with bearish bias
LT outlook: mixed
Trading position (short-term; our opinion): Short positions (with a stop-loss order at 1.1512 and the initial downside target at 1.0572) are justified from the risk/reward perspective. We will keep you informed should anything change, or should we see a confirmation/invalidation of the above.
GBP/USD
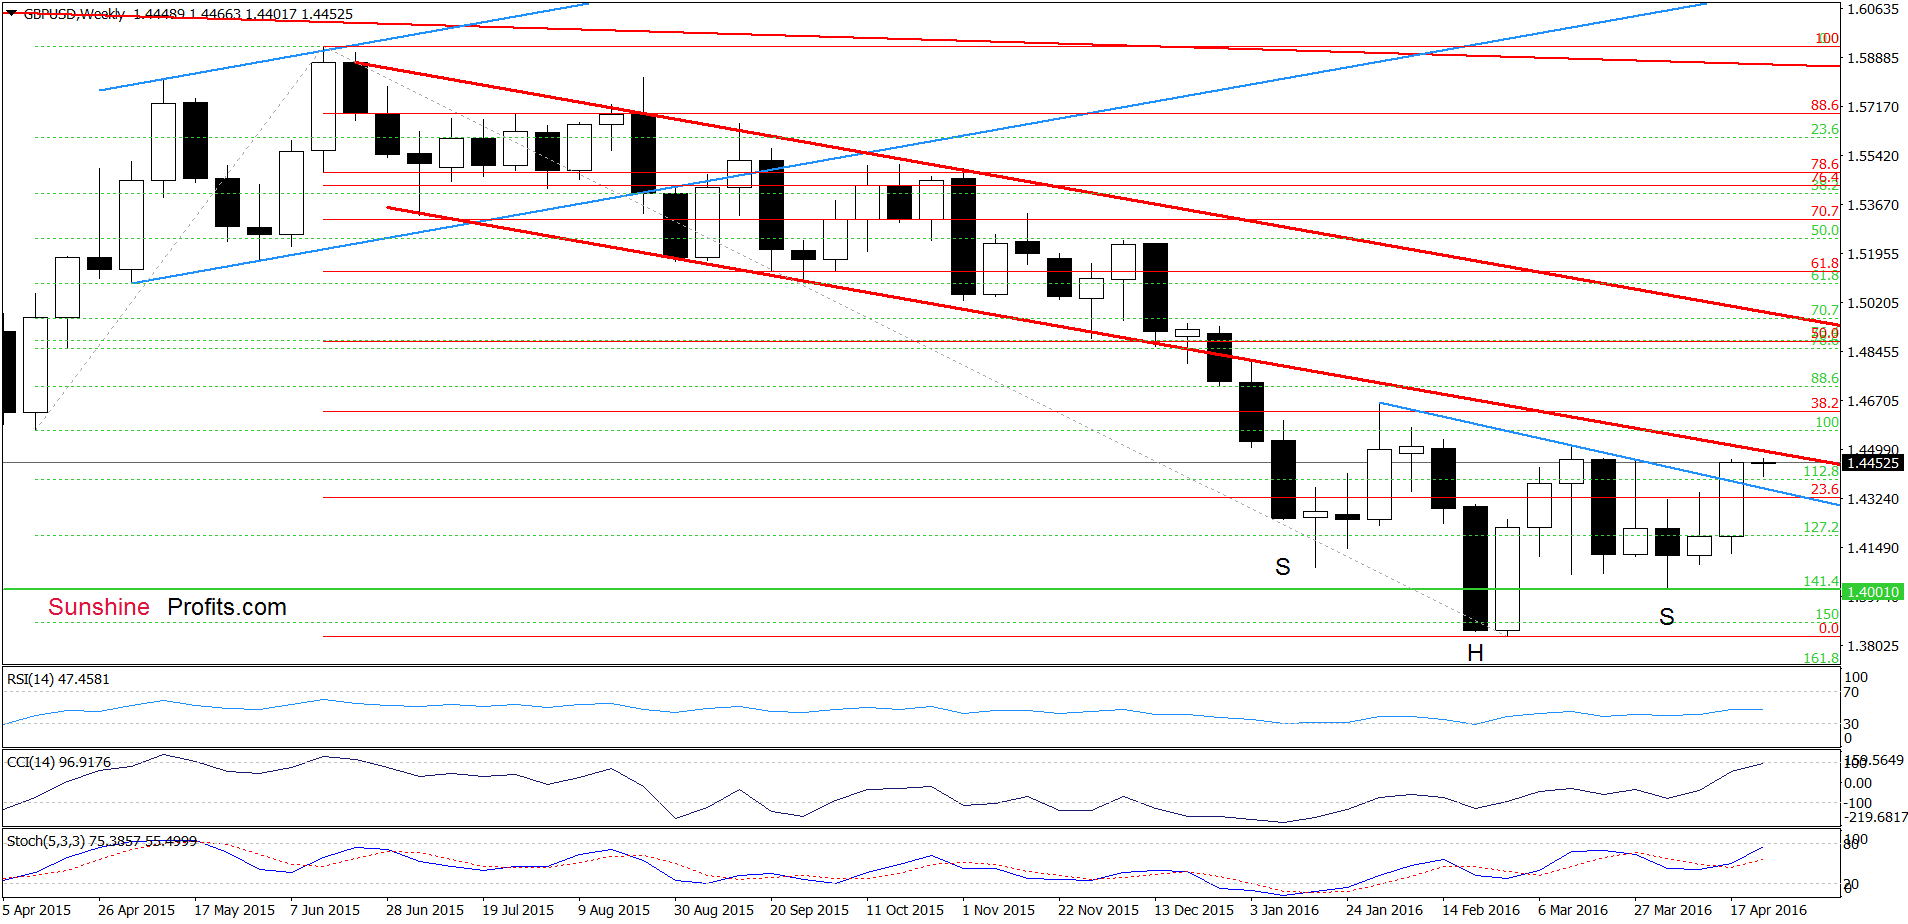
On the weekly chart, we see that although currency bulls pushed GBP/USD above the neck line of the potential reverse head and shoulders formation (marked with blue), the pair is still trading under the previously-broken lower border of the red declining trend channel. This suggests that as long as there won’t be invalidation of the breakdown under this resistance line, further rally is questionable. Are there any other factors that could encourage currency bears to act in the coming week? Let’s examine the very short-term picture and find out.
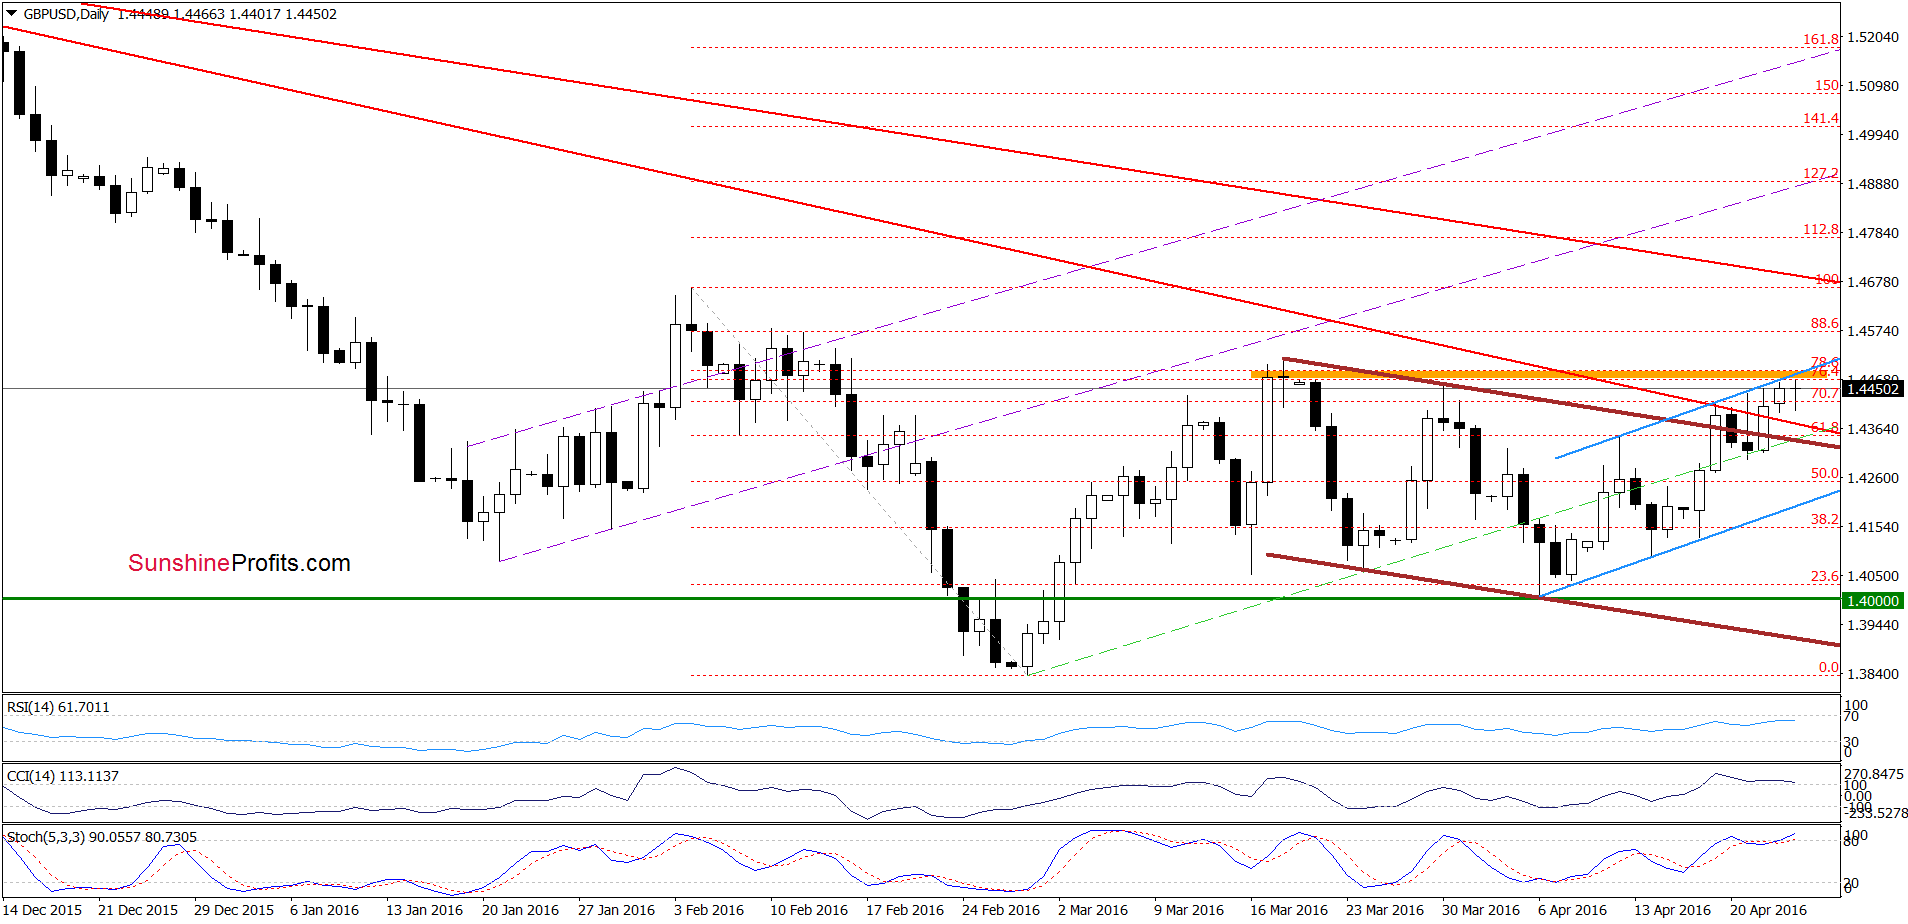
From this perspective, we see that although GBP/USD increased above the upper border of the brown declining trend channel, the pair remains under the upper line of the blue rising trend channel and the orange zone created by the 76.4% and 78.6% Fibonacci retracements, which serves as an additional resistance. At this point it is worth noting that this important resistance stopped currency bulls several times in the past, which increases the probability that we’ll see similar price action in the coming days. Taking all the above into account, we think that further improvement would be more likely and reliable if the exchange rate closes the day above the mid-March high of 1.4513. Until this time another downswing should not surprise us.
Very short-term outlook: mixed with bearish bias
Short-term outlook: mixed with bearish bias
MT outlook: mixed
LT outlook: mixed
Trading position (short-term; our opinion): No positions are justified from the risk/reward perspective at the moment. We will keep you informed should anything change, or should we see a confirmation/invalidation of the above.
USD/JPY
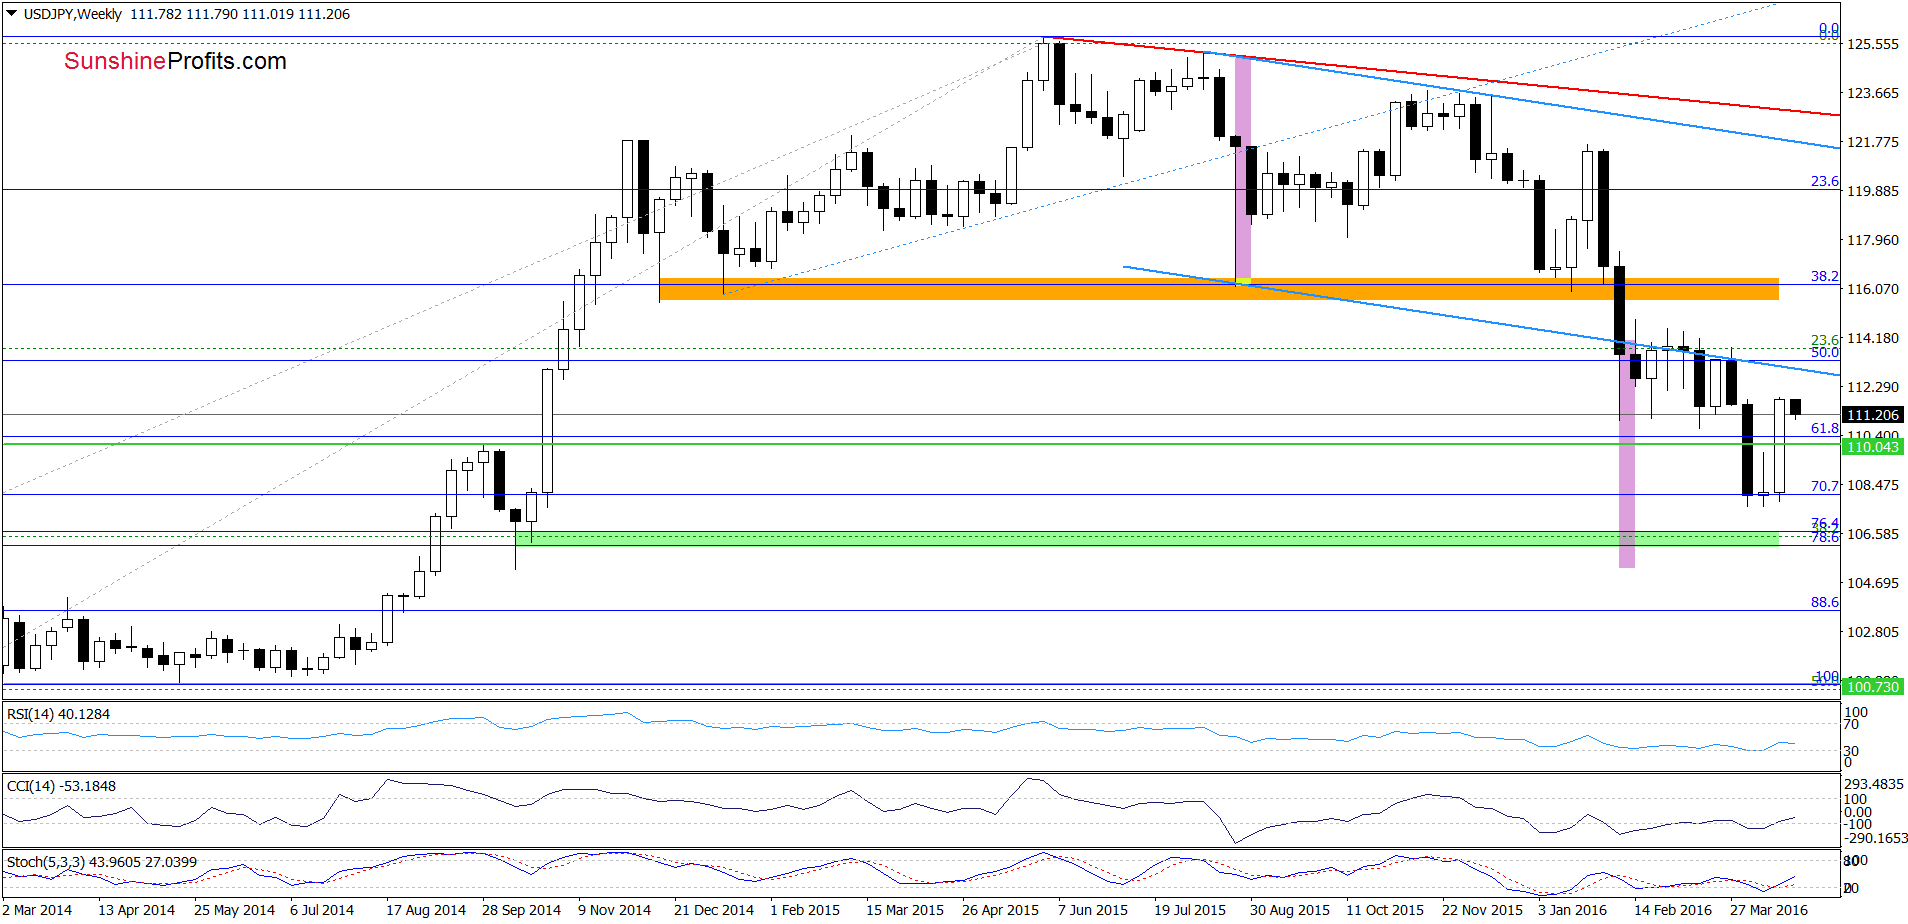
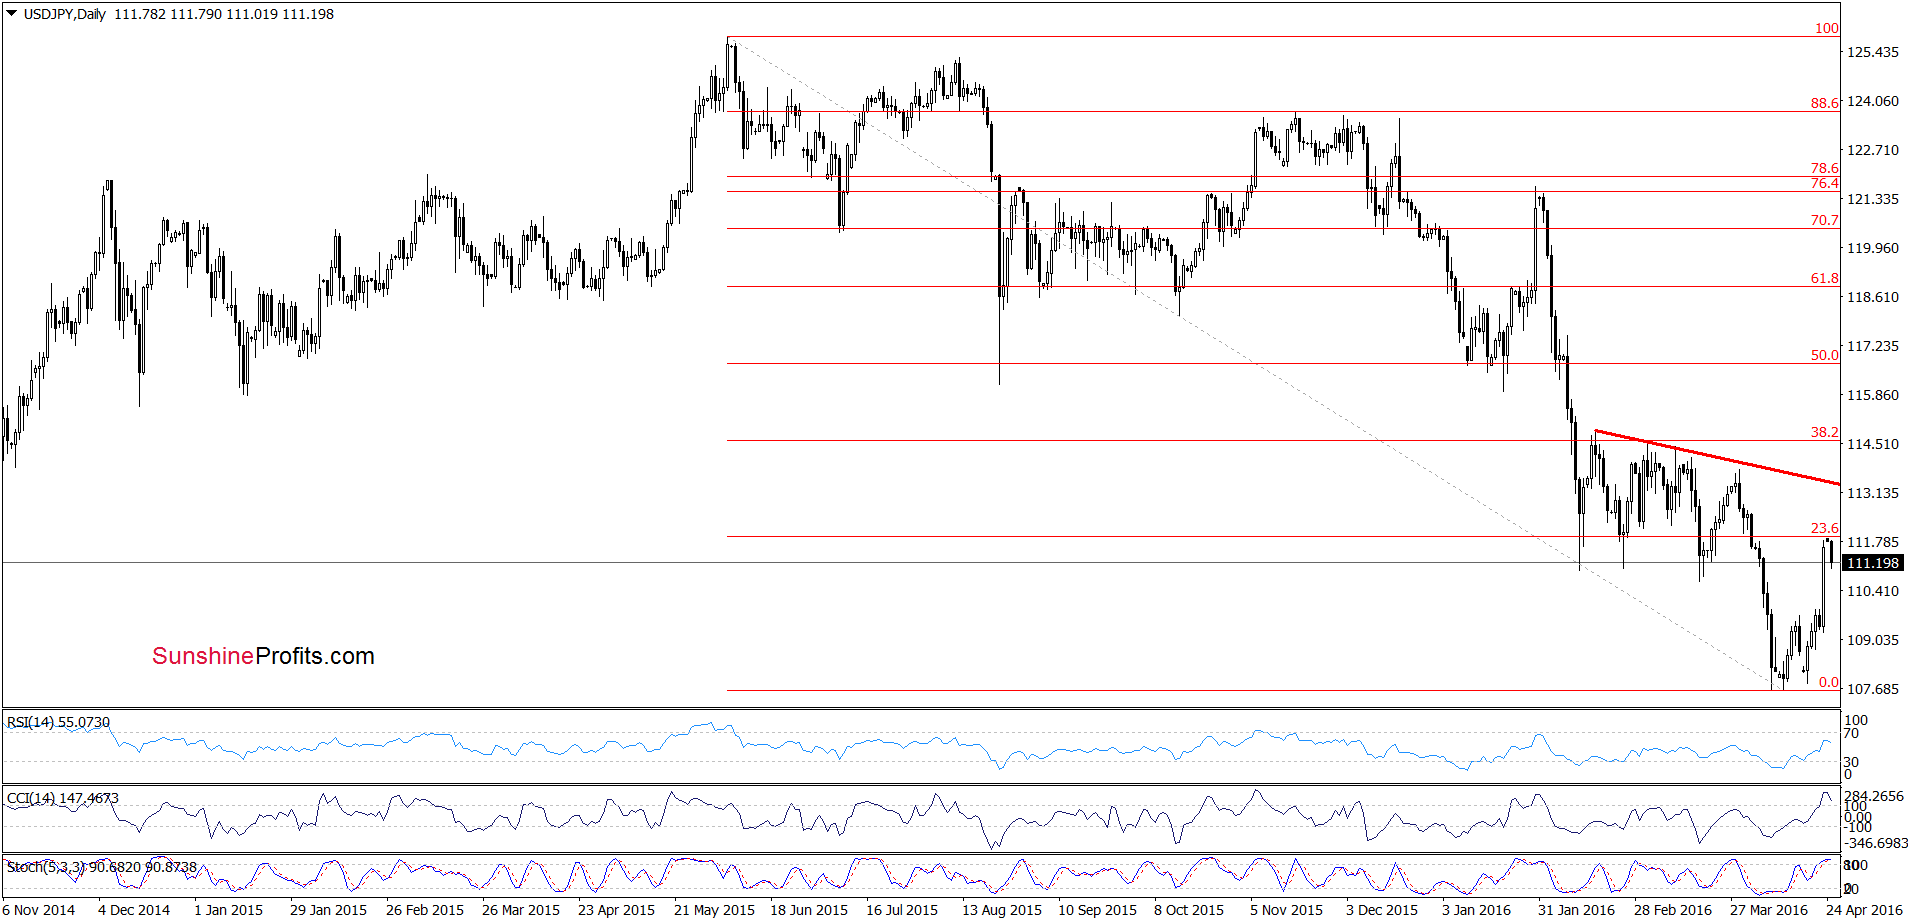
Looking at the above charts, we see that the 70.7% Fibonacci retracement encouraged currency bulls to act, which resulted in a sharp rebound in the previous week. With this upward move, USD/JPY increased to the 23.6% Fibonacci retracement (based on the entire Jun-Apr downward move), which in combination with the current position of daily indicators suggests reversal in the coming day(s) – especially when we factor in the proximity to the Feb and March lows, which serve now as an additional resistance. If this is the case, and the pair declines from here, the initial downside target would be around 110.24, where the 38.2% Fibonacci retracement (based on the recent upward move) is.
Very short-term outlook: mixed with bearish bias
Short-term outlook: mixed
MT outlook: mixed
LT outlook: mixed
Trading position (short-term; our opinion): No positions are justified from the risk/reward perspective at the moment. We will keep you informed should anything change, or should we see a confirmation/invalidation of the above.
USD/CAD
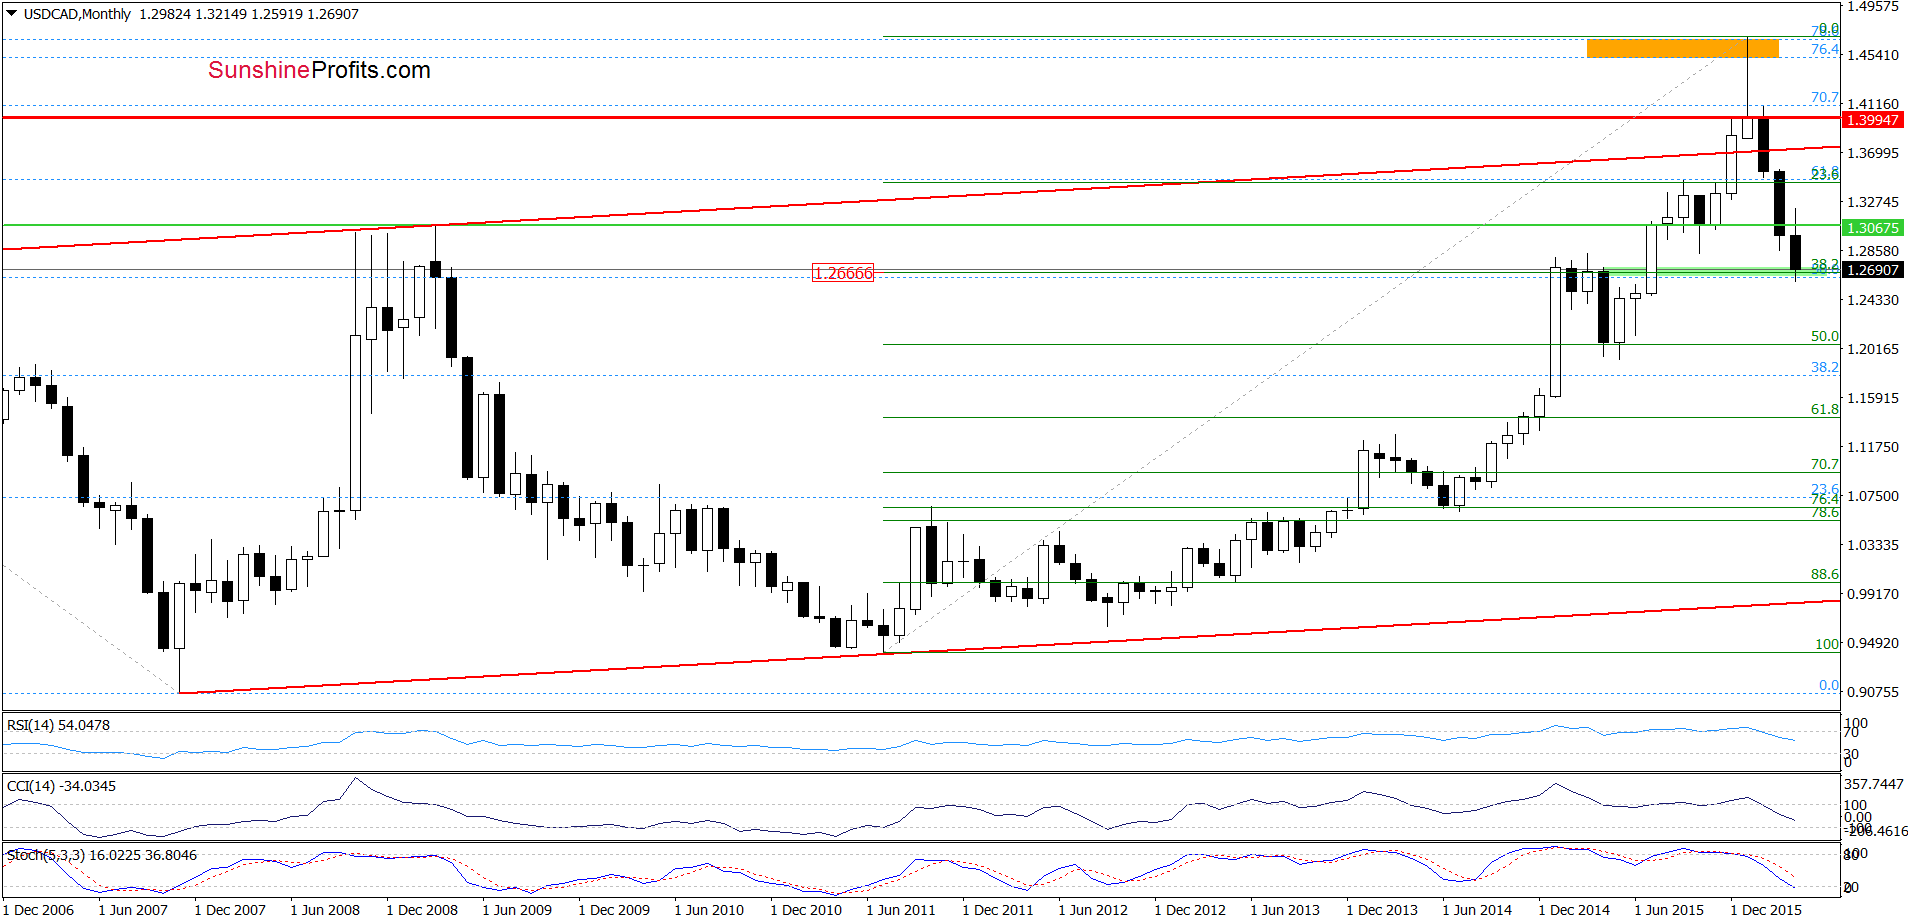
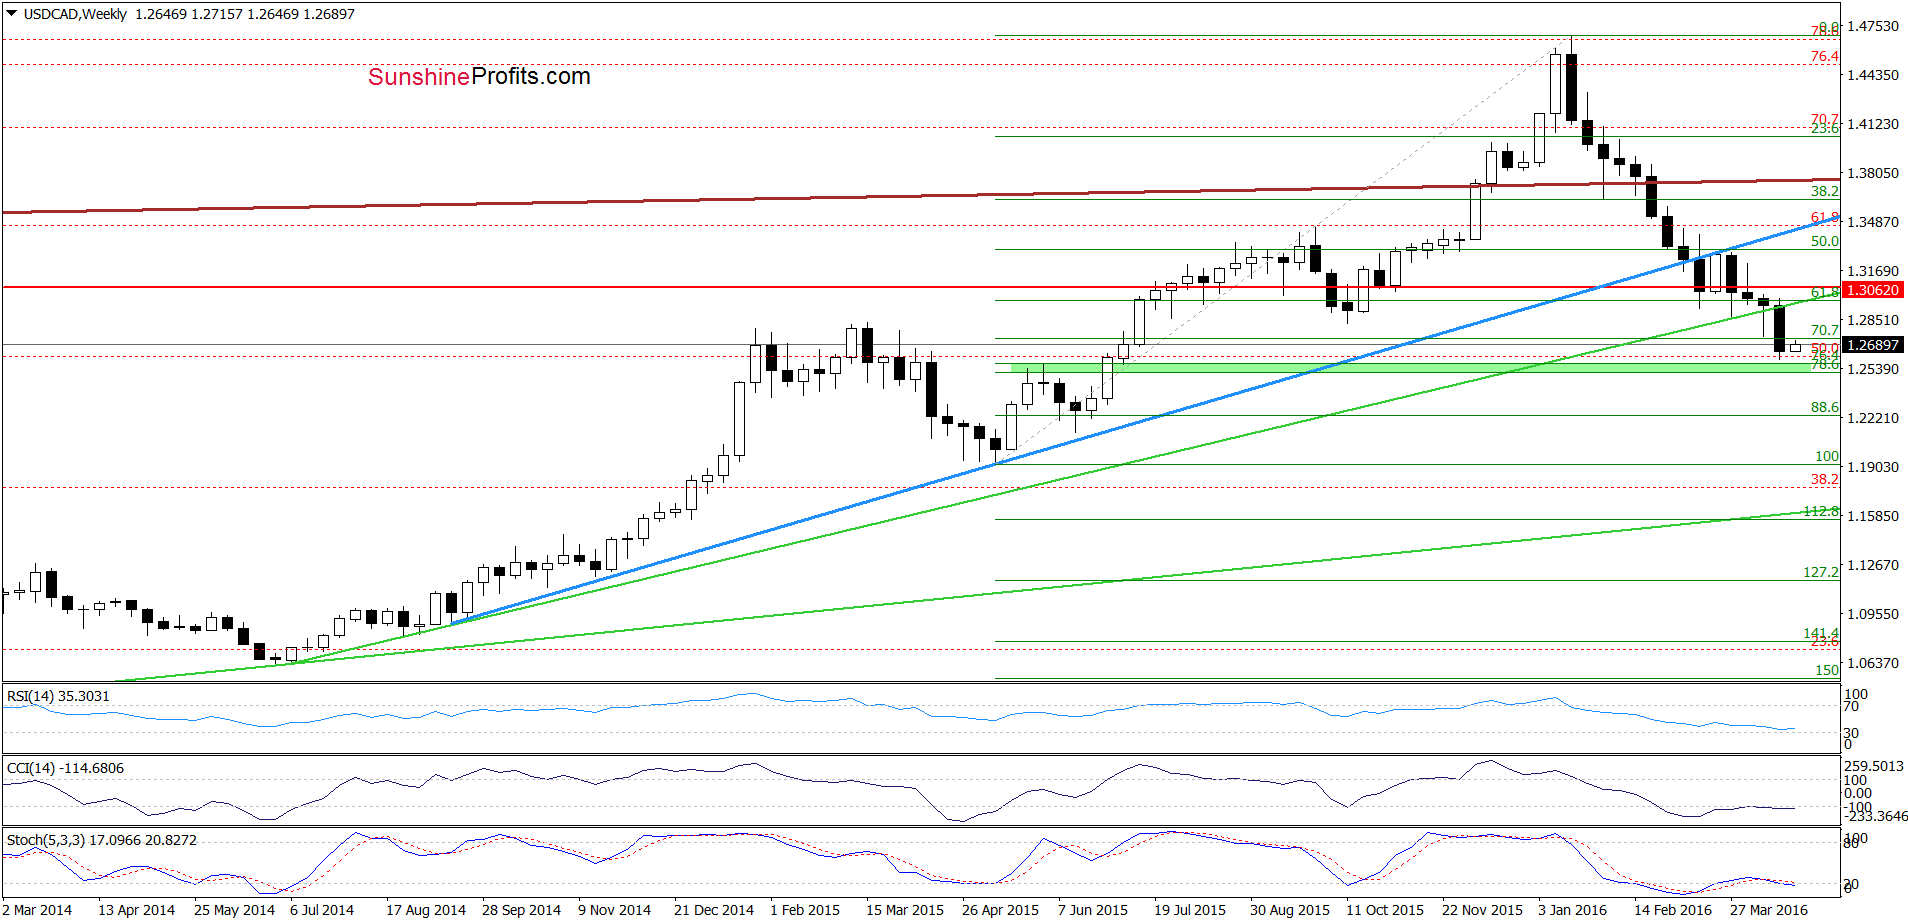
On the above charts, we see that although USD/CAD moved lower in the previous week and tested the strength of the 38.2% Fibonacci retracement (based on the entire Jul 2011-Jan 206 rally), the pair rebounded slightly earlier today. However, as long as the exchange rate remains under the previously-broken green line (seen on the weekly chart) another test of the above-mentioned Fibonacci retracement (or even the green support zone marked on the weekly chart) can’t be ruled out. Nevertheless, taking this fact into account and the current picture of crude oil, we still believe that reversal and higher values of the exchange rate are just around the corner.
Very short-term outlook: mixed
Short-term outlook: mixed with bullish bias
MT outlook: mixed
LT outlook: mixed
Trading position (short-term; our opinion): No positions are justified from the risk/reward perspective at the moment. We will keep you informed should anything change, or should we see a confirmation/invalidation of the above.
USD/CHF
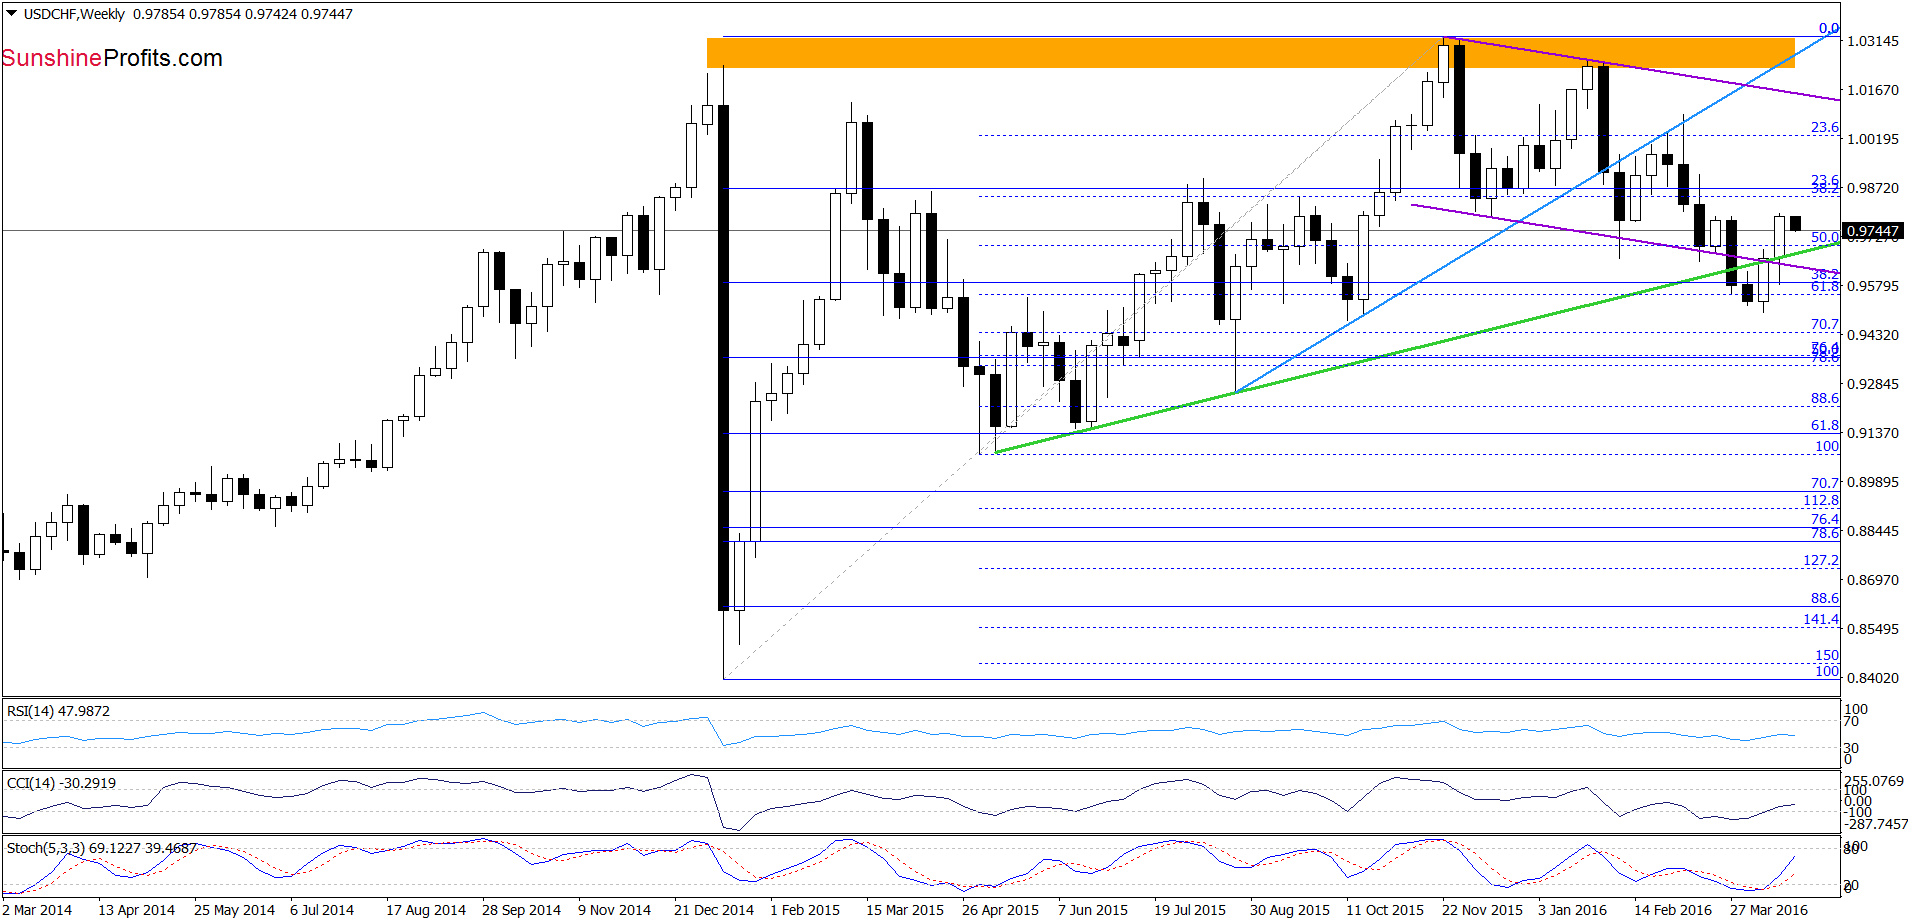
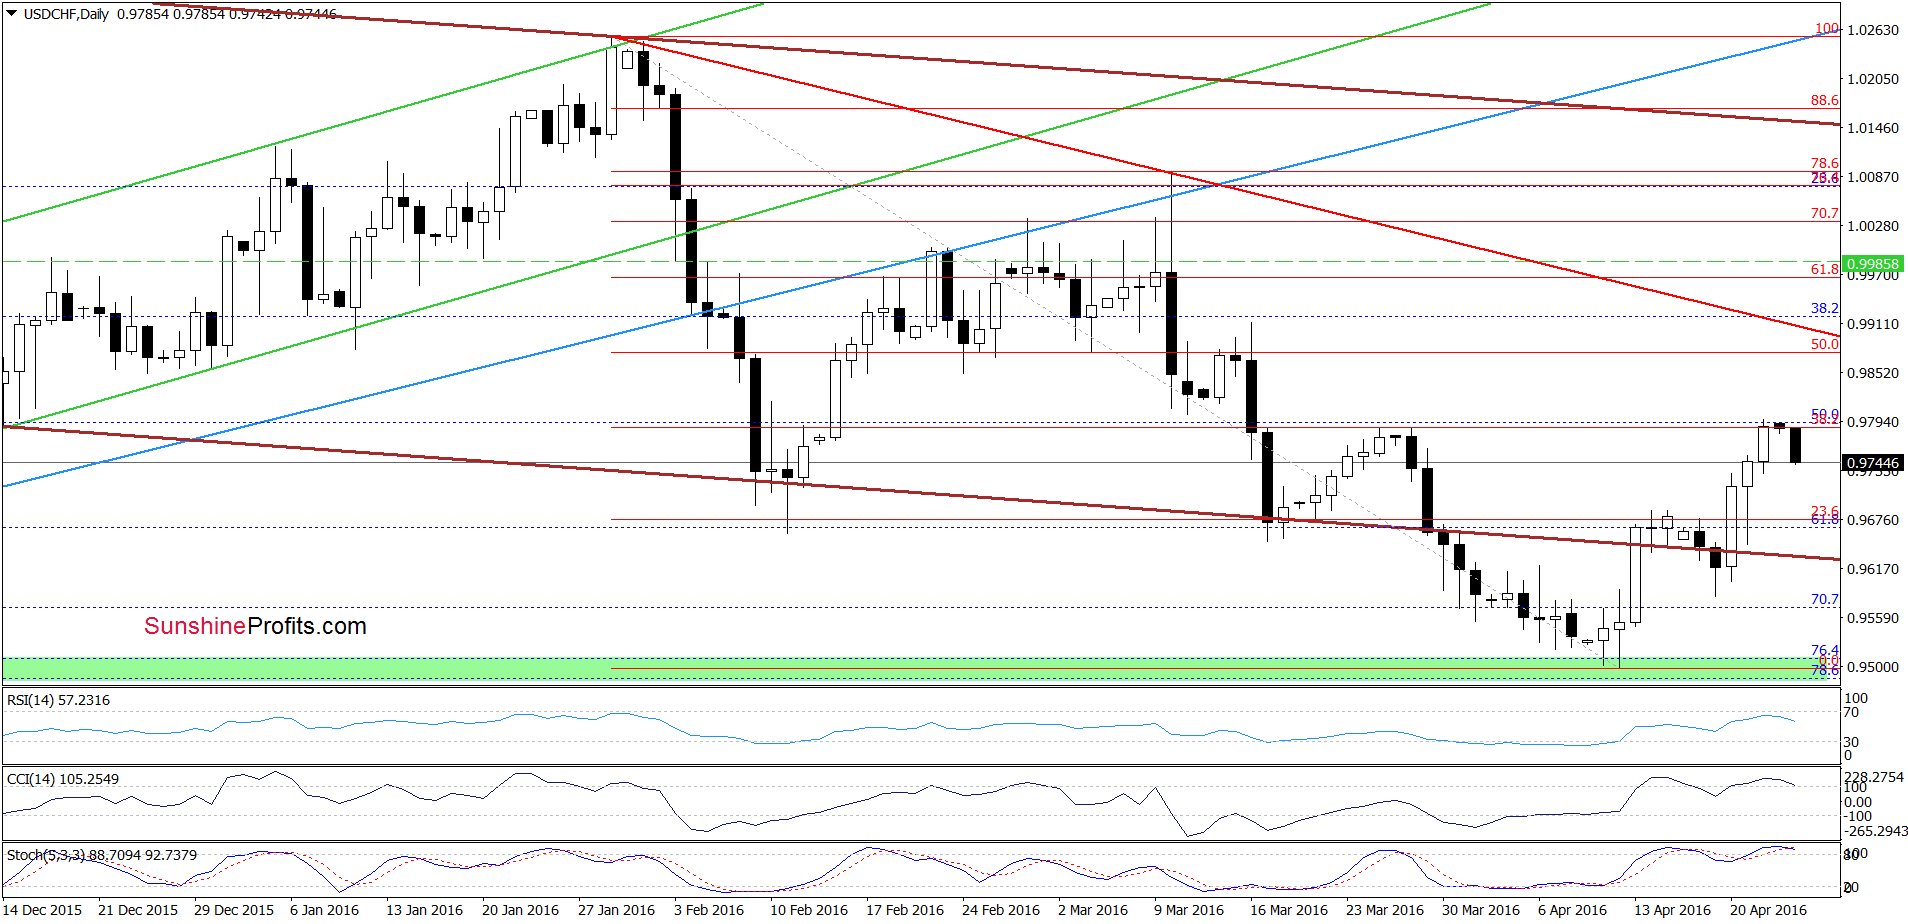
On the daily chart, we see that USD/CHF extended gains and reached the 38.2% Fibonacci retracement (based on the late-Jan – mid-Apr decline) and the late-March highs, which in combination with the current position of the indicators (they are very close to generating sell signals) suggests that reversal and lower values of the exchange rate are very likely. If this is the case and the pair declines further, the initial downside target would be around 0.9664, where the green support line (marked on the weekly chart) currently is.
Very short-term outlook: mixed with bearish bias
Short-term outlook: mixed
MT outlook: mixed
LT outlook: mixed
Trading position (short-term; our opinion): No positions are justified from the risk/reward perspective. We will keep you informed should anything change, or should we see a confirmation/invalidation of the above.
AUD/USD
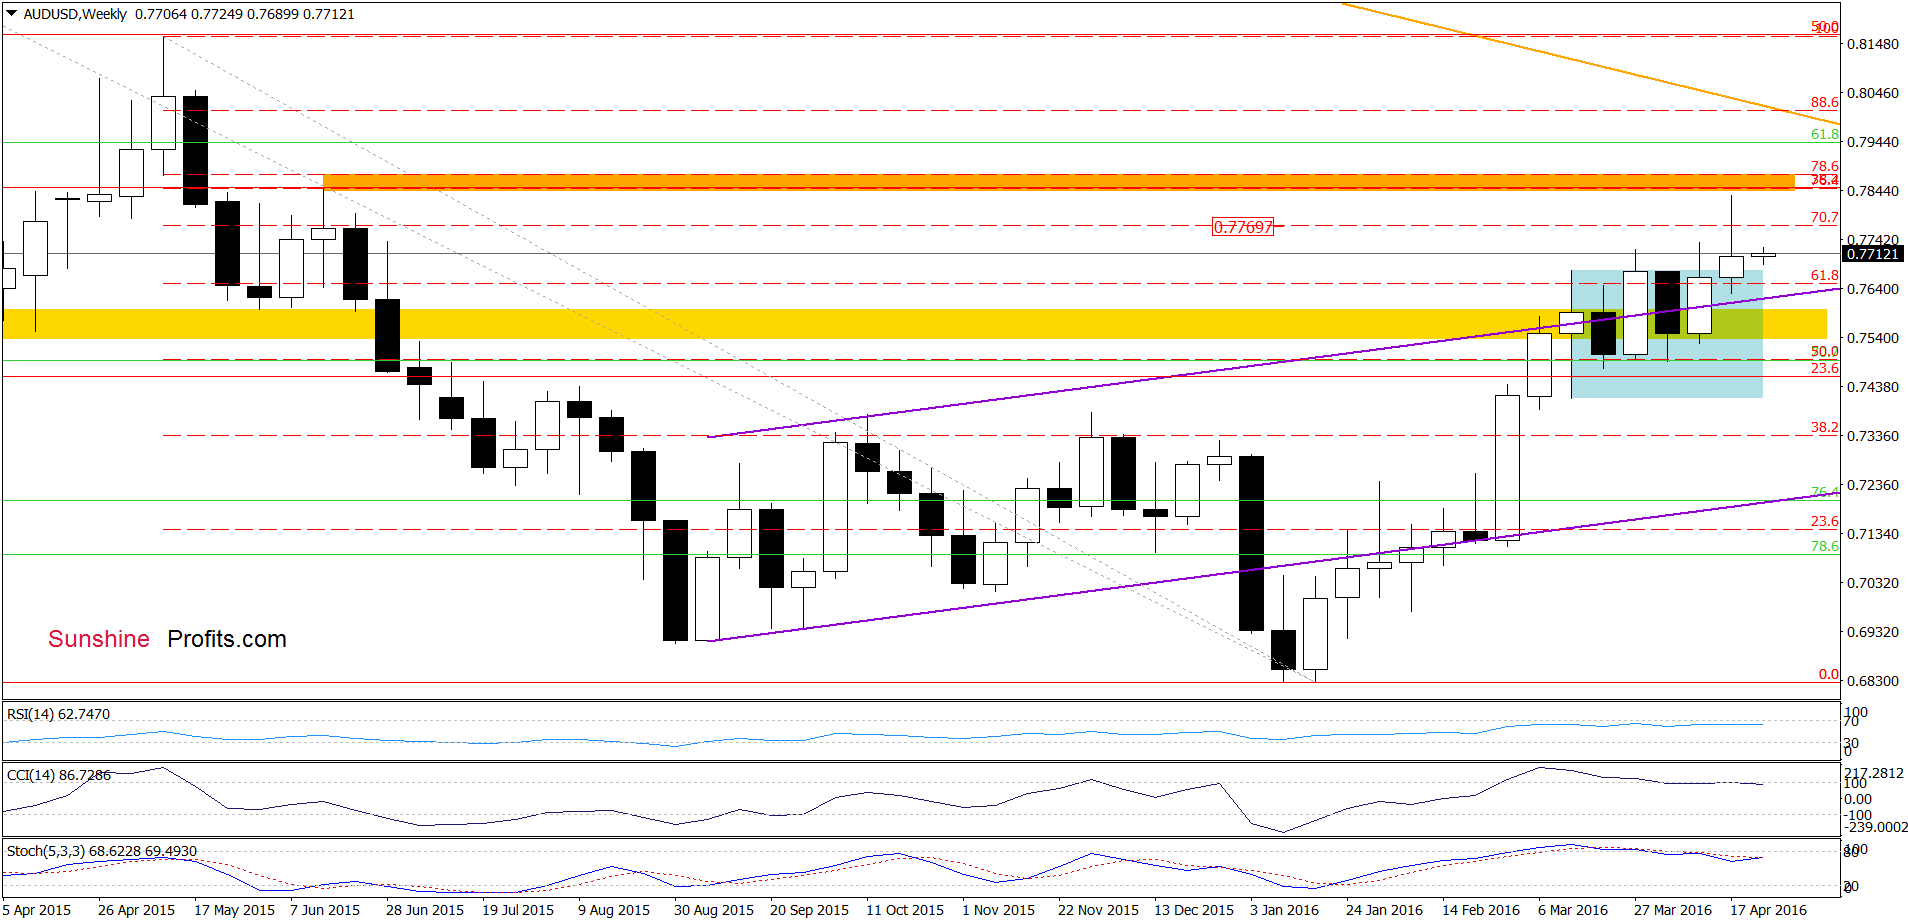
Looking at the weekly chart, we see that the proximity to the orange resistance zone (created by the 76.4% and 78.6% Fibonacci retracement levels based on the May-Jan downward move) encouraged currency bears to act. As a result, the pair pulled back to the previously-broken highs. What impact did this move have on the daily chart? Let’s check.
On Thursday, we wrote the following:
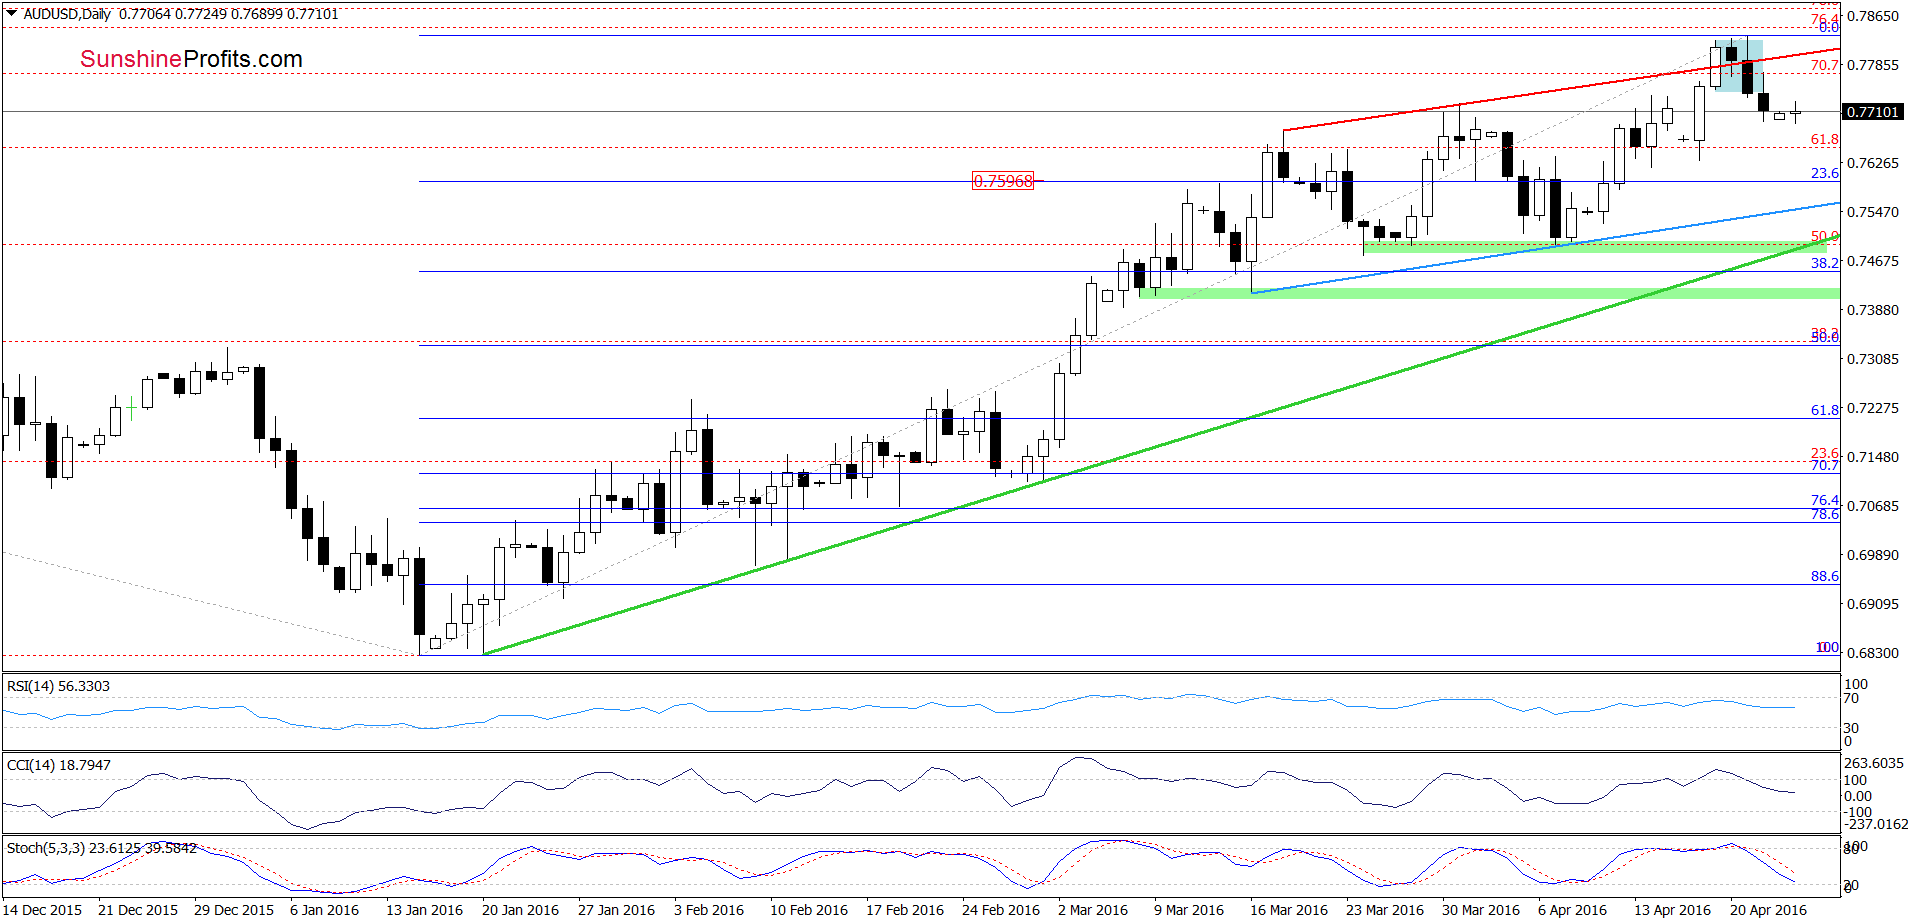
(…) AUD/USD is consolidating above the previously-broken red resistance line based on the previous highs. This suggests that a breakout above the upper line of the formation (or a breakdown under the lower line) will indicate the direction of another upswing/downswing. Nevertheless, the current position of the indicators suggests that even if the pair moves higher from here, the space for gains seems limited and reversal is just around the corner.
From today’s point of view, we see that the exchange rate declined as we had expected. With this downswing, the pair dropped under the lower border of the consolidation, which in combination with sell signals generated by the indicators suggests further deterioration. If this is the case, the initial downside target would be around 0.7597, where the 23.6% Fibonacci retracement (based on the entire Jan-Apr rally) is.
Very short-term outlook: mixed with bearish bias
Short-term outlook: mixed
MT outlook: mixed
LT outlook: mixed
Trading position (short-term; our opinion): No positions are justified from the risk/reward perspective. We will keep you informed should anything change, or should we see a confirmation/invalidation of the above.
Thank you.
Nadia Simmons
Forex & Oil Trading Strategist
Przemyslaw Radomski, CFA
Founder, Editor-in-chief
Gold & Silver Trading Alerts
Forex Trading Alerts
Oil Investment Updates
Oil Trading Alerts

