

Earlier today, the Ifo German business climate index slipped to 107.3 from December’s 108.6, missing expectations for a reading of 108.4. Thanks to these disappointing numbers, the euro moved lower against the U.S. currency. Will we see lower values of EUR/USD in the coming week?
In our opinion the following forex trading positions are justified - summary:
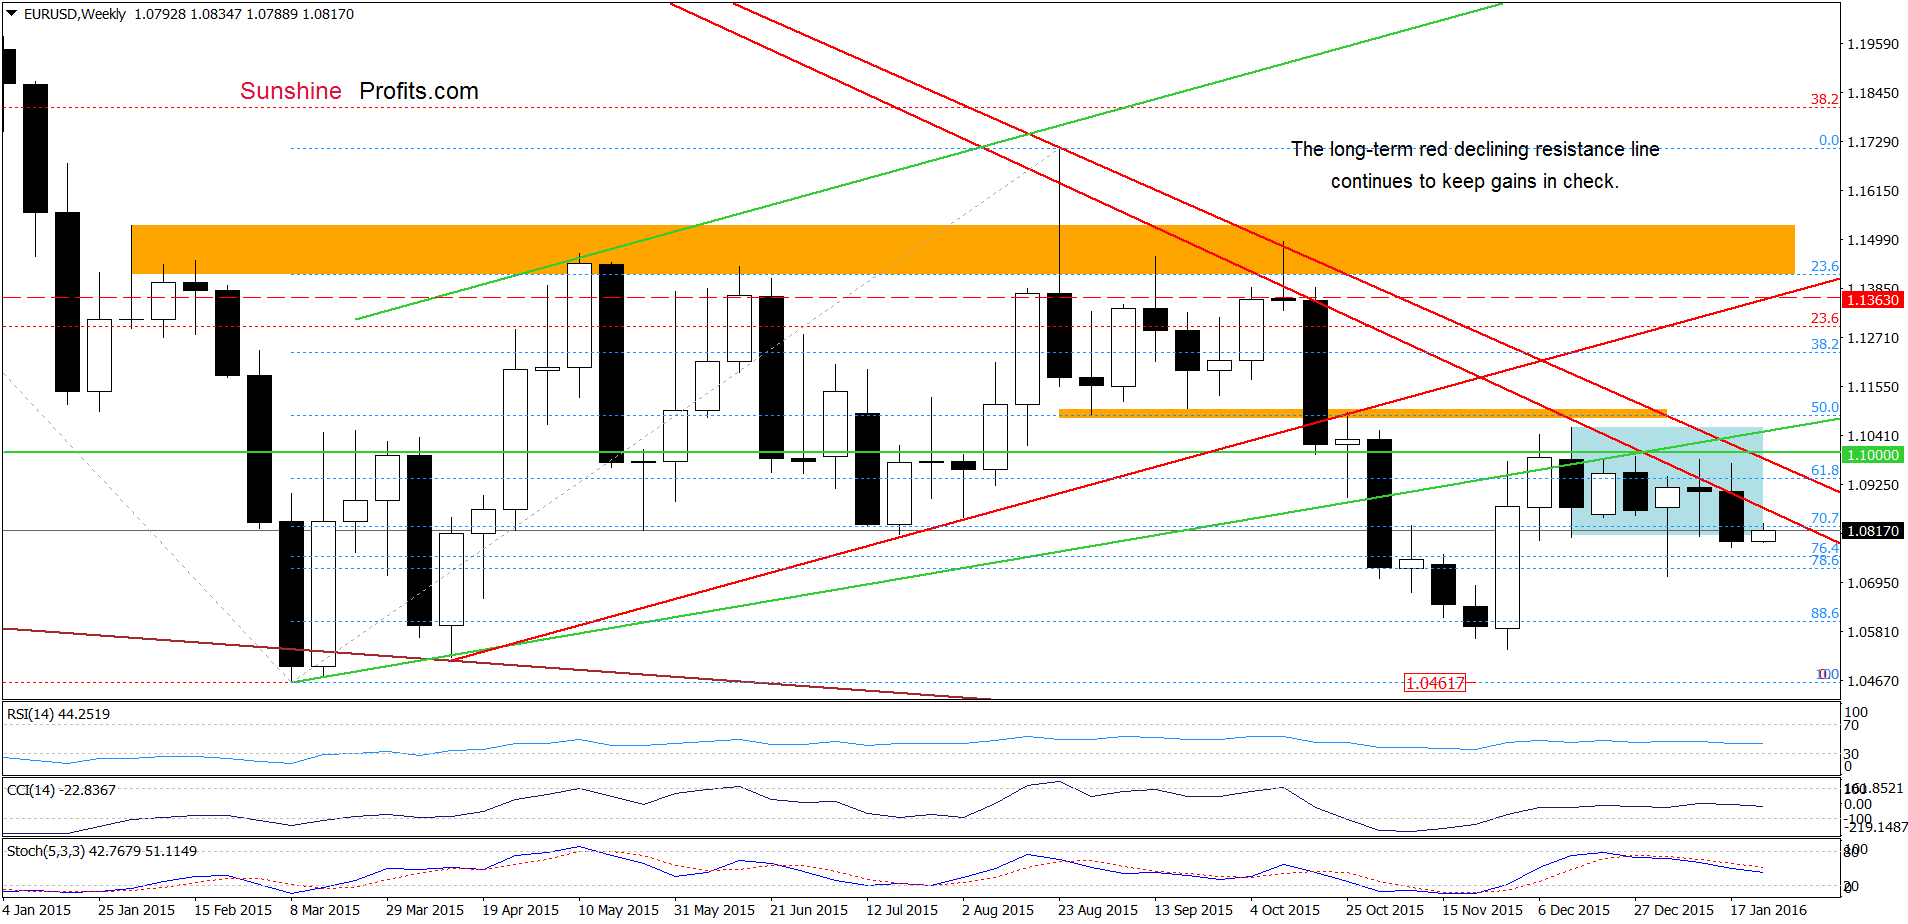
- EUR/USD: short (stop-loss order at 1.1363; initial downside target at 1.0462)
- GBP/USD: none
- USD/JPY: none
- USD/CAD: none
- USD/CHF: none
- AUD/USD: none
EUR/USD
Quoting our previous alert:
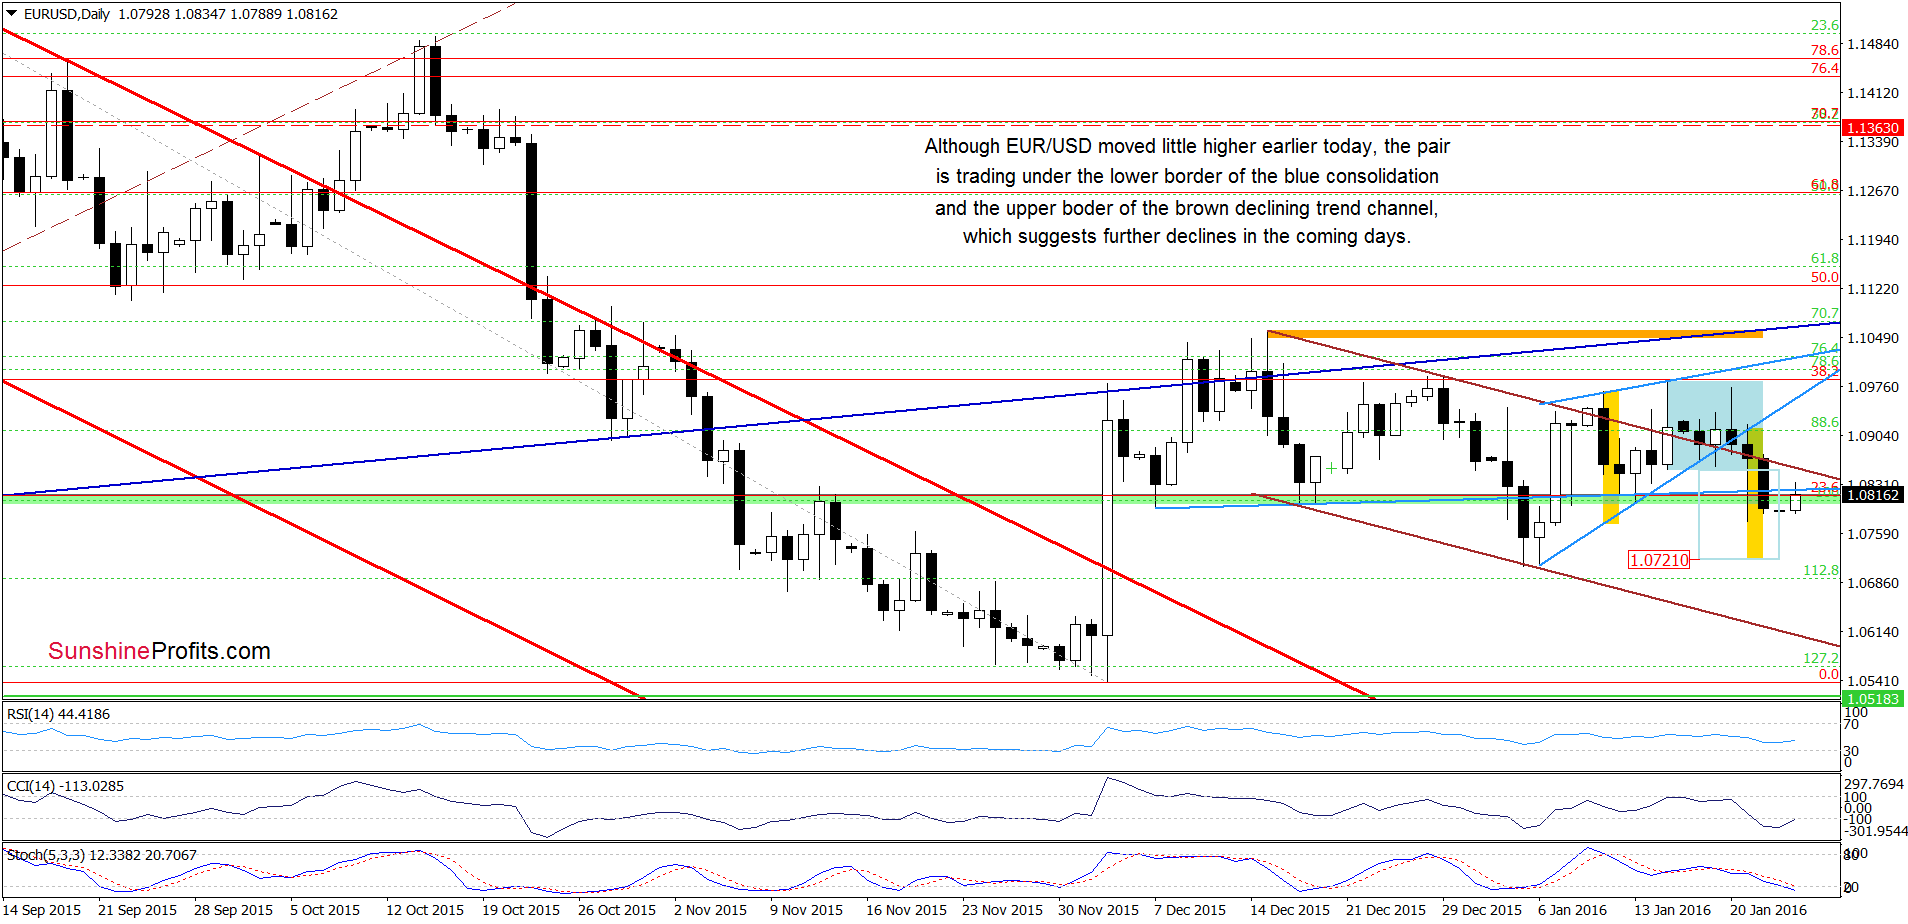
(…) the pair slipped below the blue support line (the lower border of the blue rising wedge) and invalidated earlier breakout above the upper border of the brown declining trend channel. On top of that, yesterday’s downswing took the pair under the lower border of the blue consolidation, which all together do not bode well EUR/USD and suggest lower values of the exchange rate in the coming days.
On Friday, currency bears pushed the pair lower as we had expected. With this downswing, EUR/USD declined under the green support zone and closed the day below it, which is a negative signal. Although the exchange rate moved little higher earlier today, this upswing looks like a verification of the breakdown under the upper border of the brown declining trend channel. If this is the case, and the pair reverses and declines from here in near future, our downside targets from Friday would be in play:
How low could the pair go in the coming days? As you see on the above chart, if the pair breaks under the green support zone, the initial downside target would be around 1.072, where the size of the downward move will correspond to the height of the above-mentioned formations. At this point, it is worth noting that if EUR/USD slips under the Jan low, the next downside target for currency bears would be the lower border of the brown trend channel (currently around 1.0617).
Very short-term outlook: bearish
Short-term outlook: bearish
MT outlook: bearish
LT outlook: mixed
Trading position (short-term; our opinion): Short positions (with a stop-loss order at 1.1363 and the initial downside target at 1.0462) are justified from the risk/reward perspective. We will keep you informed should anything change, or should we see a confirmation/invalidation of the above.
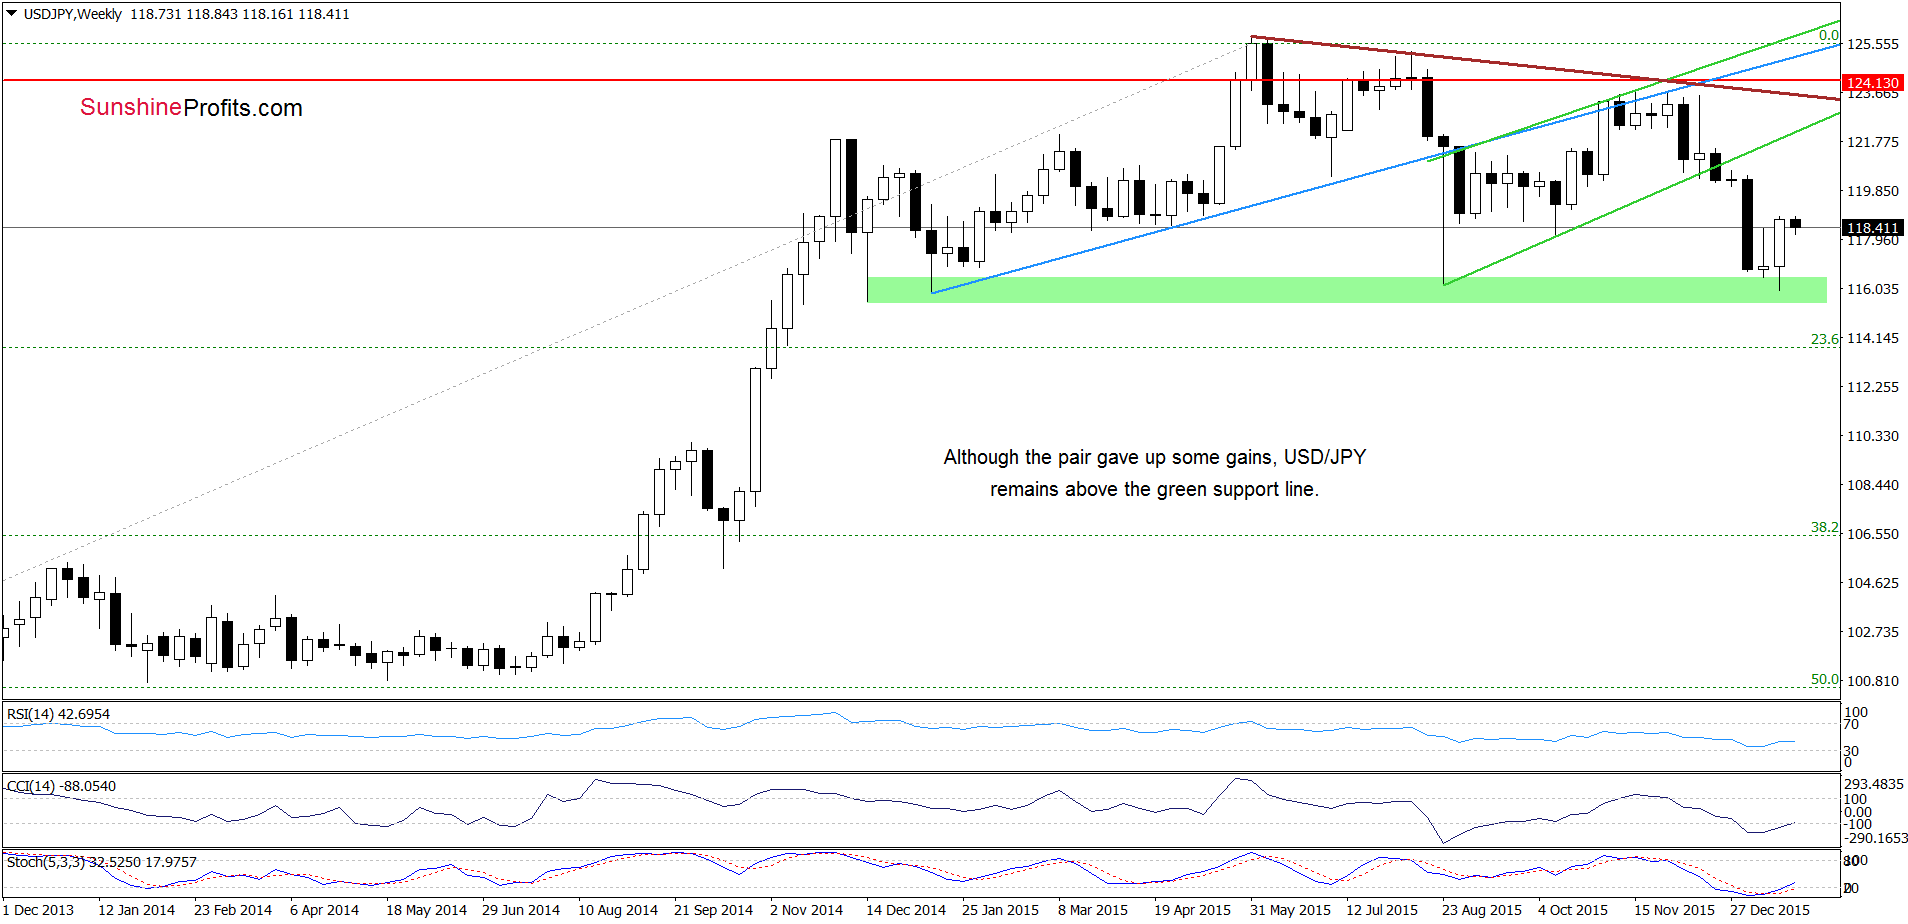
USD/JPY
On Friday, we wrote the following:
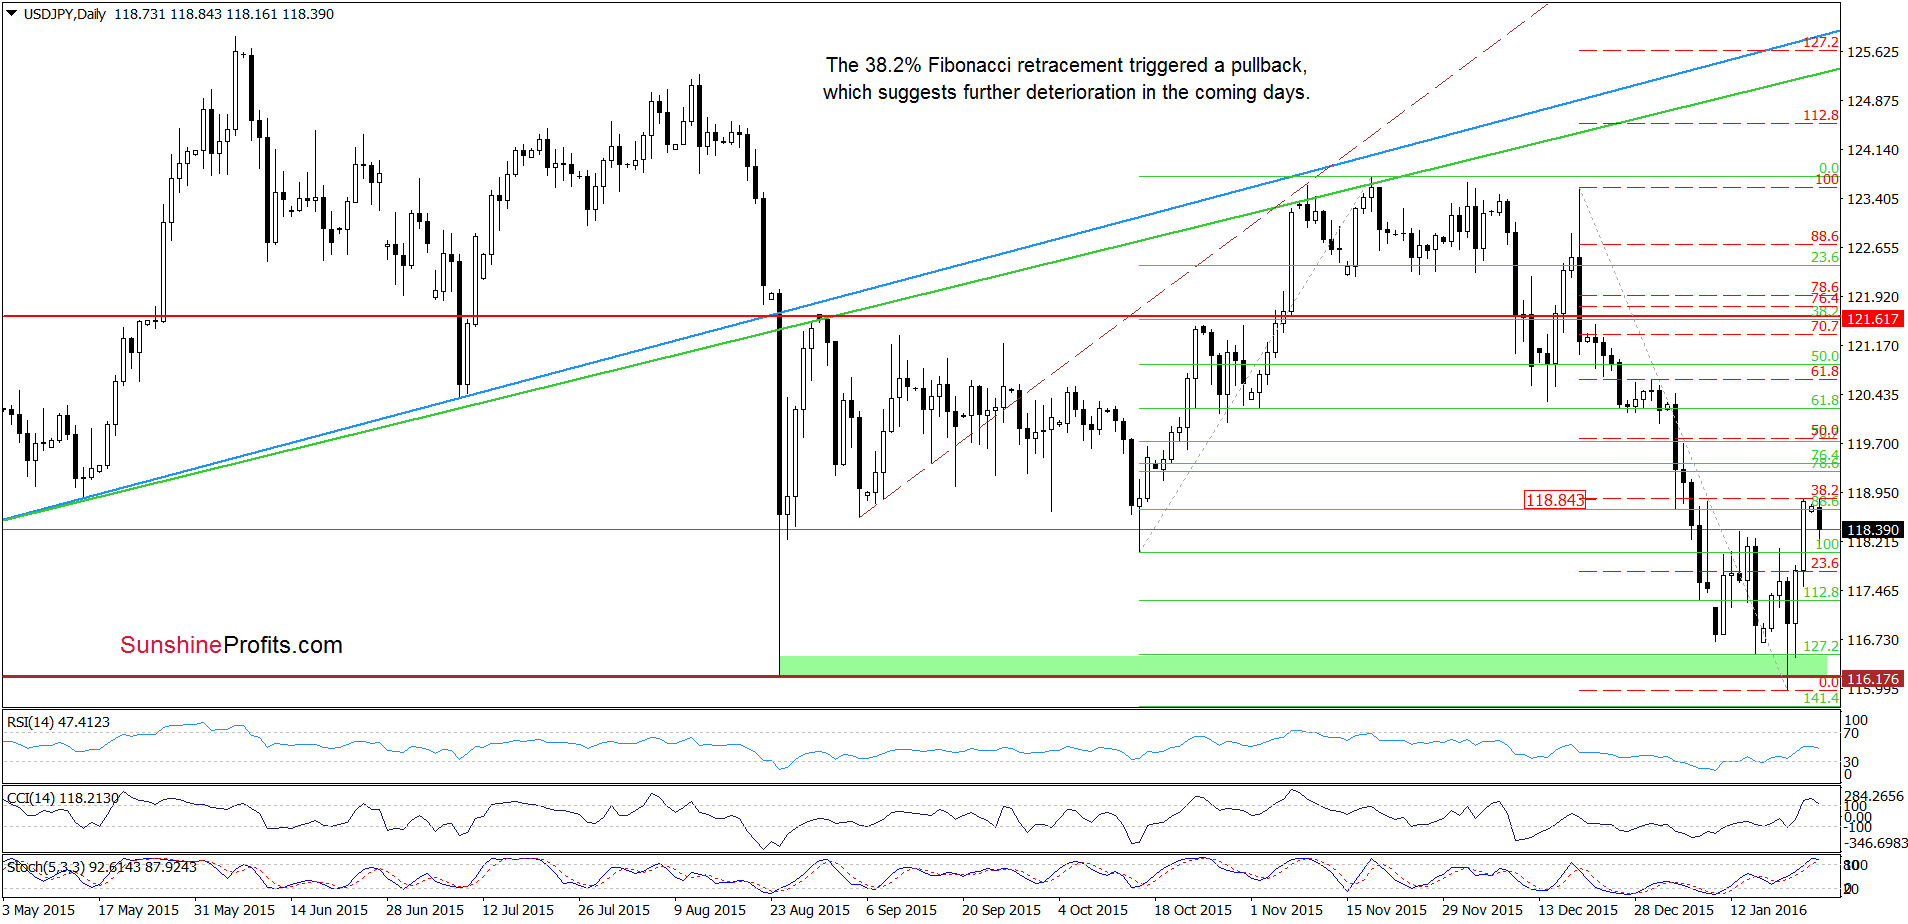
(…) although USD/JPY dropped under the green support line currency bulls managed to invalidate this breakdown very quickly, which resulted in an increase not only above the 23.6% Fibonacci retracement, but also approached the pair to the last week’s highs. Taking this fact into account and combining it with the current position of the indicators, we think that further improvement is just around the corner. If this is the case, and the exchange rate moves higher from here, the next upside target for currency bulls would be around 118.84, where the 38.2% Fibonacci retracement (based on the Dec-Jan decline) is.
From today’s point of view, we see that the situation developed in line with the above scenario and the exchange rate reached our target. As you see on the chart, the 38.2% Fibonacci retracement triggered a pullback earlier today, which in combination with the current position of the indicators (the CCI and Stochastic Oscillator are overbought and very close to generation sell signals) could result in a correction of the recent upward move in near future. If we see such price action, the initial downside target for currency bears would be around 117.75, where the 38.2% retracement (based on the last week’s increase) is.
Very short-term outlook: mixed with bearish bias
Short-term outlook: mixed
MT outlook: mixed
LT outlook: mixed
Trading position (short-term; our opinion): No positions are justified from the risk/reward perspective at the moment. We will keep you informed should anything change, or should we see a confirmation/invalidation of the above.
USD/CHF
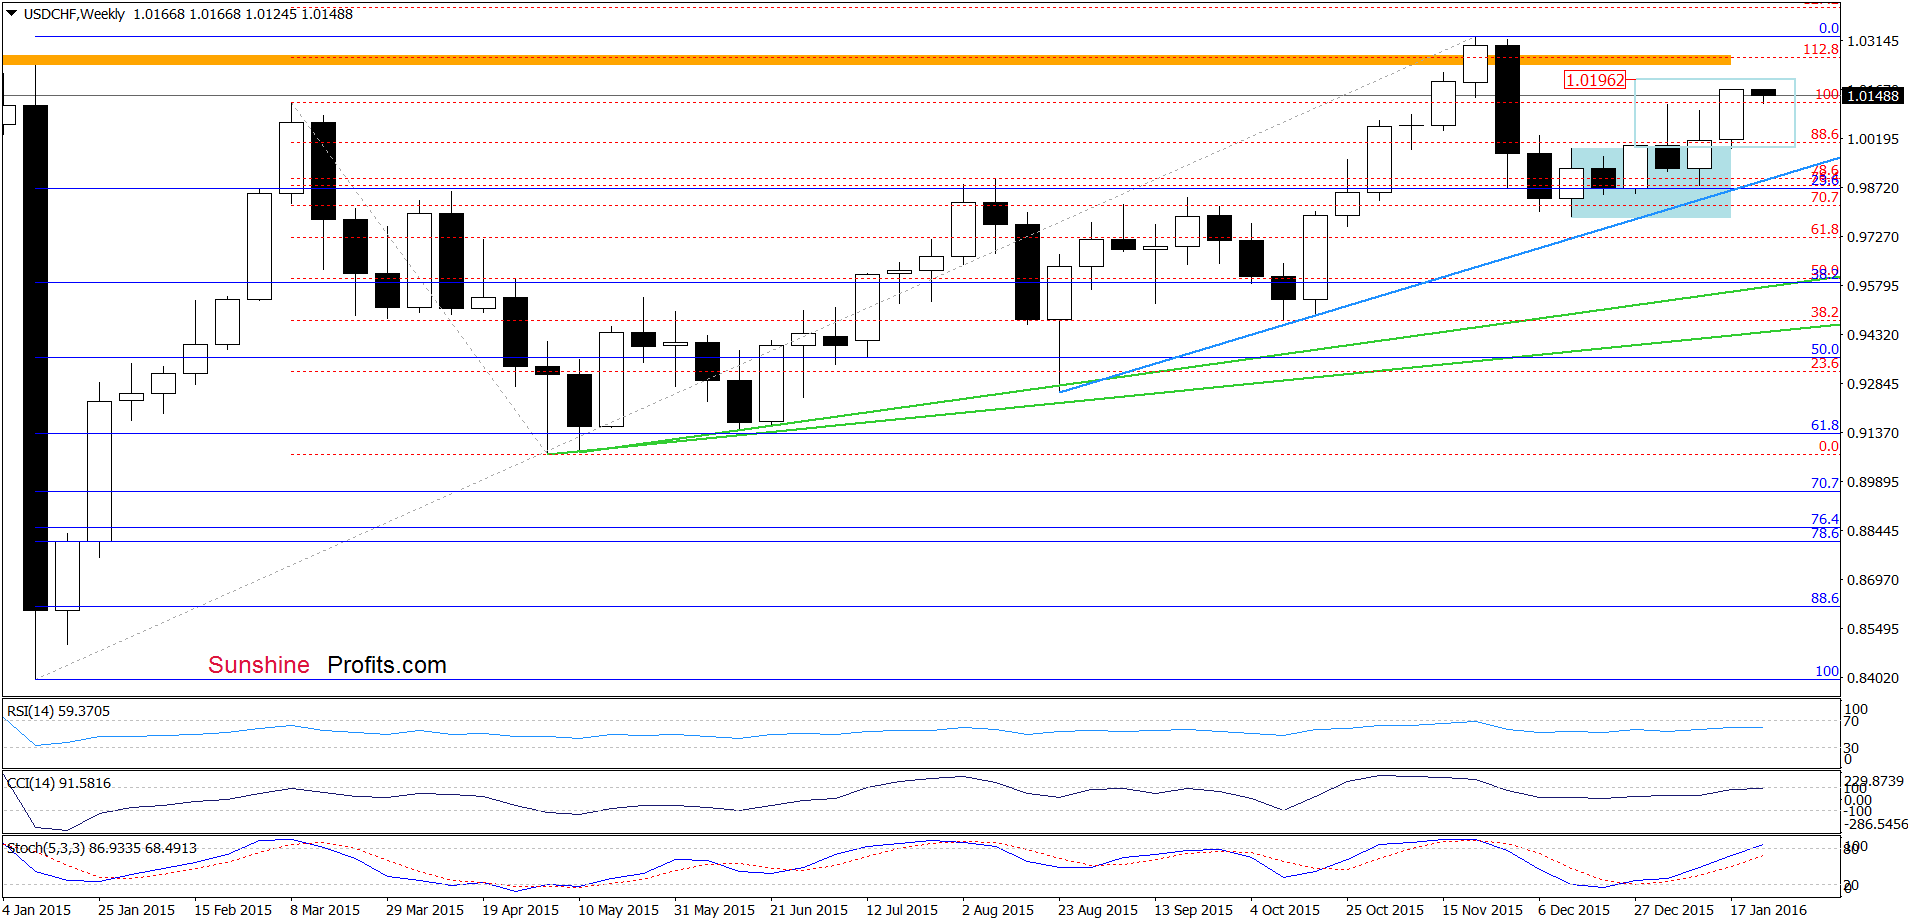
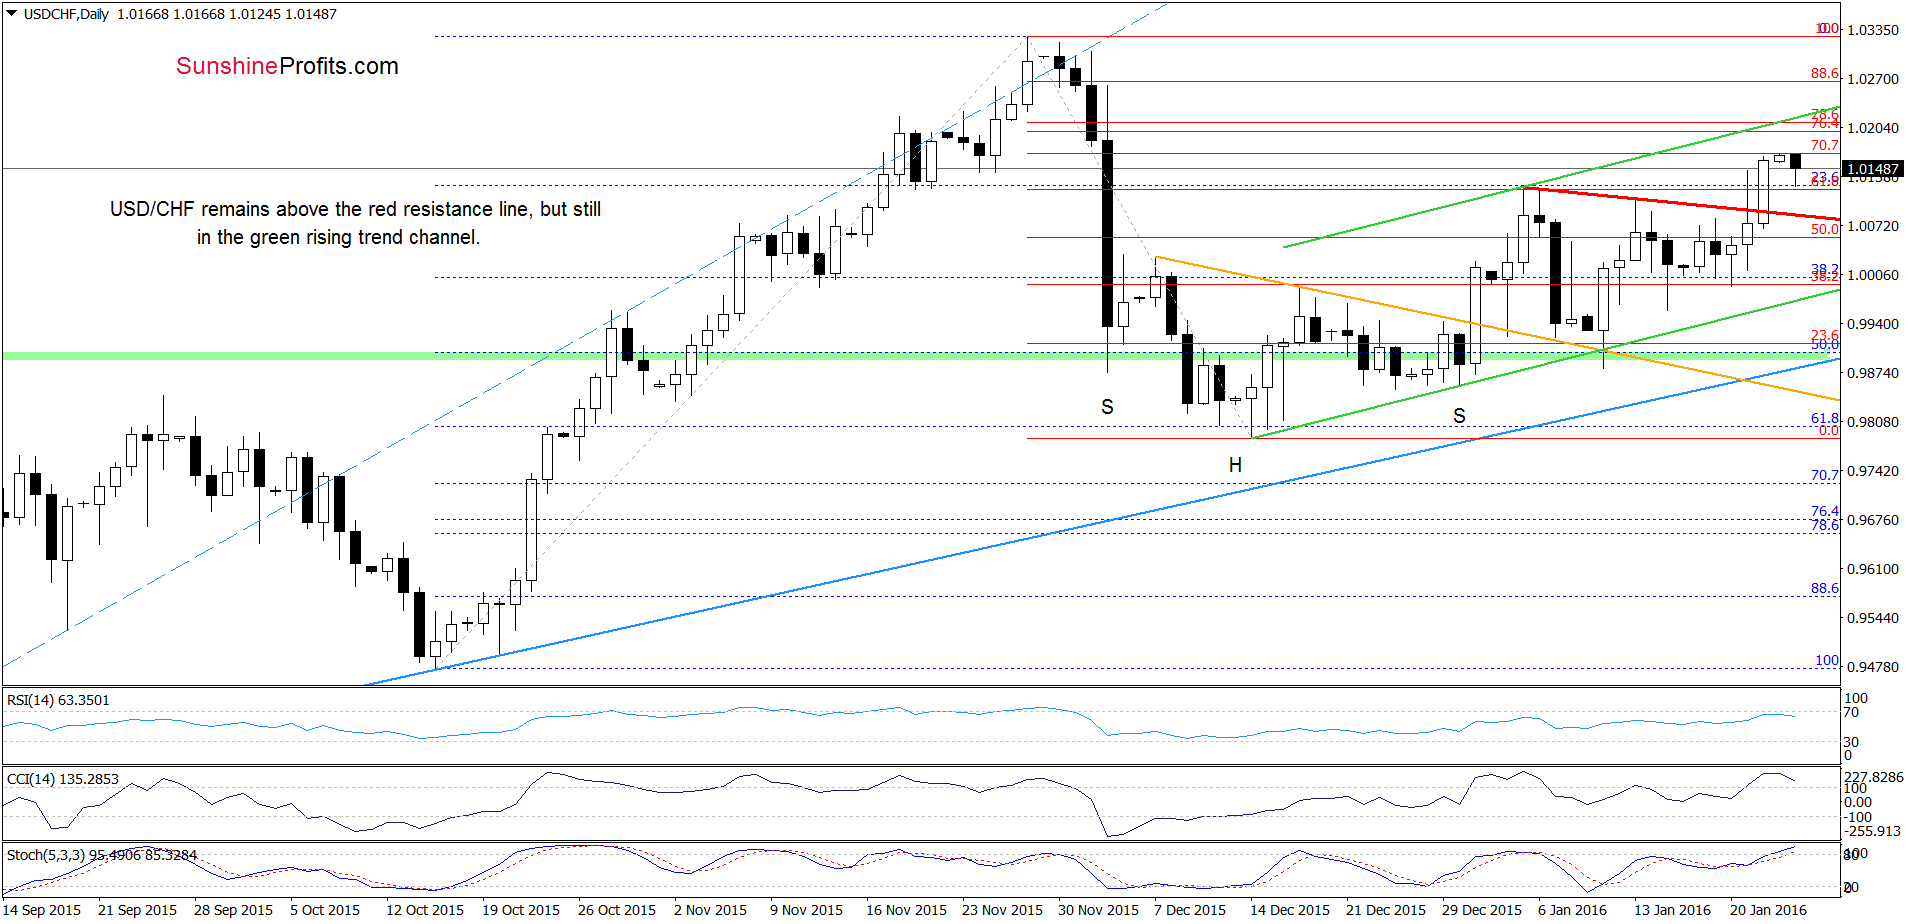
On the daily chart, we see that although USD/CHF gave up some gains earlier today, the pair remains above the previously-broken red declining line, which suggests that as long as there are no sell signals generated by the indicators, another attempt to move higher can’t be ruled out. Therefore, if we see an increase from here, the next upside target would be around 1.0196-1.0211, where the size of the upward move will correspond to the height of the blue consolidation (marked on the weekly chart) and where 76.4% and 78.6% Fibonacci retracements (based on the Nov-Dec declines) are.
Very short-term outlook: mixed
Short-term outlook: mixed
MT outlook: mixed
LT outlook: mixed
Trading position (short-term; our opinion): No positions are justified from the risk/reward perspective at the moment. We will keep you informed should anything change, or should we see a confirmation/invalidation of the above.
Thank you.
Nadia Simmons
Forex & Oil Trading Strategist
Przemyslaw Radomski, CFA
Founder, Editor-in-chief
Gold & Silver Trading Alerts
Forex Trading Alerts
Oil Investment Updates
Oil Trading Alerts

