

Earlier today, EUR/USD extended losses as increasing expectations that the European Central Bank will scale up its monetary easing program next month continue to weigh on investors’ sentiment. In this environment, the exchange rate slipped to its lowest level since mid-April. How low could the pair go?
In our opinion the following forex trading positions are justified - summary:
- EUR/USD: short (stop-loss order at 1.1476; initial downside target around 1.0462)
- GBP/USD: none
- USD/JPY: none
- USD/CAD: none
- USD/CHF: none
- AUD/USD: none
EUR/USD
Quoting our Friday’s alert:
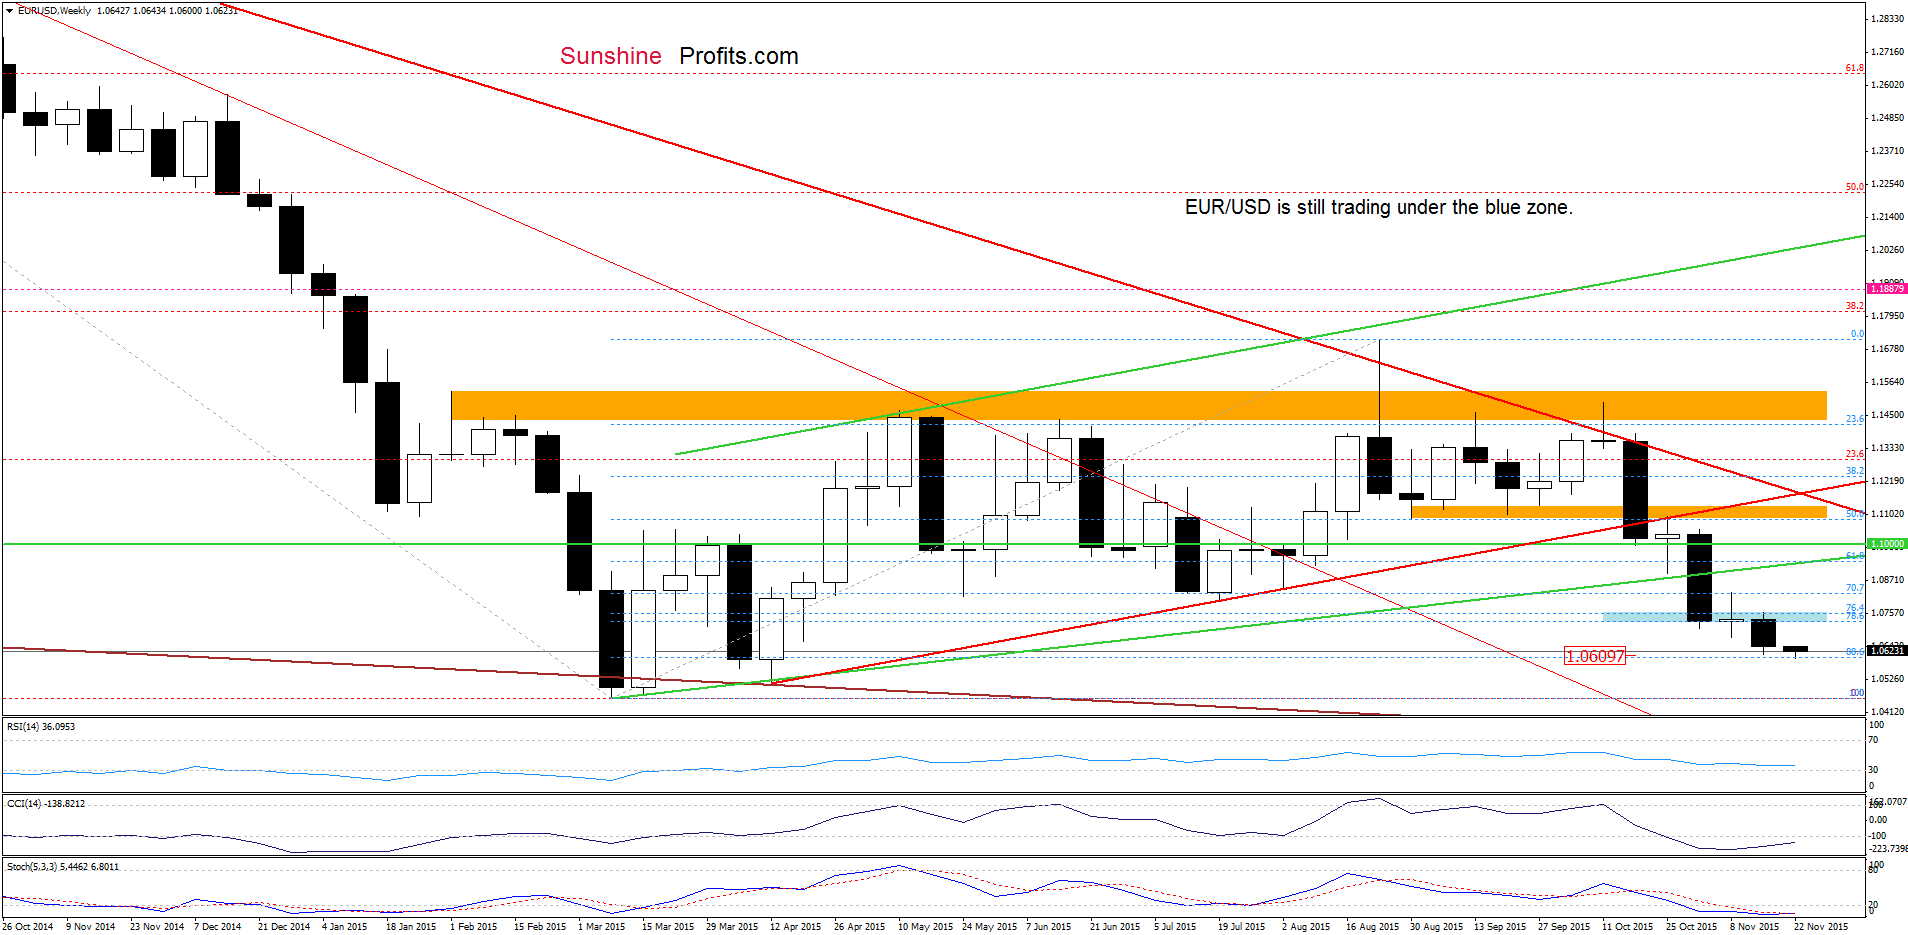
(…) the pair remains under the orange resistance zone and the upper border of the red declining trend channel. This suggests that as long as there is no breakout above this area, another attempt to move lower is very likely. If this is the case and the exchange rate reverses, we’ll see a test of yesterday’s low of 1.0615.
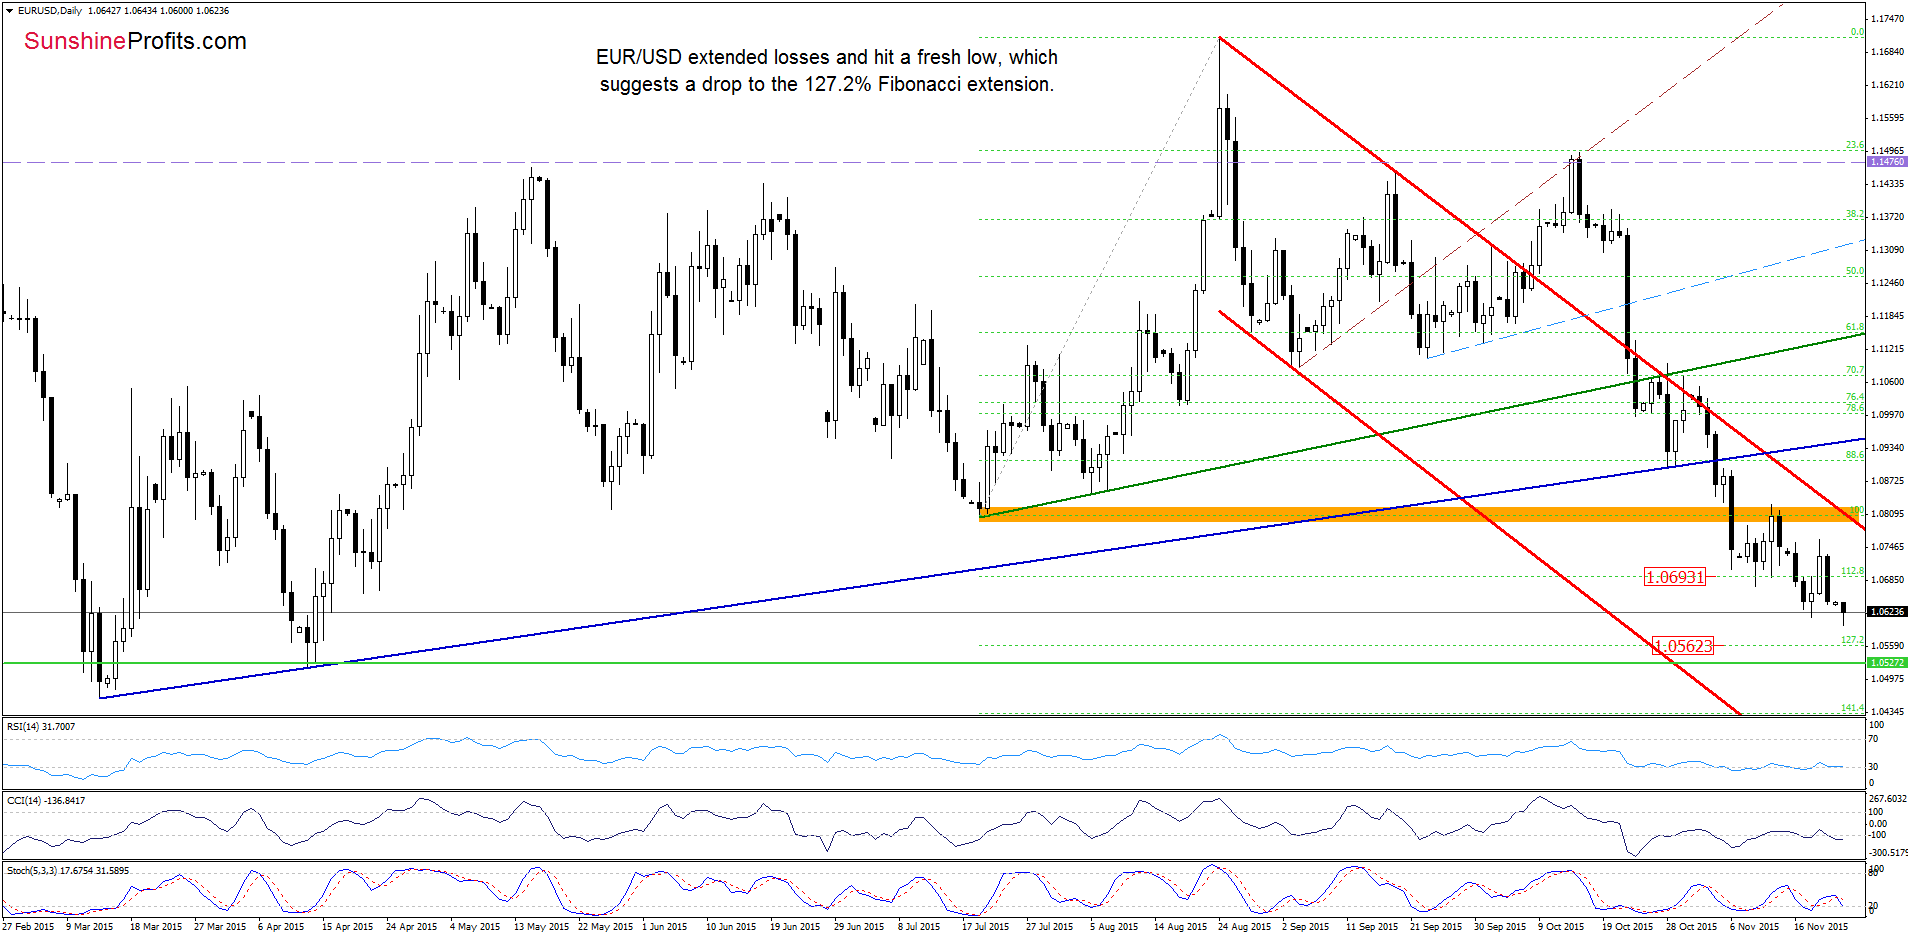
Looking at the daily charts, we see that the situation developed in line with the above scenario and EUR/USD extended losses. With today’s downswing the pair dropped under the last week’s low, which suggests that our next downside target from Friday’s commentary would be in play in the coming days:
(…) Please note that if this support is broken, the next downside target would be around 1.0562, where the 127.2% Fibonacci extension (based on the Jul-Aug rally) is.
Very short-term outlook: bearish
Short-term outlook: bearish
MT outlook: mixed with bearish bias
LT outlook: mixed
Trading position (short-term; our opinion): Short positions (which are profitable) with a stop-loss order at 1.1476 are justified from the risk/reward perspective. We will keep you informed should anything change, or should we see a confirmation/invalidation of the above.
GBP/USD
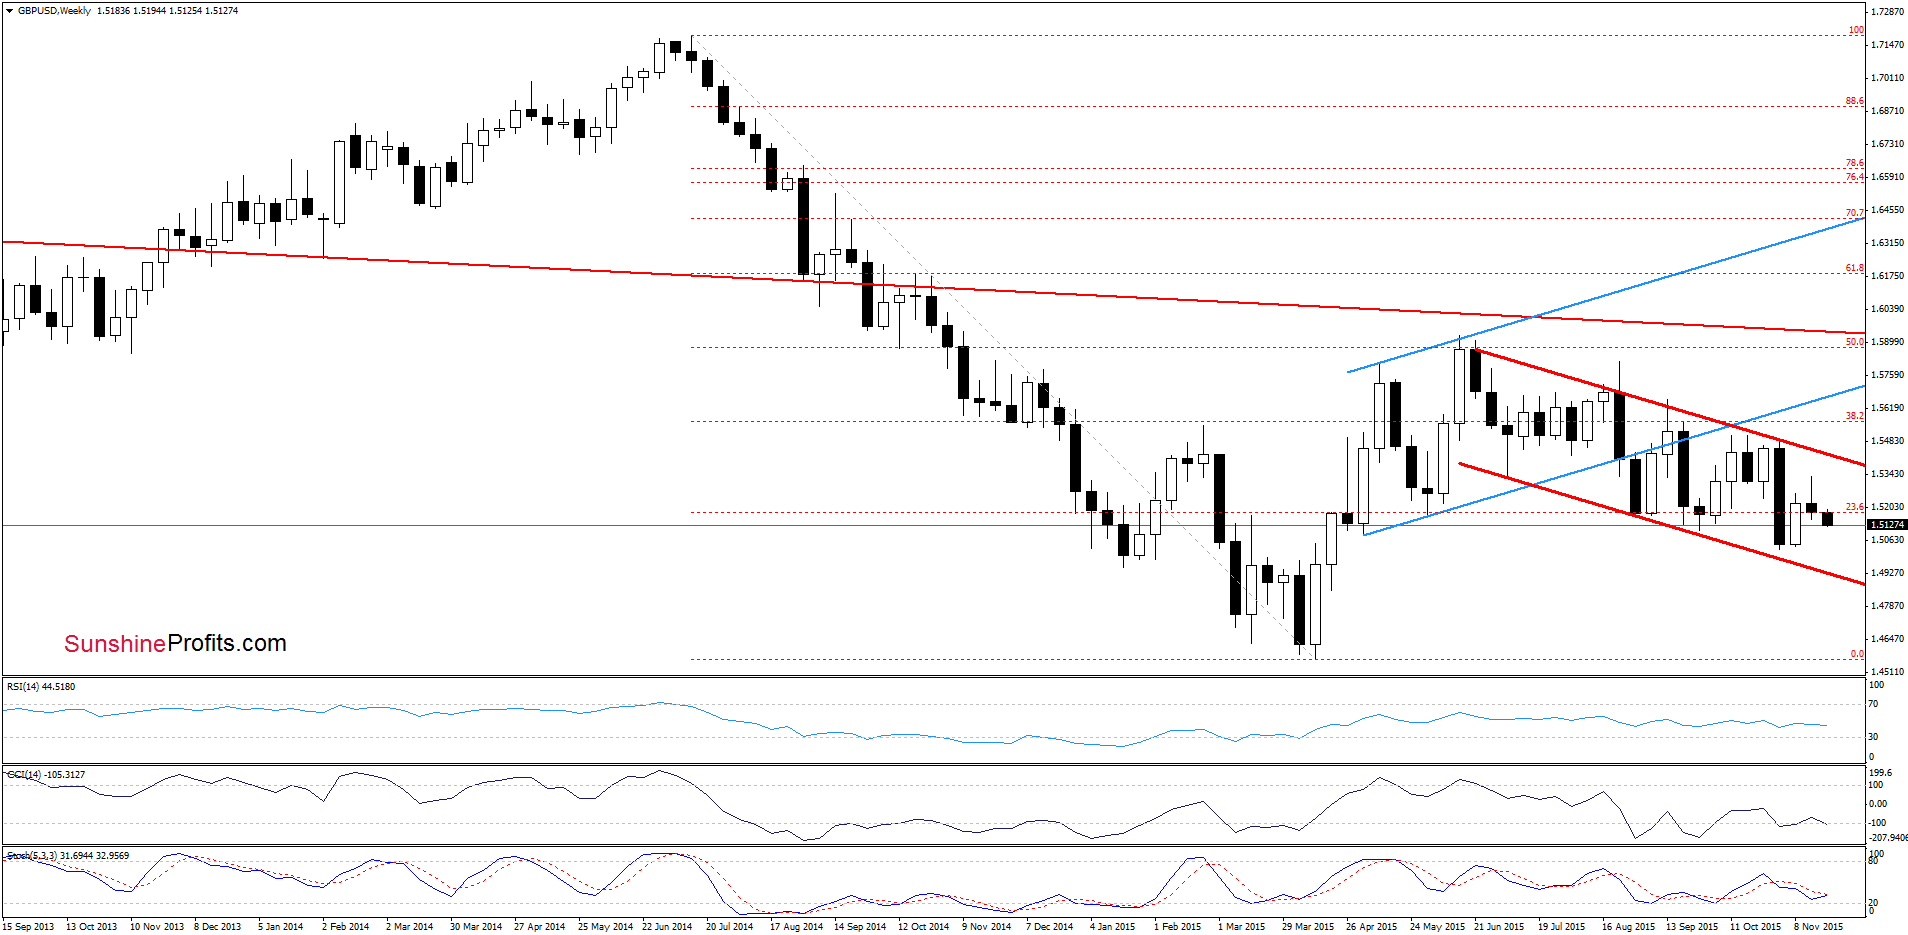
The medium-term picture remains almost unchanged as GBP/USD is trading in the red declining trend channel.
Will the daily chart give us more clues about future moves? Let’s check.
On Friday, we wrote the following:
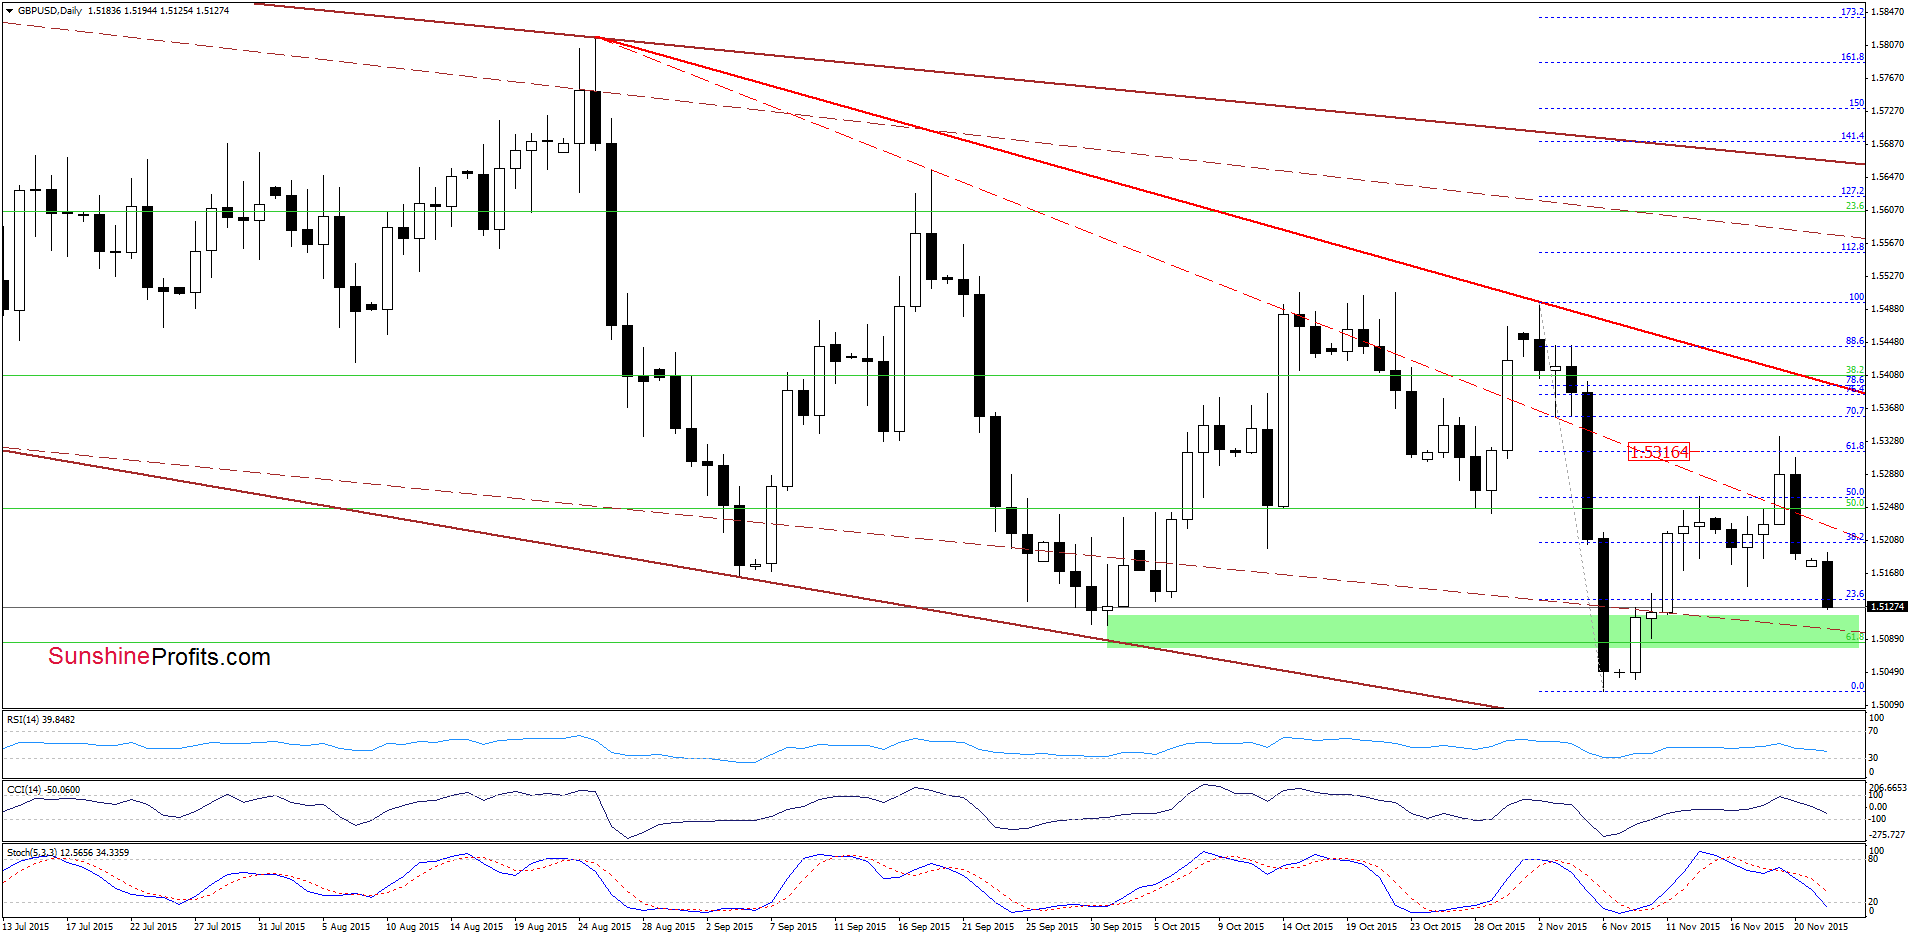
(…) although GBP/USD broke above red dashed resistance line yesterday, the 61.8% Fibonacci retracement triggered a pullback. With this downswing the exchange rate lipped to the previously-broken red line, which may be a verification of earlier breakout. However, the current position of the indicators suggests that further deterioration is just around the corner. Nevertheless, in our opinion, such price action will be more likely if we see a daily closure under the above-mentioned line. Please note that if GBP/USD extends losses, currency bears will likely push the pair to around 1.5153, where this week’s low is.
As you see on the daily chart currency bears pushed the pair lower as we had expected. With this downswing, GBP/USD broke below the last week’s low and approached the green support zone. Although the pair could rebound from here, the current position of the indicators (sell signals remain in place, supporting currency bears) suggests further deterioration and a test of the Nov lows in the coming week.
Very short-term outlook: mixed with bearish bias
Short-term outlook: mixed
MT outlook: mixed
LT outlook: mixed
Trading position (short-term; our opinion): No positions are justified from the risk/reward perspective at the moment. We will keep you informed should anything change, or should we see a confirmation/invalidation of the above.
AUD/USD
In our previous alert, we wrote:
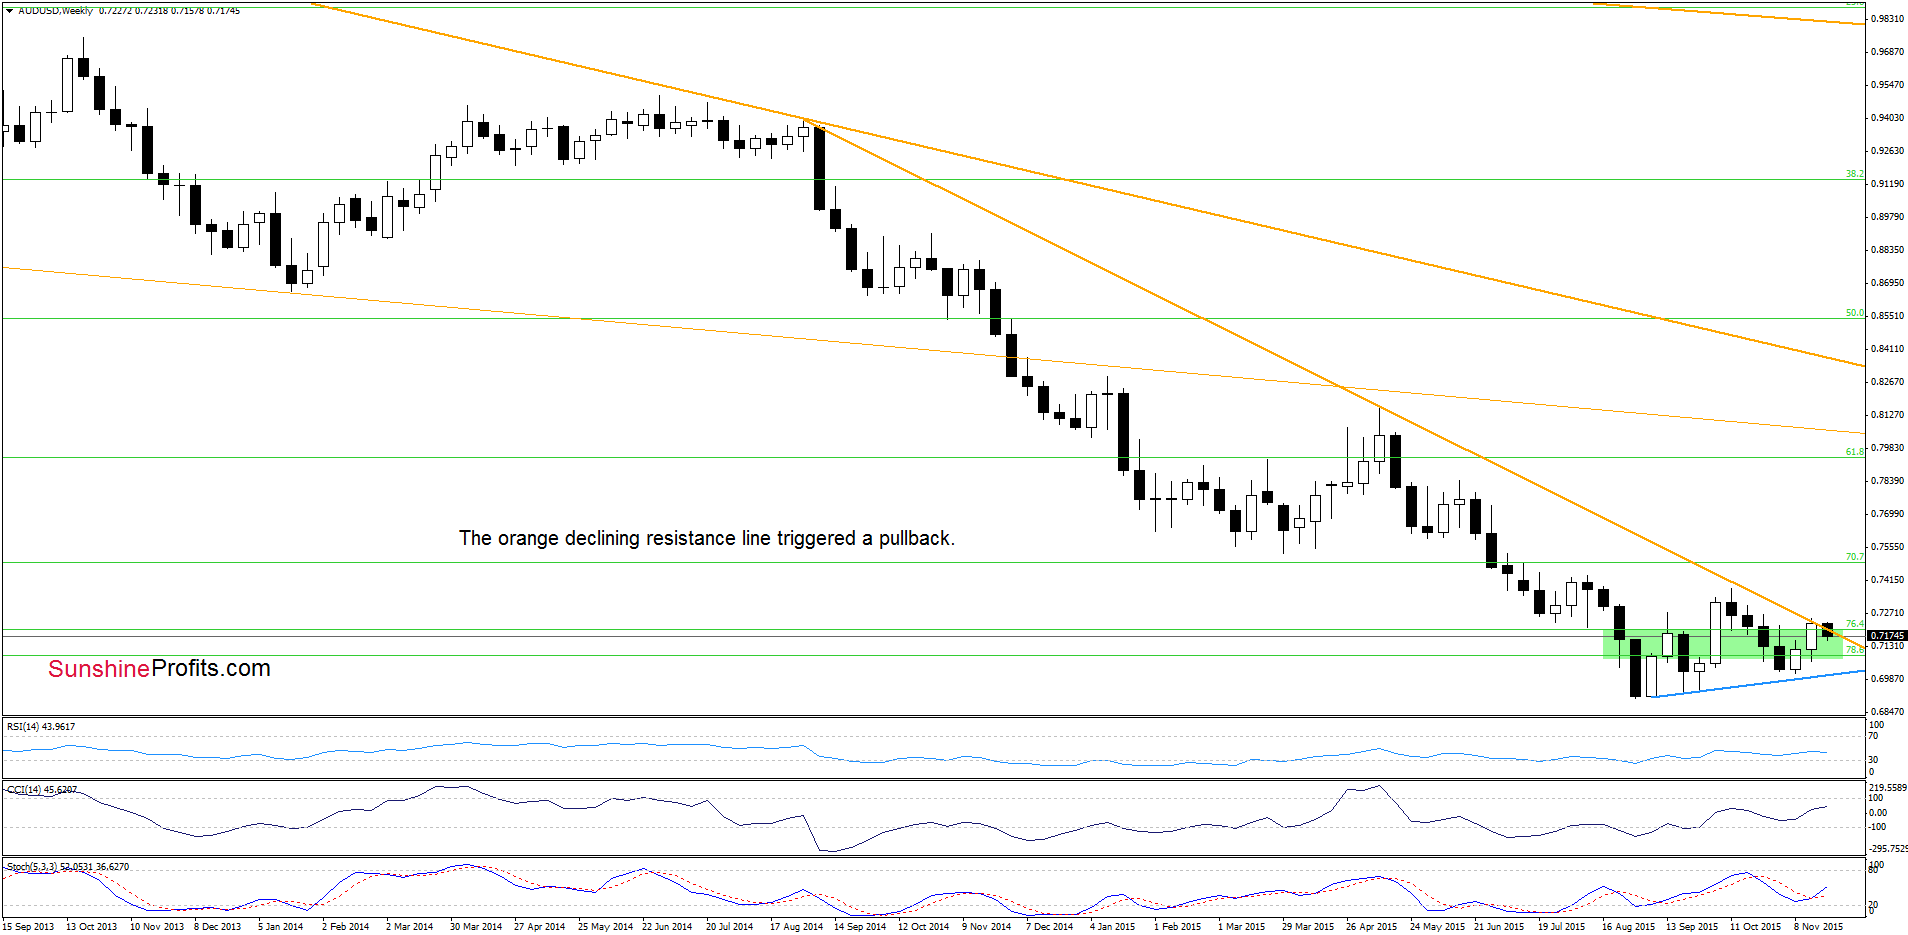
(…) AUD/USD approached the medium-term orange resistance line. Therefore, in our opinion, further rally will be likely only if we see a breakout above this line.
From today’s point of view we see that although the exchange rate climbed slightly above this key resistance line, currency bulls didn’t manage to hold gained levels, which resulted in a pullback.
What impact did this drop have on the very short-term picture? Let’s check.
Quoting our Friday’s alert:
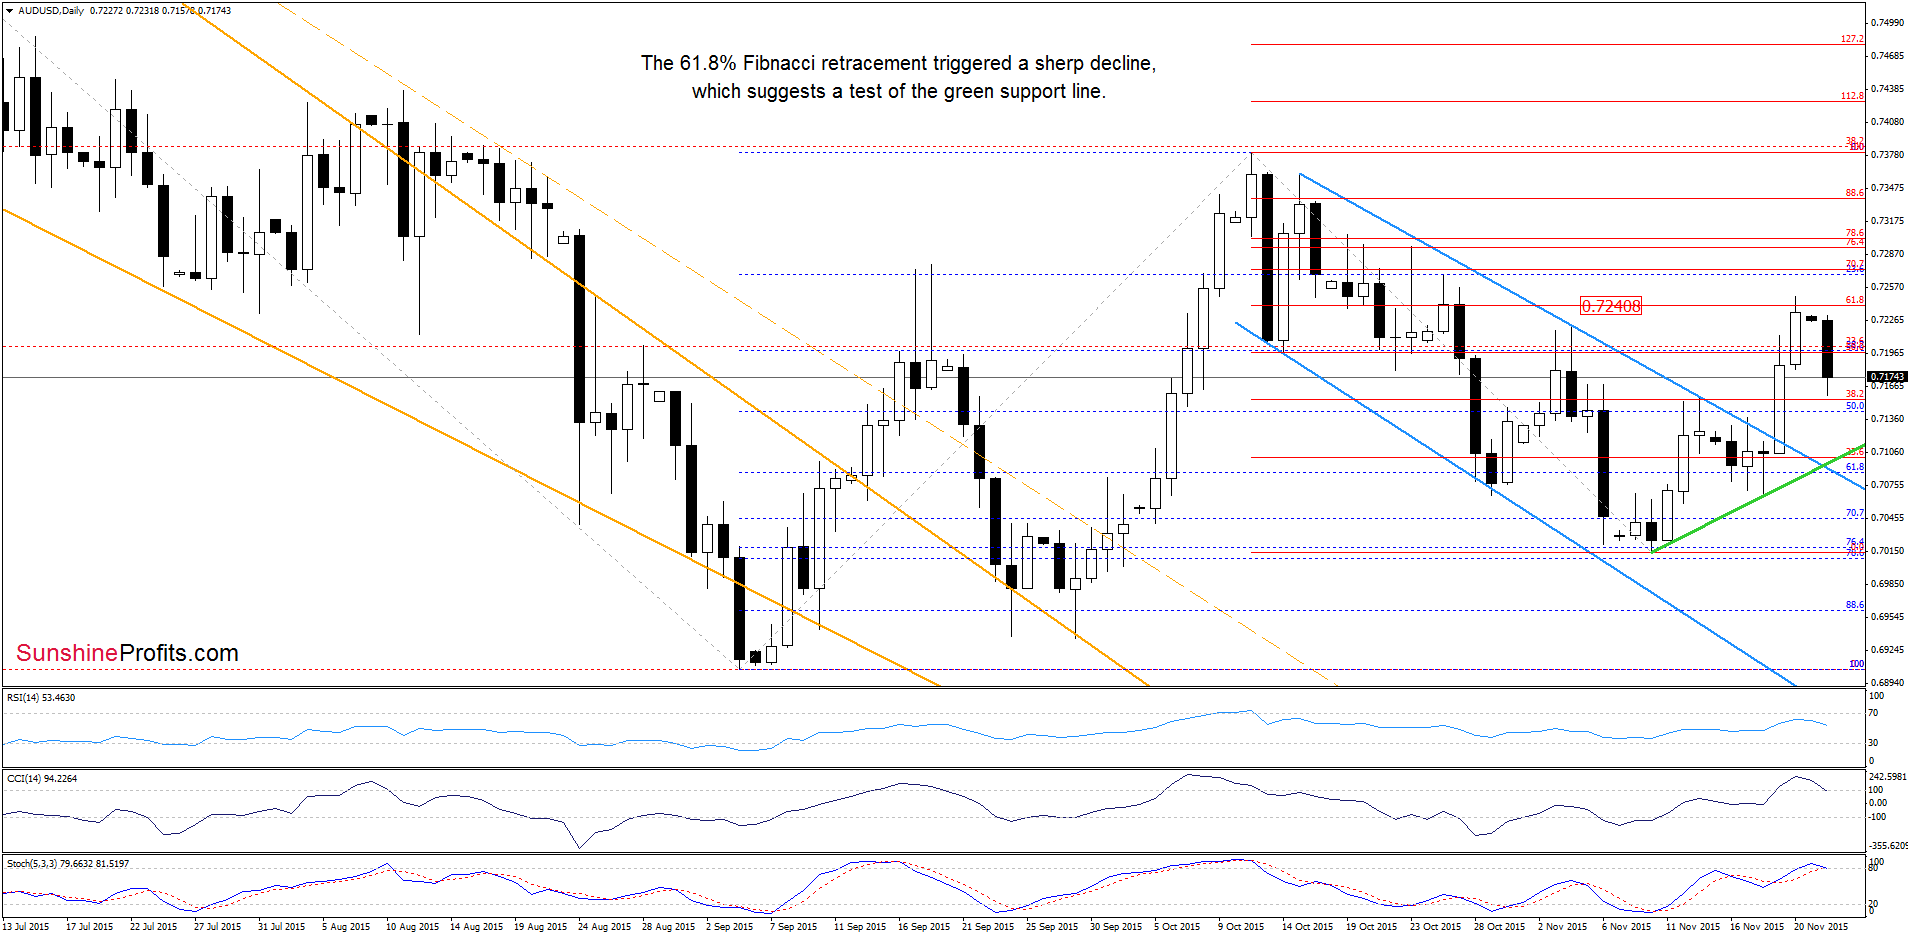
(…) a breakout above the upper border of the declining blue trend channel. This positive signal encouraged currency bulls to act, which resulted in a rally to (…) the previous highs and the 50% Fibonacci retracement. Although the pair could pull back from here, the current position of the indicators (buy signals remain in place) suggests further improvement. If this is the case, and AUD/USD moves higher from here, the initial upside target would be the 61.8% retracement.
As you see on the daily chart, although AUD/USD reached our upside target, currency bulls didn’t manage to push the pair higher, which resulted in a correction of the previous upward move. Taking into account today’s sharp decline and the current position of the indicators (they are very close to generating sell signals), it seems to us that further deterioration is just around the corner. In our opinion, if the exchange rate extends losses, the initial downside target for currency bears would br the green support line based on the previous lows.
Very short-term outlook: mixed with bearish bias
Short-term outlook: mixed
MT outlook: mixed
LT outlook: mixed
Trading position (short-term; our opinion): No positions are justified from the risk/reward perspective at the moment. We will keep you informed should anything change, or should we see a confirmation/invalidation of the above.
Thank you.
Nadia Simmons
Forex & Oil Trading Strategist
Przemyslaw Radomski, CFA
Founder, Editor-in-chief
Gold & Silver Trading Alerts
Forex Trading Alerts
Oil Investment Updates
Oil Trading Alerts

