

Earlier today, the U.S. Labor Department showed the economy added 271.000 jobs in the previous month, beating expectations for a 180.000 rise. Additionally, the U.S. unemployment rate dropped to 5.0% in October from 5.1% the previous month. On top of that, the report also showed that average hourly earnings rose 0.4% last month, also beating forecasts for a 0.2% gain. Thanks to these bullish numbers, the USD Index rallied to a six-month high and climbed above 99. What impact did this sharp rally have on our six currency pairs?
In our opinion the following forex trading positions are justified - summary:
- EUR/USD: short (stop-loss order at 1.1476; initial downside target around 1.0462)
- GBP/USD: none
- USD/JPY: none
- USD/CAD: none
- USD/CHF: none
- AUD/USD: none
EUR/USD
Yesterday, we wrote the following:
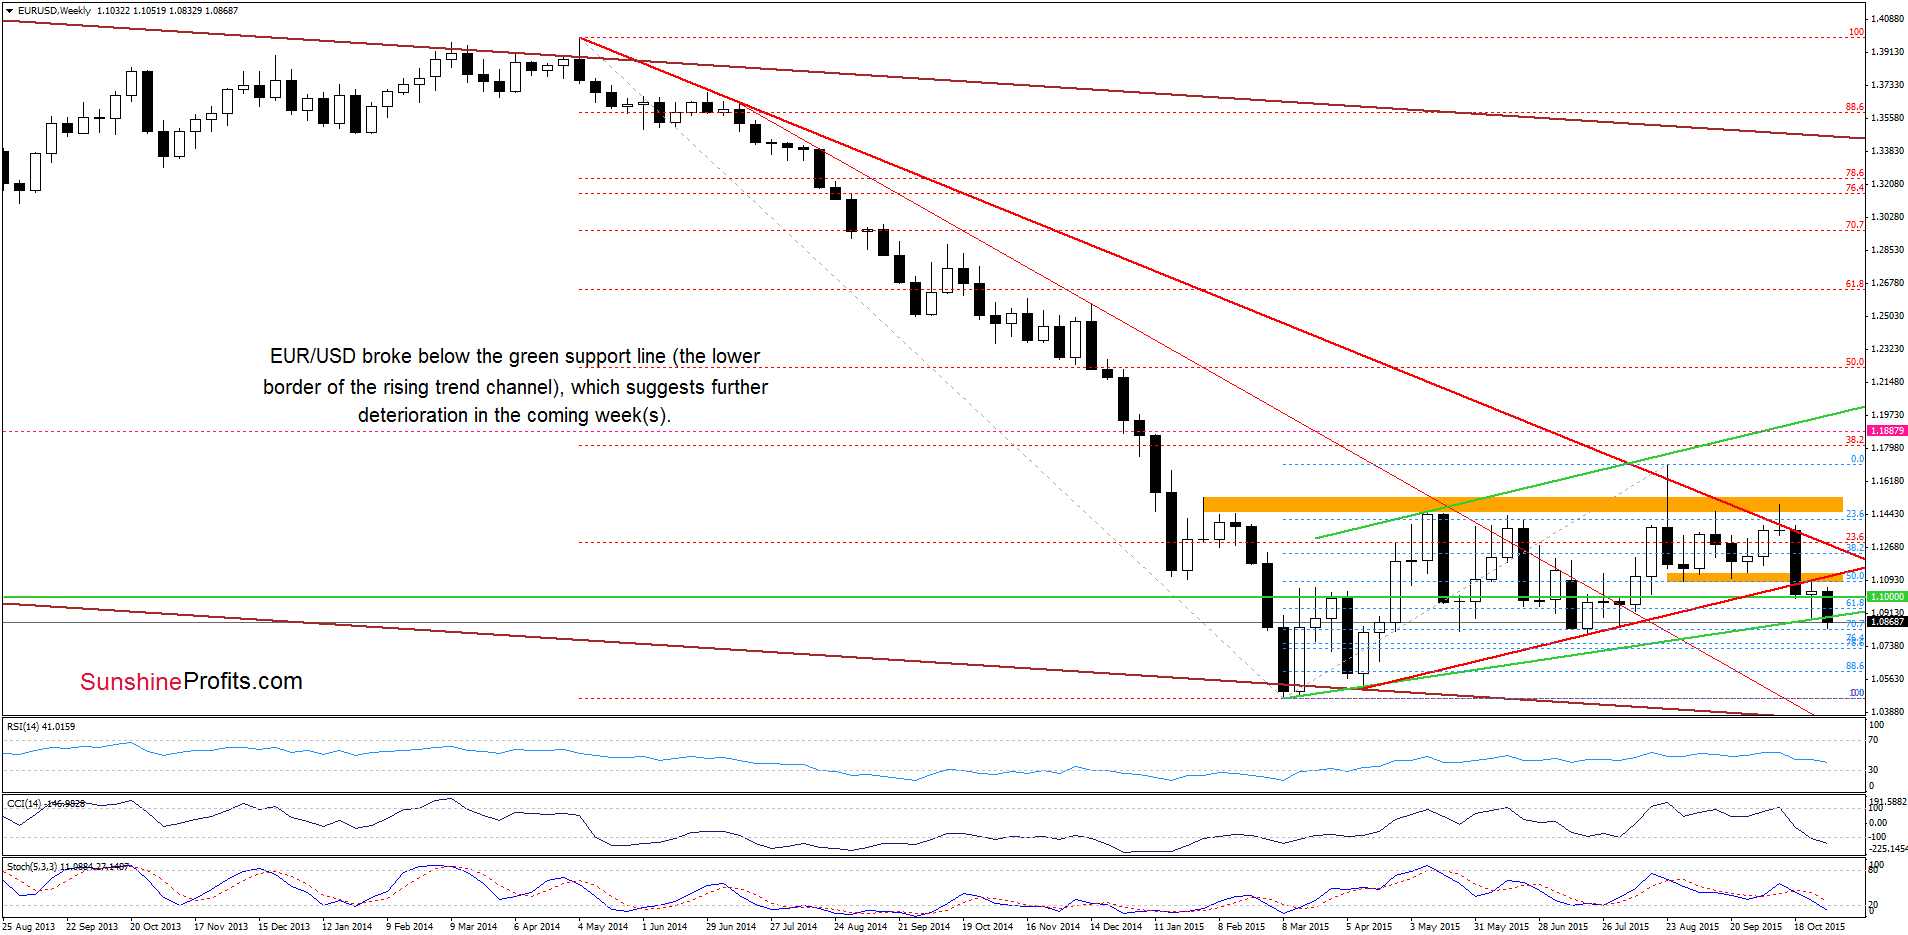
(…) If (…) EUR/USD declines below the above-mentioned key support line, it would be a strong negative signal, which will trigger a drop to the green support zone based on Jul lows (around 1.0808-1.0821) in the coming days (…) please note that if the above-mentioned support area doesn’t stop currency bears, the next downside target would be around 1.0730-1.0757, where the support zone created by the 76.4% and 78.6% Fibonacci retracement levels (based on the March-Aug rally) is.
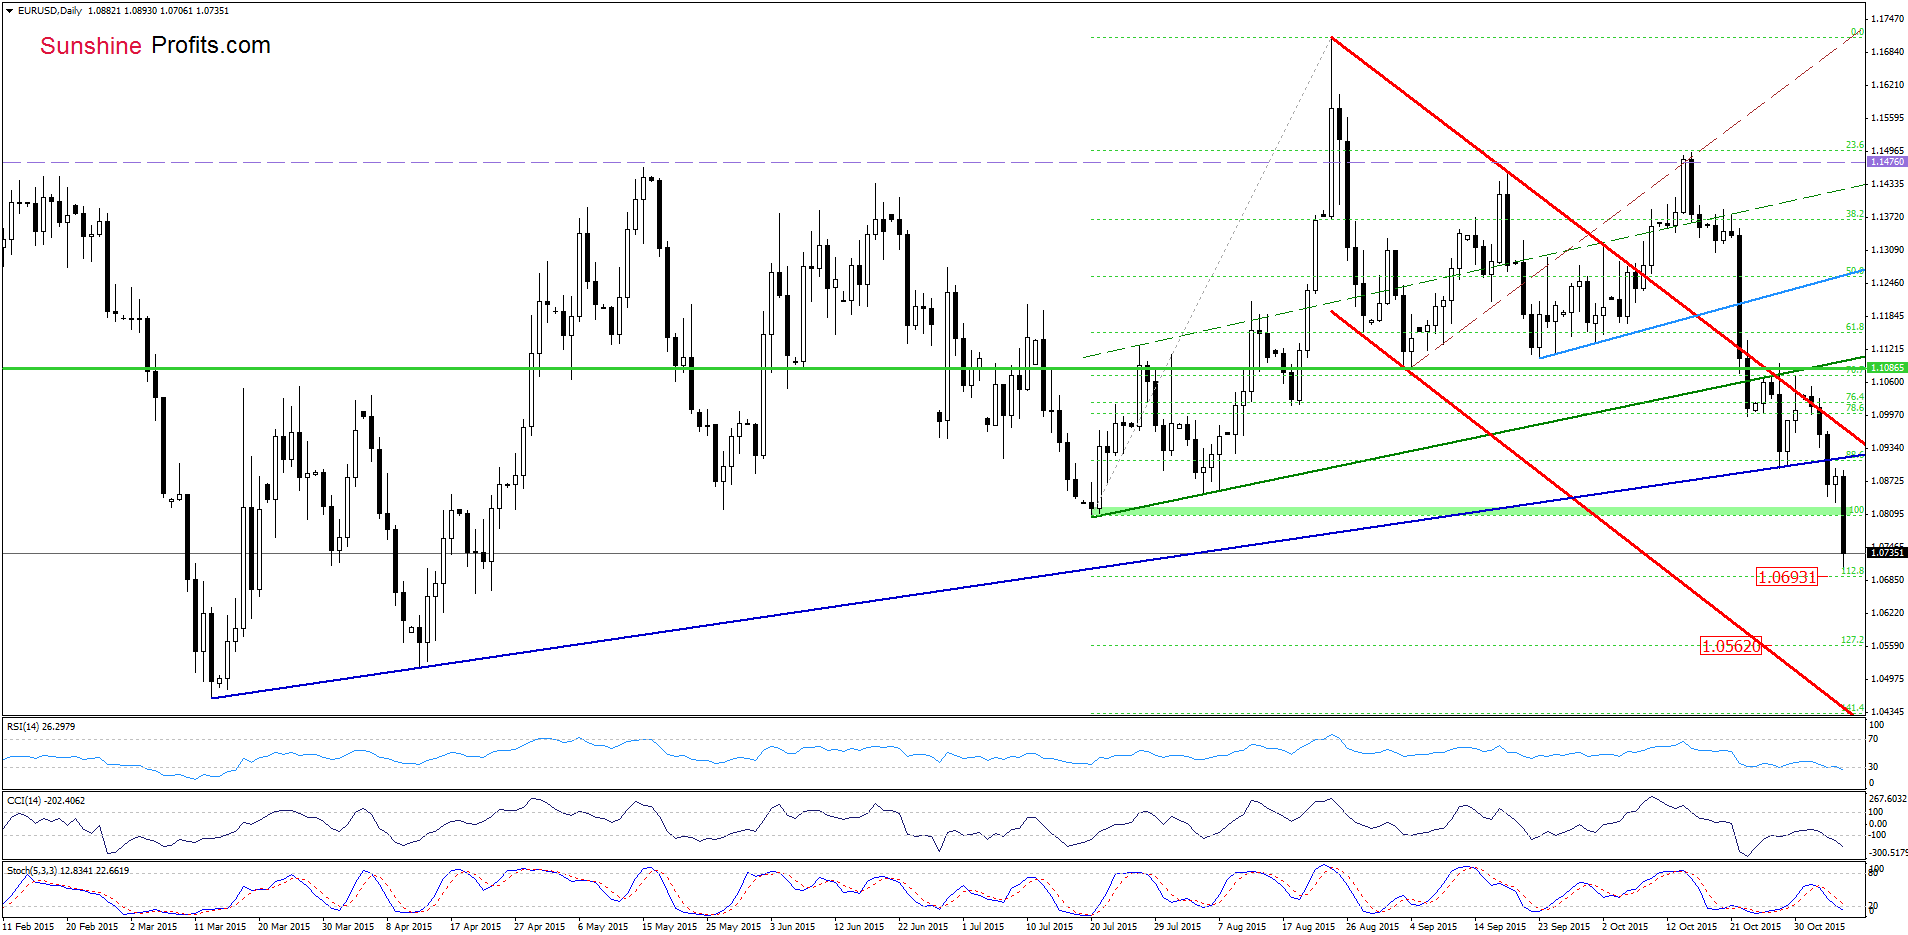
Looking at the charts, we see that the situation developed in line with the above scenario and EUR/USD reached our next downside target earlier today. Taking this sharp drop into account, and combining it with sell signals generated by the indicators, we believe that another attempt to move lower is very likely. If this is the case, and the pair extends losses, we may see a decline to 1.0609, where the 88.6% Fibonacci retracement (marked on the weekly chart) is.
Very short-term outlook: bearish
Short-term outlook: bearish
MT outlook: mixed with bearish bias
LT outlook: mixed
Trading position (short-term; our opinion): Short positions (which are profitable) with a stop-loss order at 1.1476 are justified from the risk/reward perspective. We will keep you informed should anything change, or should we see a confirmation/invalidation of the above.
GBP/USD
On Wednesday, we wrote the following:
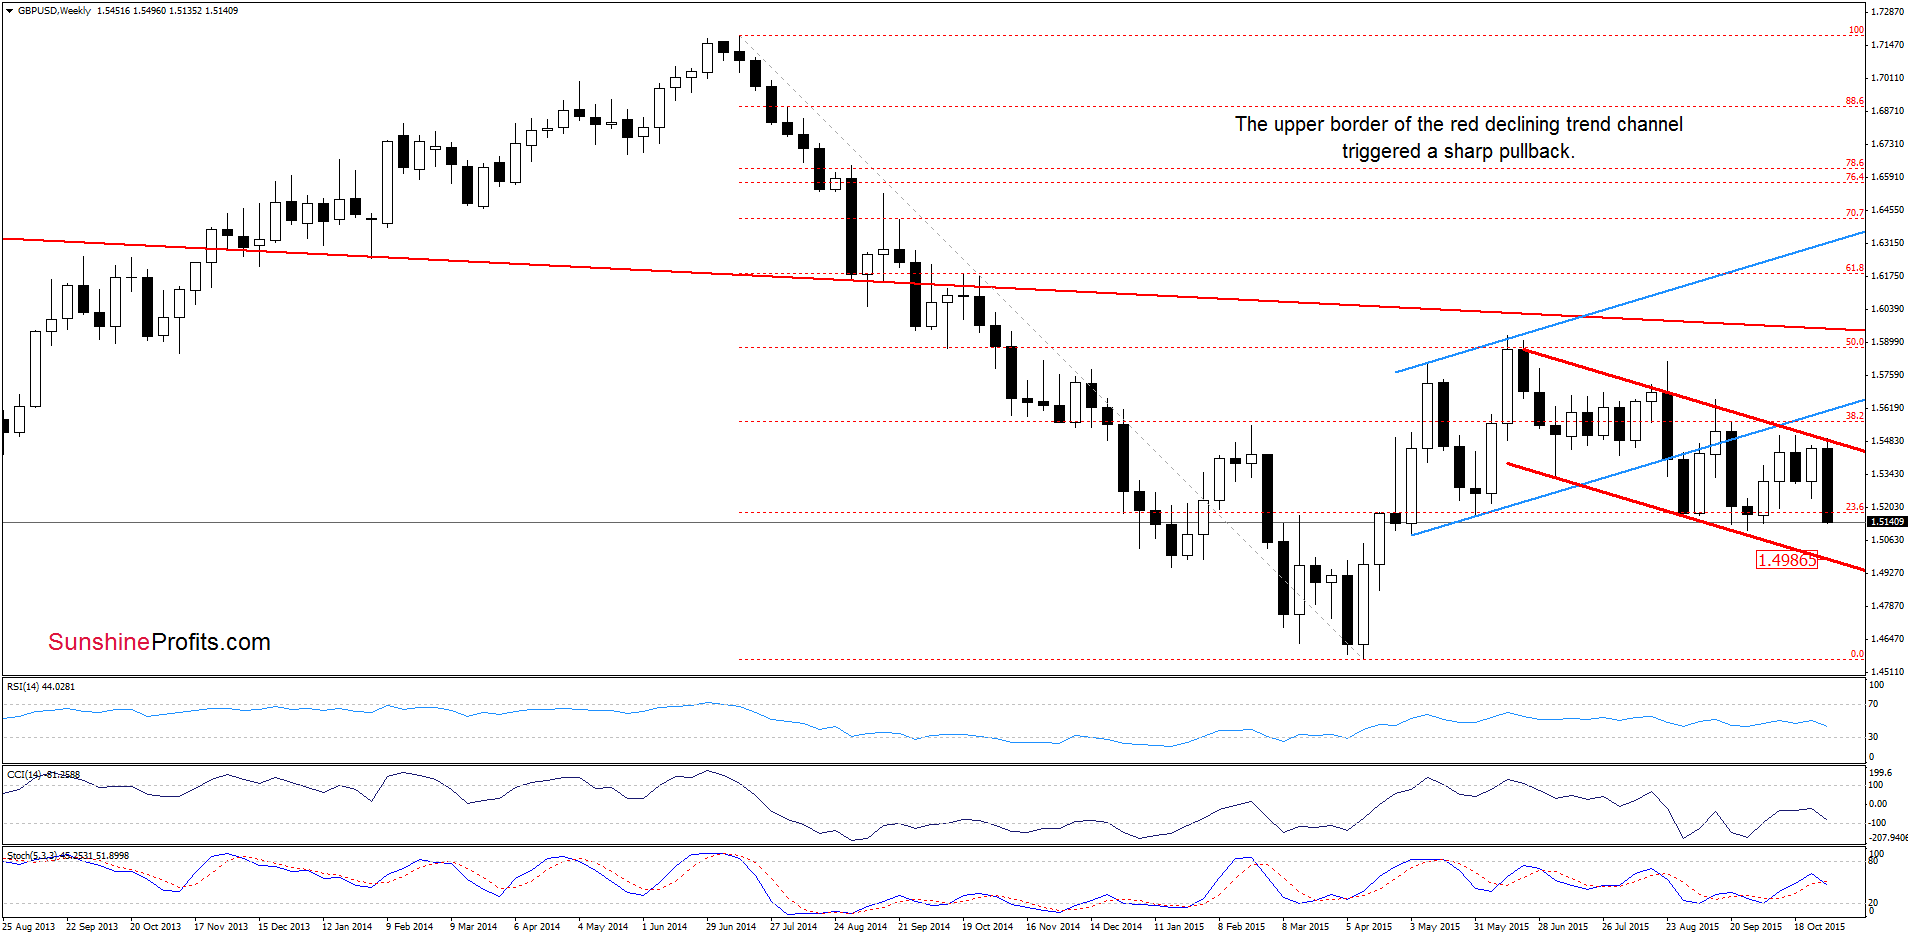
(…) the proximity to the key resistance area and a sell signal generated by the Stochastic Oscillator suggest that another pullback and a re-test of the red line is more likely than not.
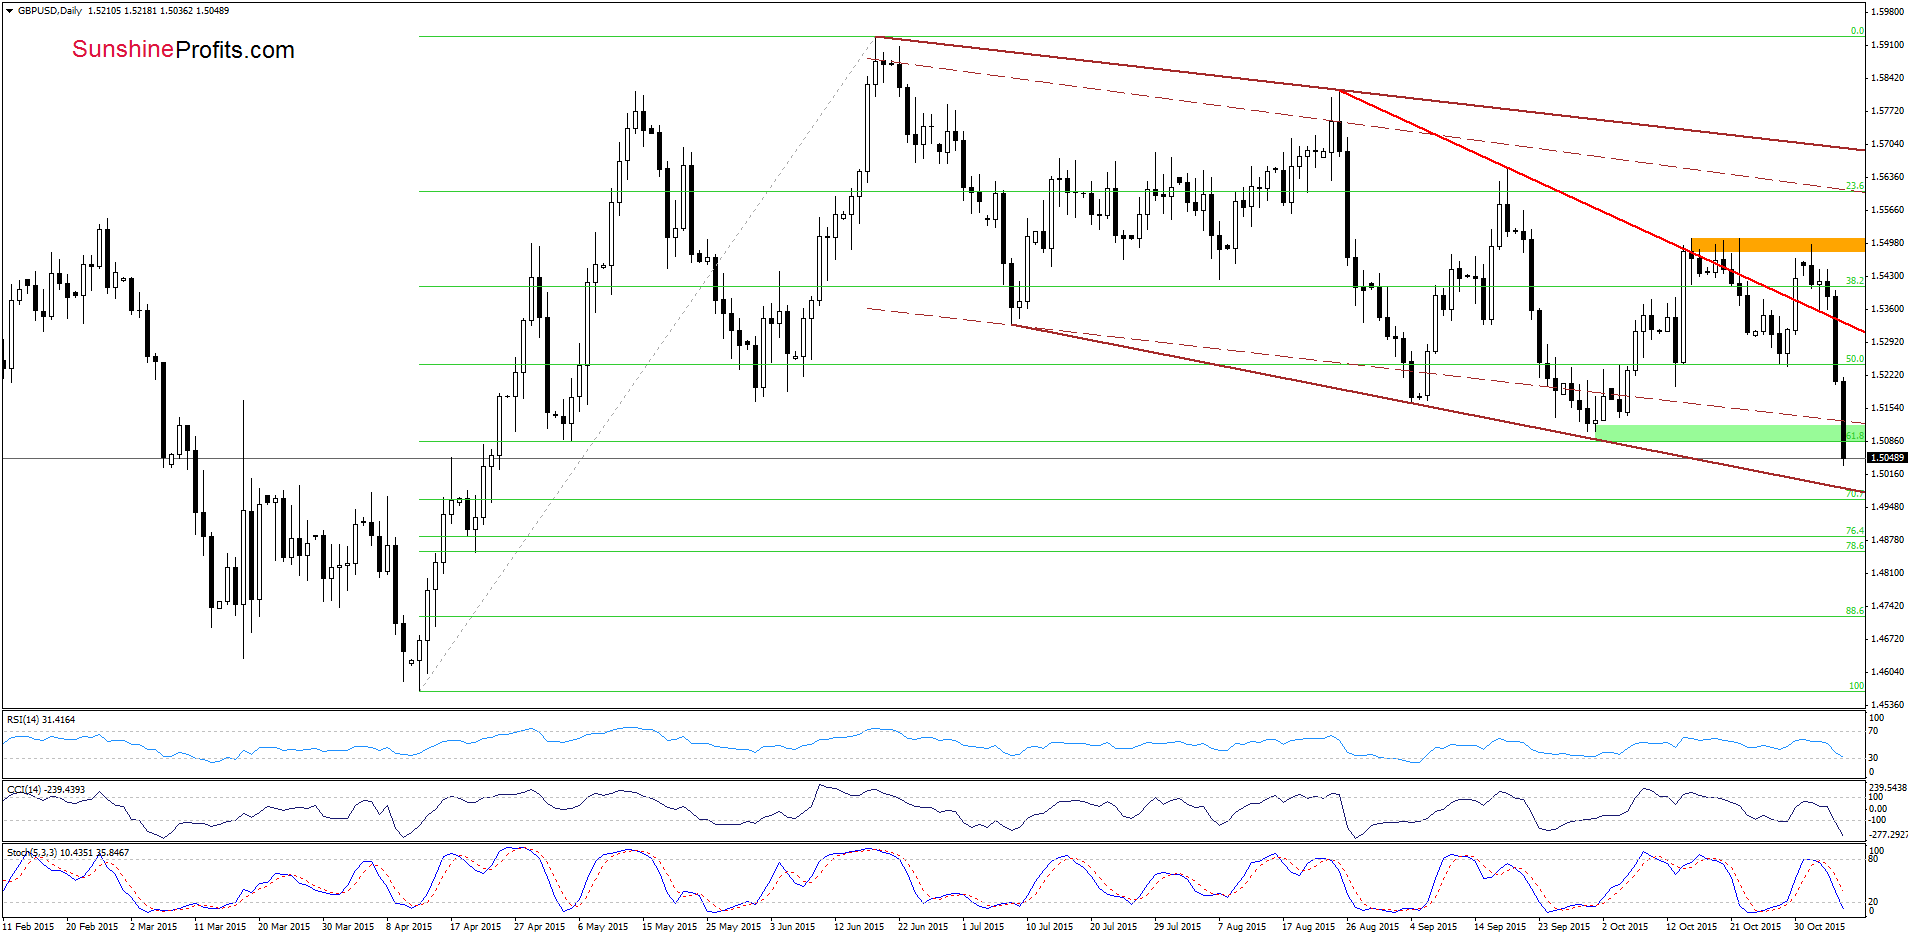
As you see on the charts, currency bears not only took the pair to the red line but also pushed GBP/USD below it, which triggered a sharp decline. With this downward move, the exchange rate slipped to the lower border of the brown declining trend channel and the green support zone, but as you see, currency bears broke below them, which suggests that we’ll see a test of the brown support line based on the previous lows in the coming days.
Very short-term outlook: mixed with bearish bias
Short-term outlook: mixed
MT outlook: mixed
LT outlook: mixed
Trading position (short-term; our opinion): No positions are justified from the risk/reward perspective at the moment. We will keep you informed should anything change, or should we see a confirmation/invalidation of the above.
USD/JPY
Quoting our yesterday’s alert:
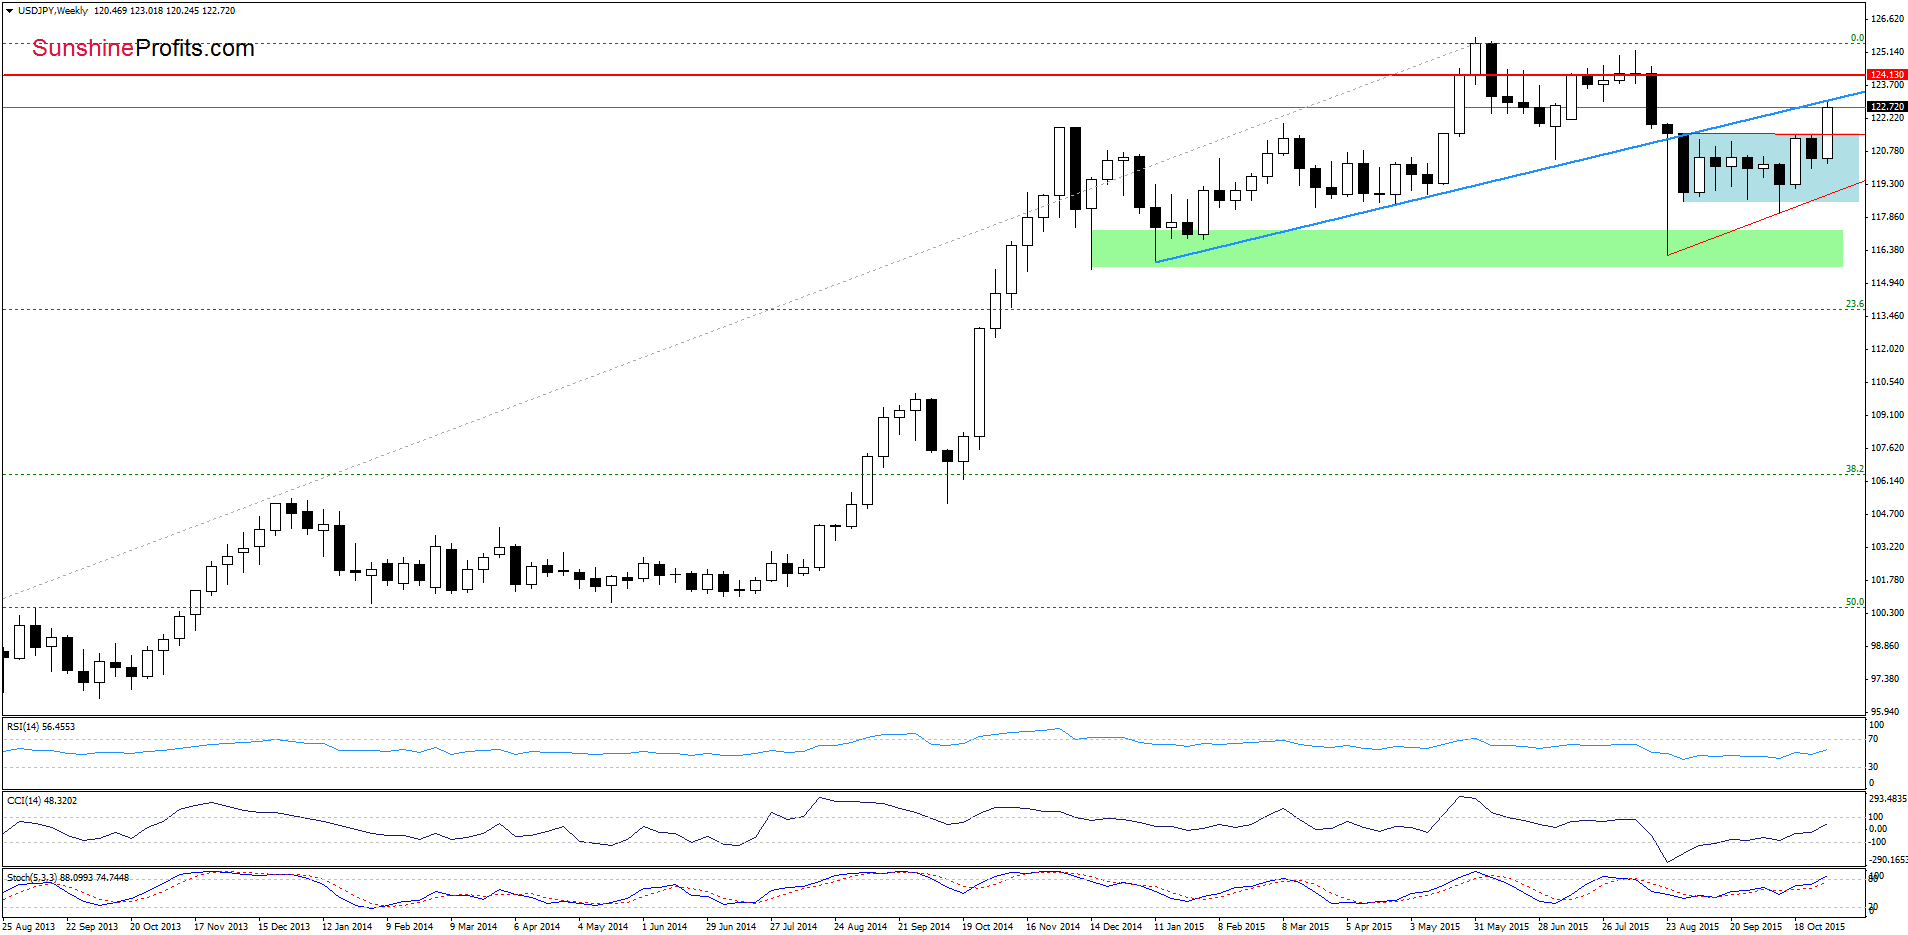
(…) USD/JPY reached the upper border of the consolidation. If currency bulls manage to push the pair above it, we may see a test of the blue resistance line in the coming weeks.
The first thing that catches the eye on the weekly chart is a breakout above the upper border of the consolidation. This positive signal, triggered further improvement and USD/JPY approached our upside target - the blue resistance line.
What’s next? Let’s take a look at the daily chart and find out what can we infer from it.
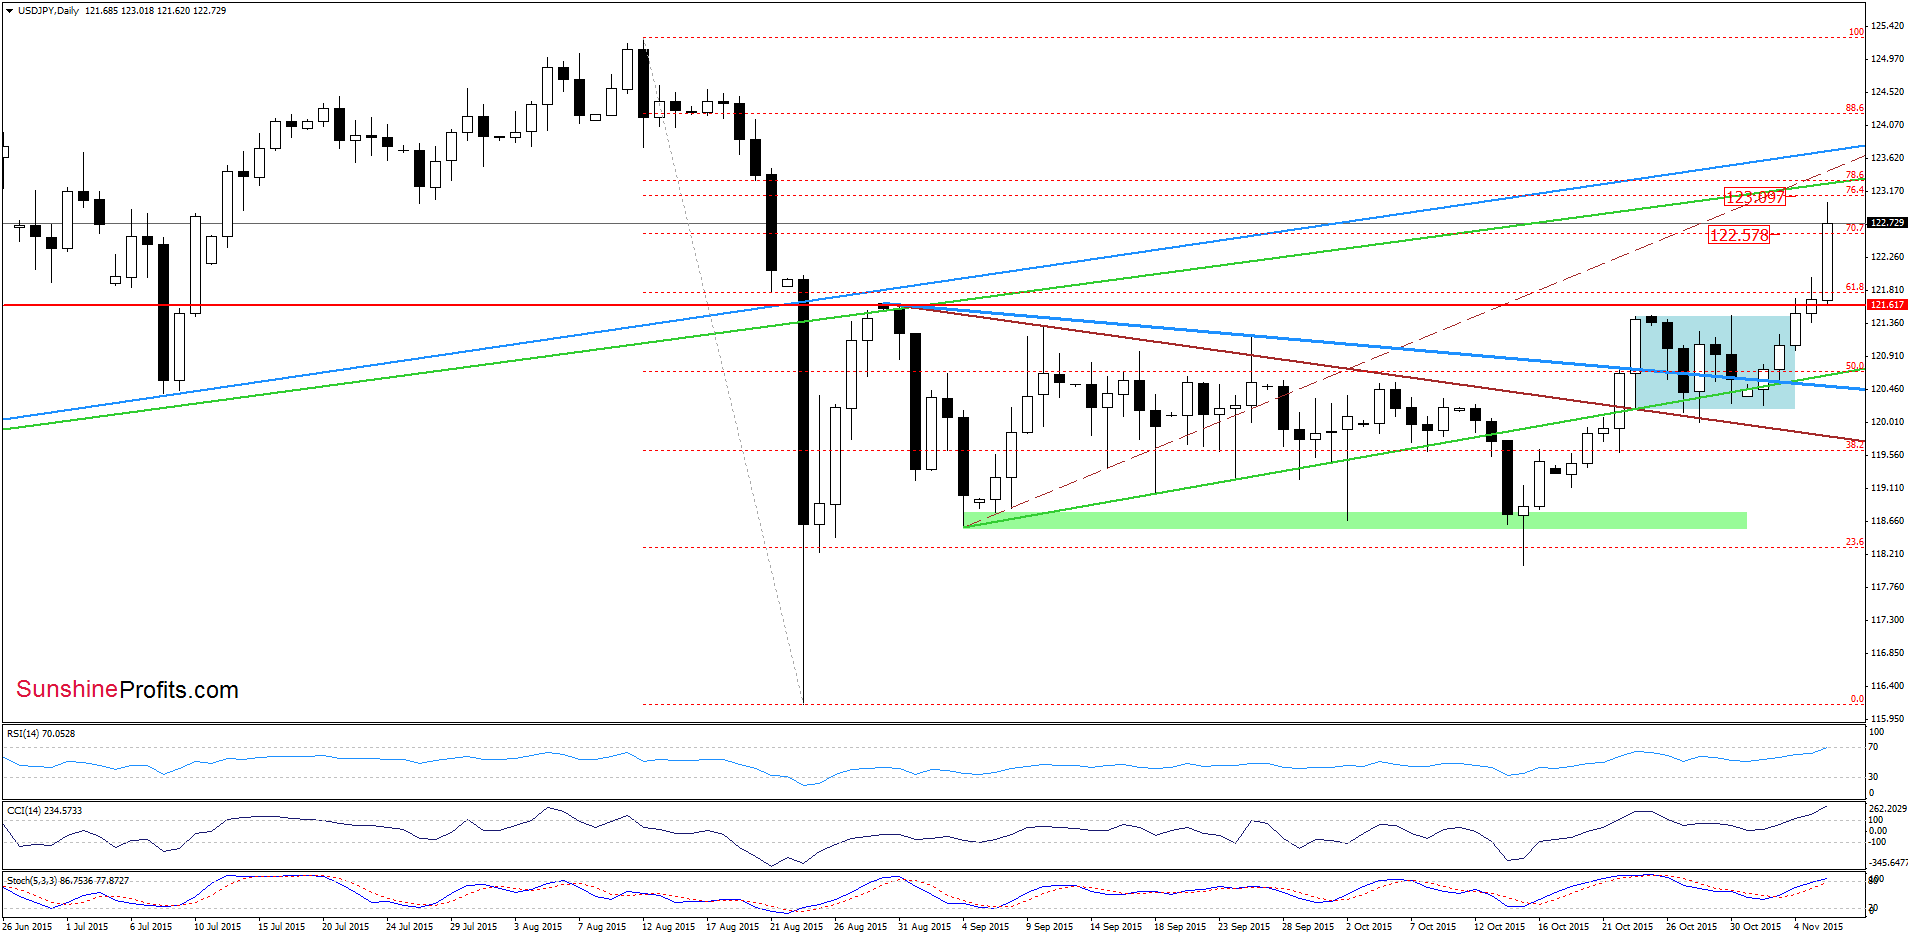
Yesterday, we wrote:
(…) the exchange rate climbed to slightly above the Aug high, which is another positive signal. On top of that, the current position of the indicators supports further improvement. Taking all the above into account, we think that currency bulls will try to break above the 61.8% Fibonacci retracement in the coming day. If they succeed, the next upside target would be the 70.7% retracement (around 122.57) or even the resistance area created by the 76.4%, 78.6% Fibonacci retracement levels and the long-term green resistance line.
From today’s point of view, we see that the situation developed in line with the above scenario and USD/JPY climbed to the 70.7% retracement. Taking into account the medium-term picture and the current position of the indicators, we think that our next upside target would be in play later in the day (or at the beginning of the coming week).
Very short-term outlook: mixed with bullish bias
Short-term outlook: mixed
MT outlook: mixed
LT outlook: mixed
Trading position (short-term; our opinion): No positions are justified from the risk/reward perspective at the moment. We will keep you informed should anything change, or should we see a confirmation/invalidation of the above.
USD/CAD
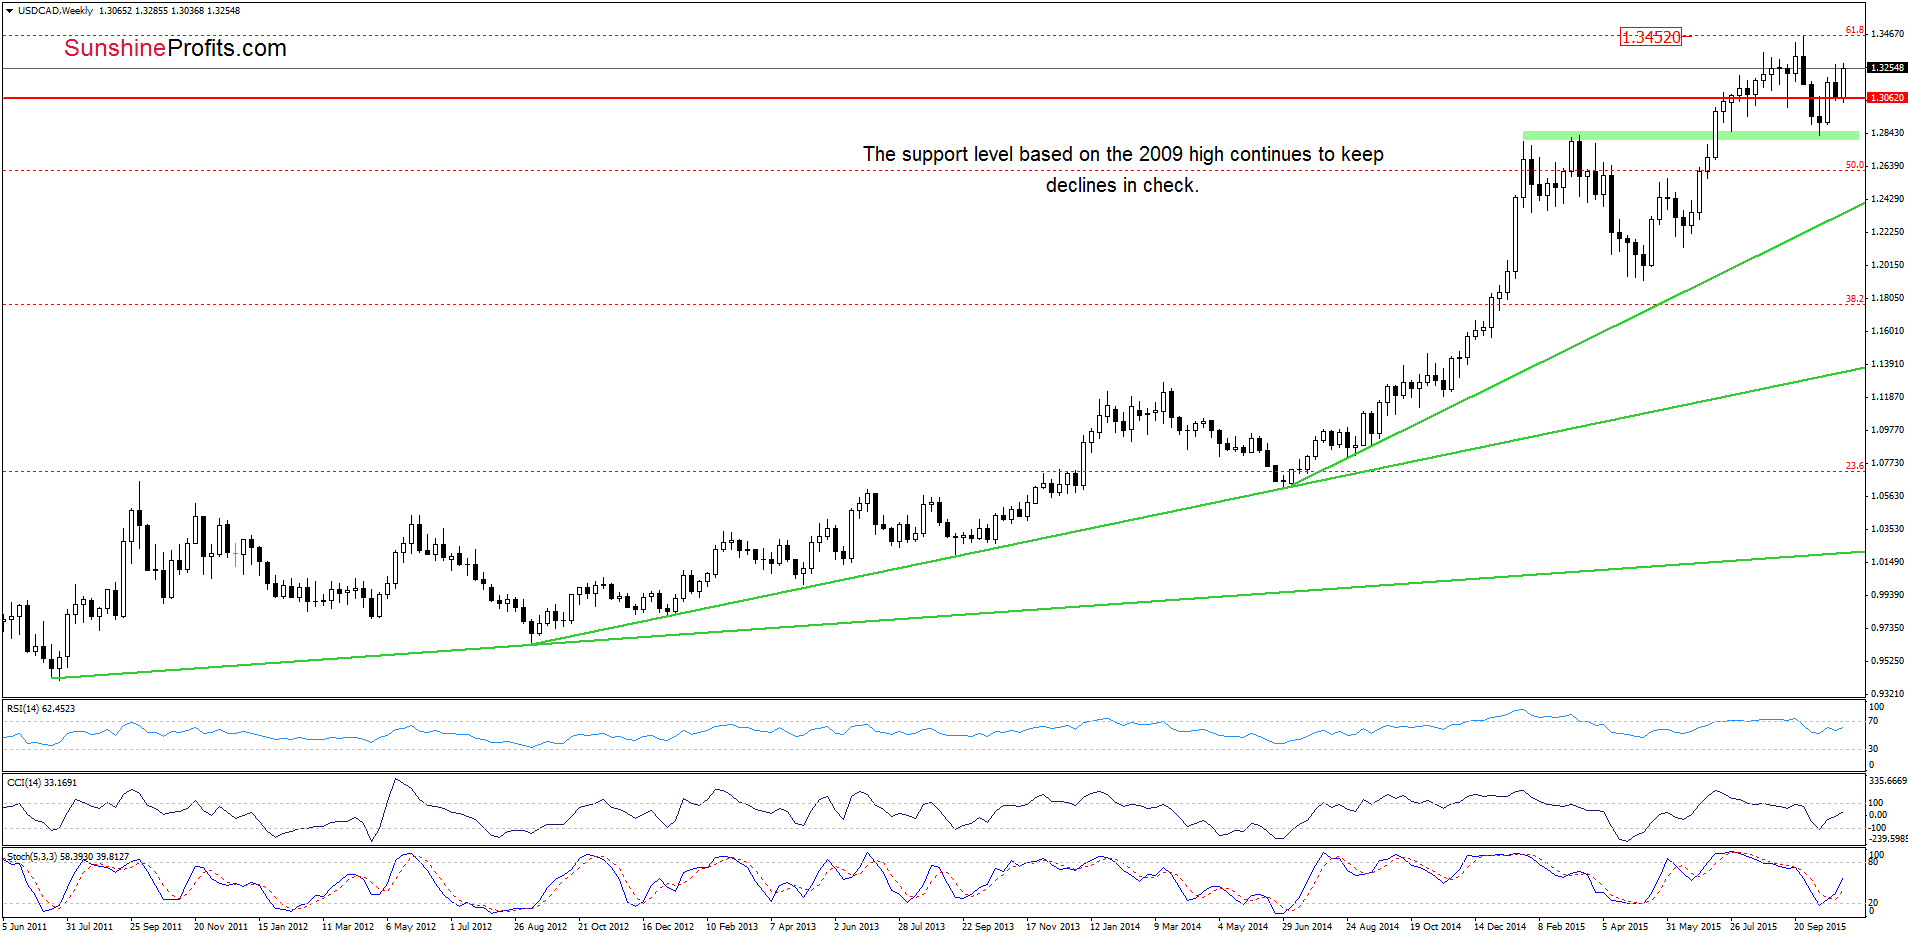
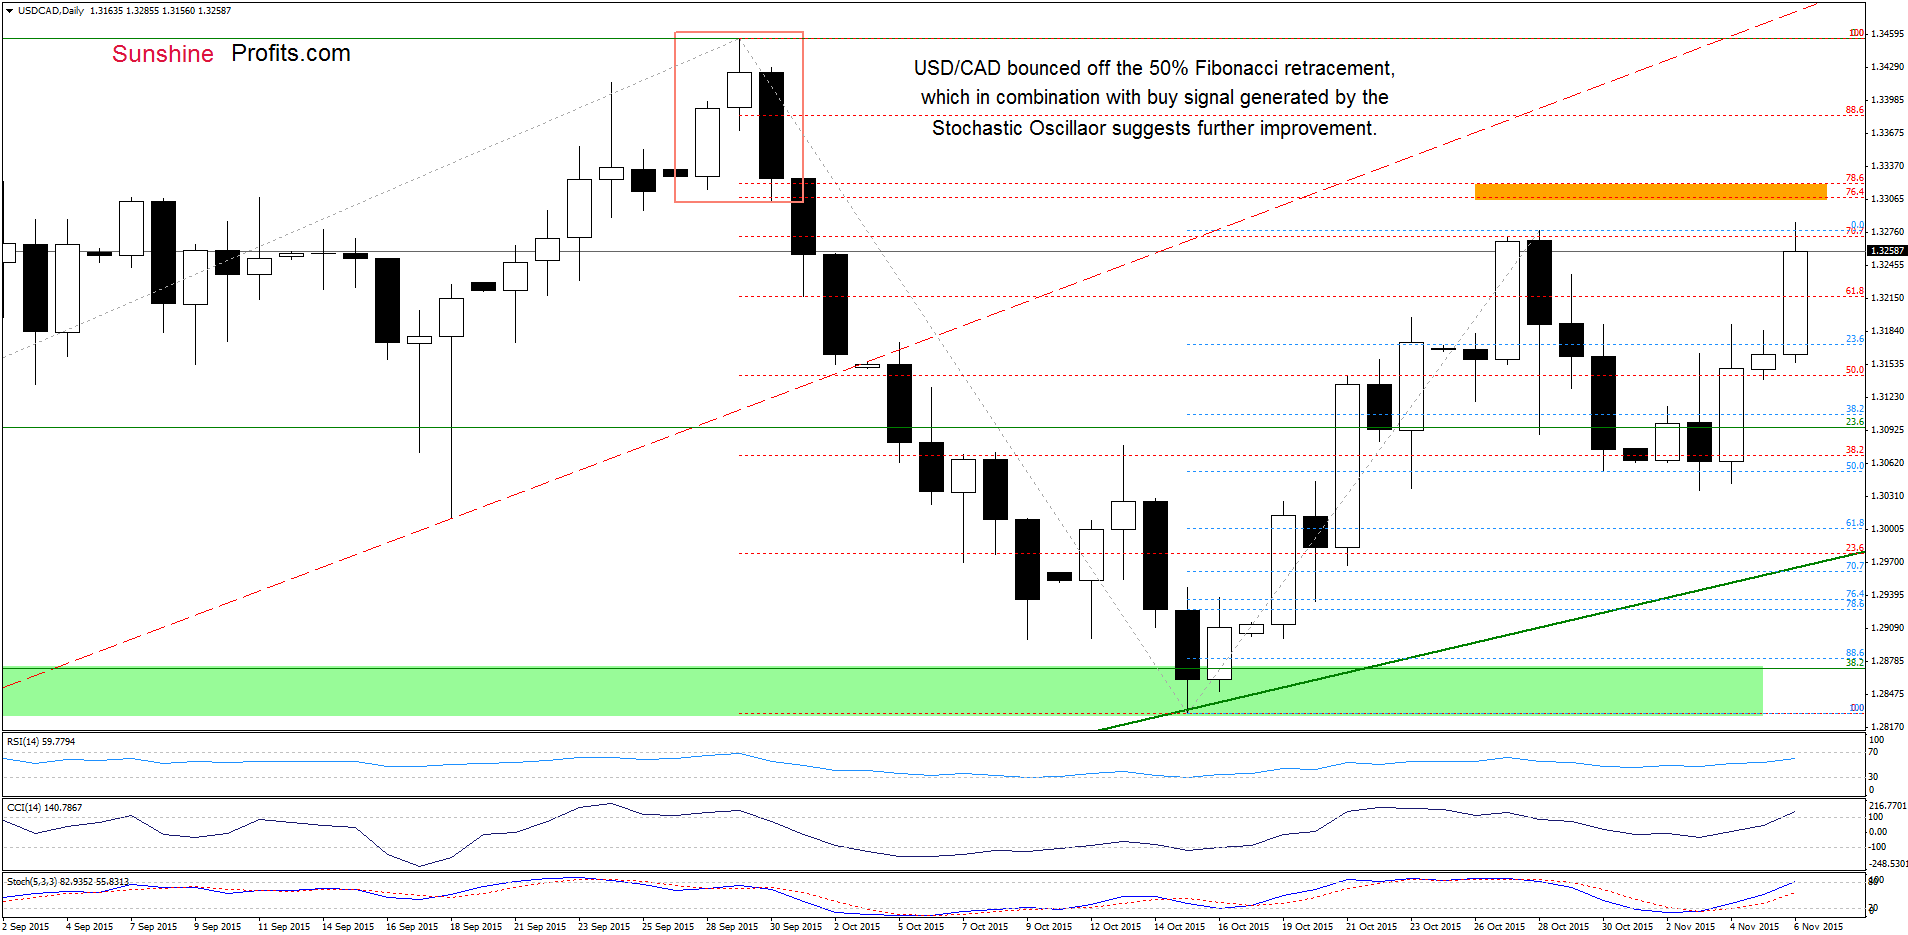
Looking at the above charts, we see that USD/CAD extended gains, which means that our upside targets from previous commentary would be in play in the coming day(s):
(…) the current position of the indicators suggests that currency bulls will try to push the pair higher in the coming days. If we see such price action, the initial upside target would be the barrier of 1.3300 (reinforced by the 70.7% retracement), which stopped the last week’s rally.
Very short-term outlook: mixed with bullish bias
Short-term outlook: mixed
MT outlook: mixed
LT outlook: mixed
Trading position (short-term; our opinion): No positions are justified from the risk/reward perspective at the moment. We will keep you informed should anything change, or should we see a confirmation/invalidation of the above.
USD/CHF
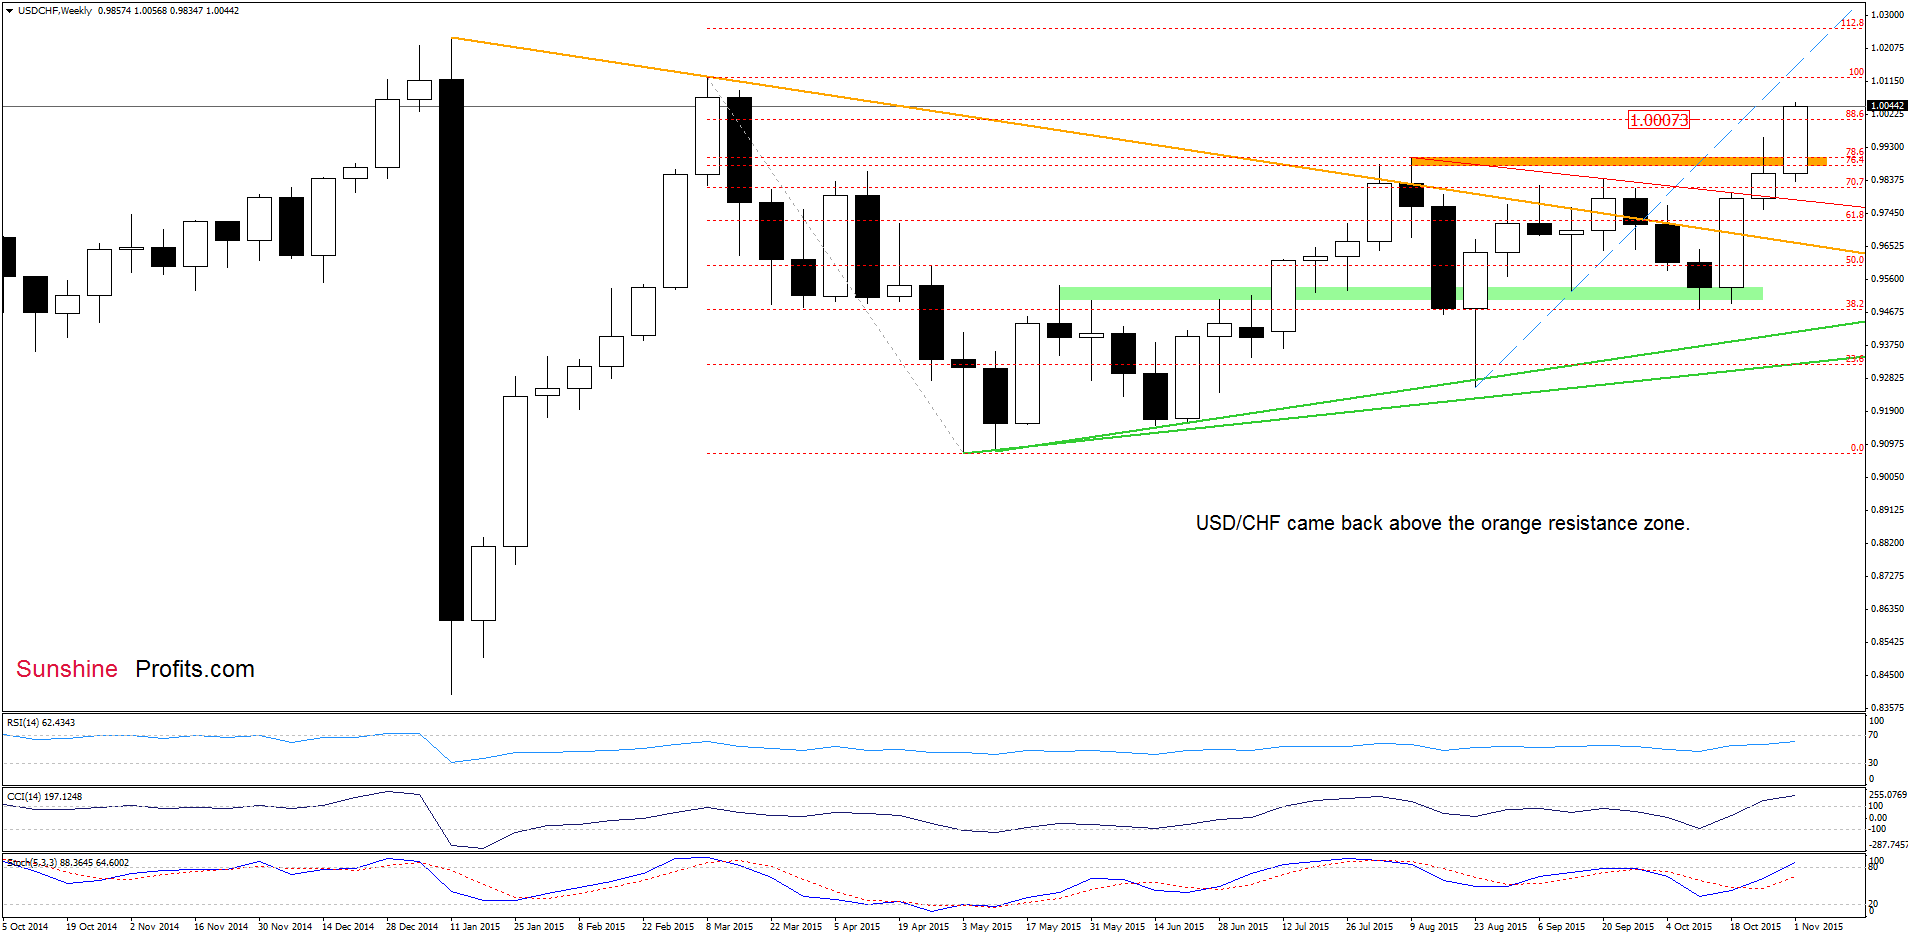
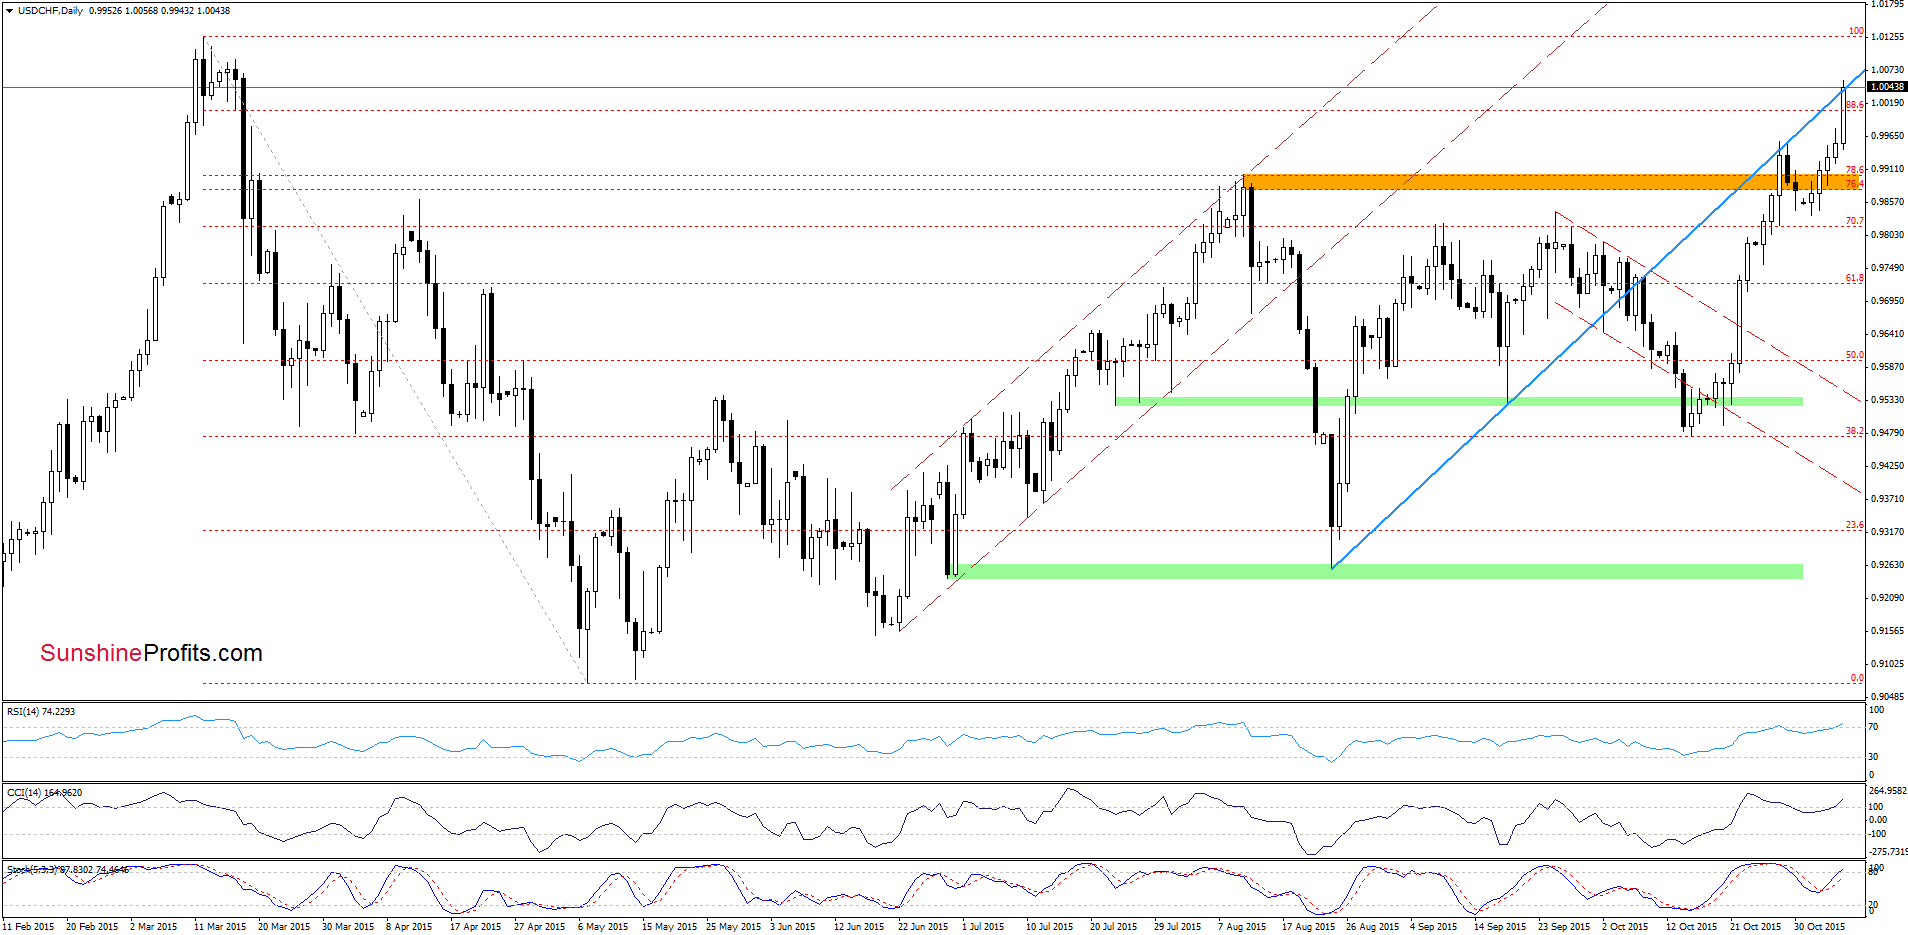
Looking at the charts we see that USD/CHF invalidated small breakdown under the orange resistance zone, which resulted in a rally to the blue resistance line. What’s next? The current position of the indicators suggests that we’ll see a test of the March high.
Very short-term outlook: mixed with bullish bias
Short-term outlook: mixed
MT outlook: mixed
LT outlook: mixed
Trading position (short-term; our opinion): No positions are justified from the risk/reward perspective at the moment. We will keep you informed should anything change, or should we see a confirmation/invalidation of the above.
AUD/USD
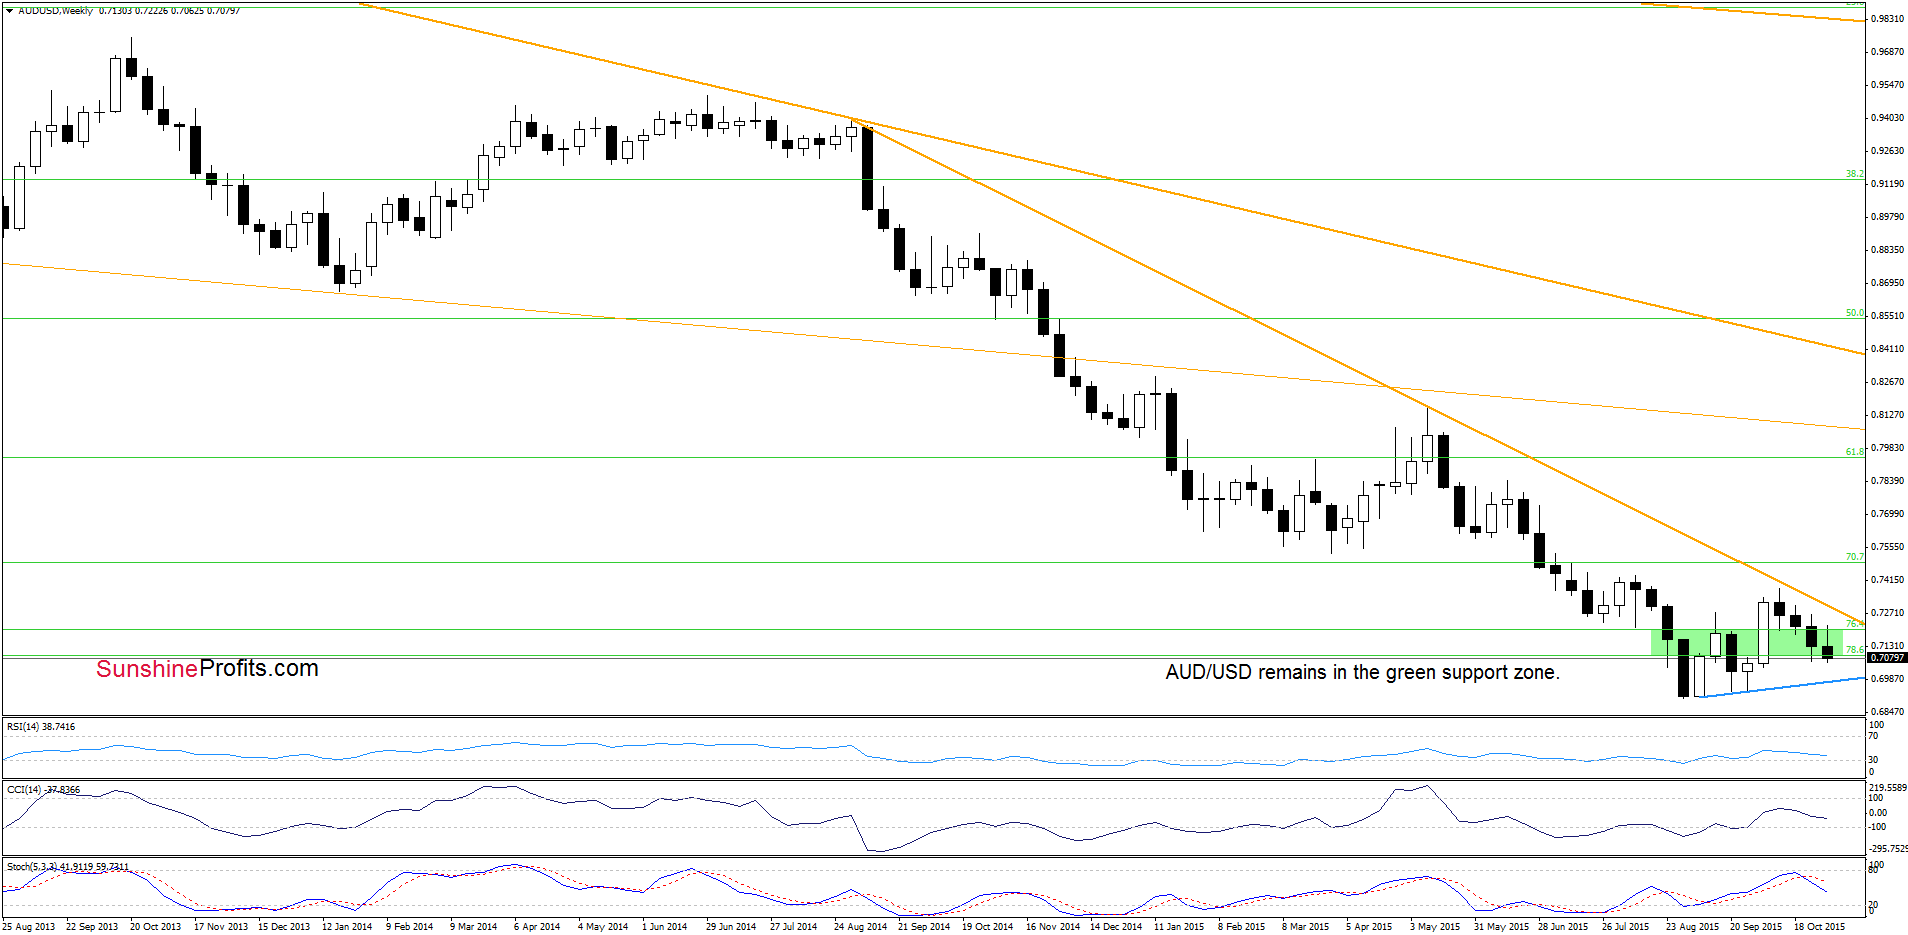
The medium-term picture hasn’t changed much as AUD/USD is trading in the green support zone. Nevertheless, if we see a breakdown below it, the next downside target would be the blue support line based on the previous lows.
Having said that, let’s focus on the daily chart.
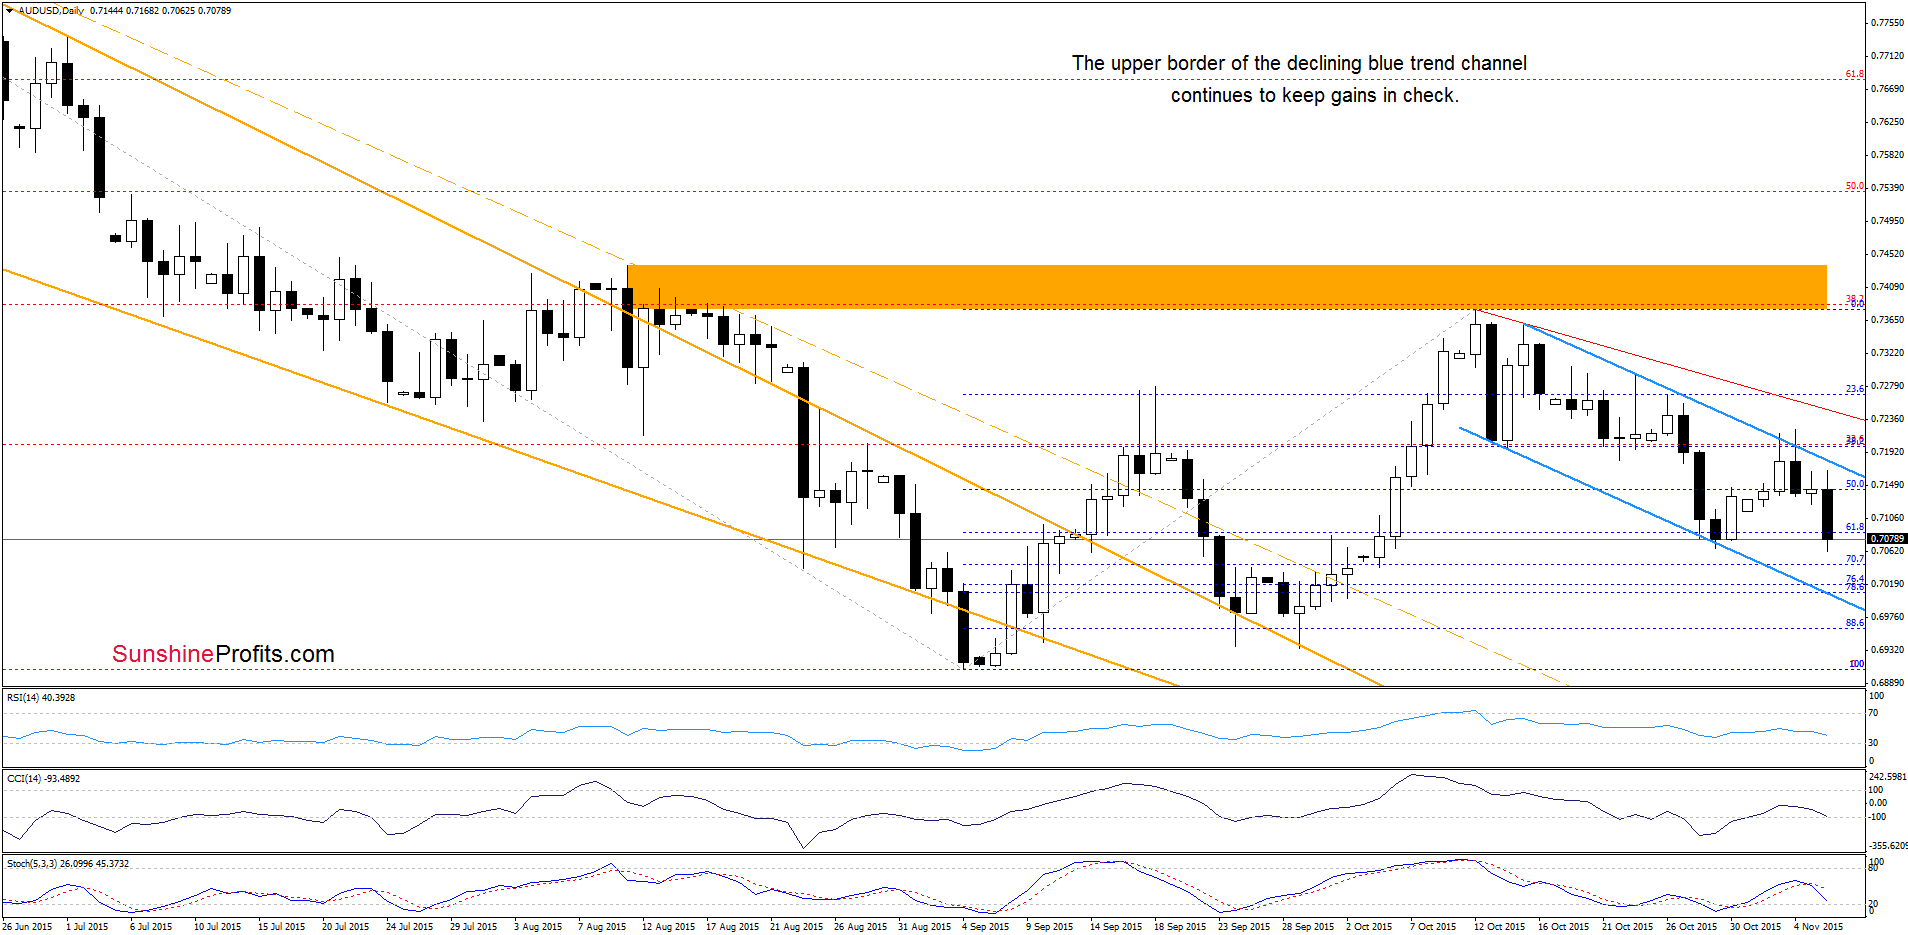
From this perspective, we see that the upper border of the blue declining trend channel stopped currency bulls and triggered a decline. Taking this fact into account, and combining it with sell signal generated by the Stochastic Oscillator, it seems that further deterioration is just around the corner. If this is the case, and the pair extends declines, the next downside target would be the lower border of the trend channel (currently around 0.7000).
Very short-term outlook: bearish
Short-term outlook: mixed
MT outlook: mixed
LT outlook: mixed
Trading position (short-term; our opinion): No positions are justified from the risk/reward perspective at the moment. We will keep you informed should anything change, or should we see a confirmation/invalidation of the above.
Thank you.
Nadia Simmons
Forex & Oil Trading Strategist
Przemyslaw Radomski, CFA
Founder, Editor-in-chief
Gold & Silver Trading Alerts
Forex Trading Alerts
Oil Investment Updates
Oil Trading Alerts

