

Earlier today, official data showed that U.K. industrial production rose 1.0% from a month earlier, beating forecasts for a 0.3% gain. Additionally, industrial output rose 1.9% from a year earlier, while manufacturing production was up 0.5% from a month earlier. Thanks to these bullish numbers, GBP/USD moved sharply higher and climbed above 1.5300. How high could the pair go in the coming days?
In our opinion the following forex trading positions are justified - summary:
- EUR/USD: short (a stop-loss order at 1.1887; the downside target around 1.0938)
- GBP/USD: none
- USD/JPY: none
- USD/CAD: none
- USD/CHF: none
- AUD/USD: none
EUR/USD
The overall situation in the medium term remains almost unchanged as EUR/USD is still trading under the long-term red declining resistance line and the orange resistance zone (reinforced by the bearish evening pattern), which together continue to keep gains in check. Today, we’ll focus on the very short-term changes.
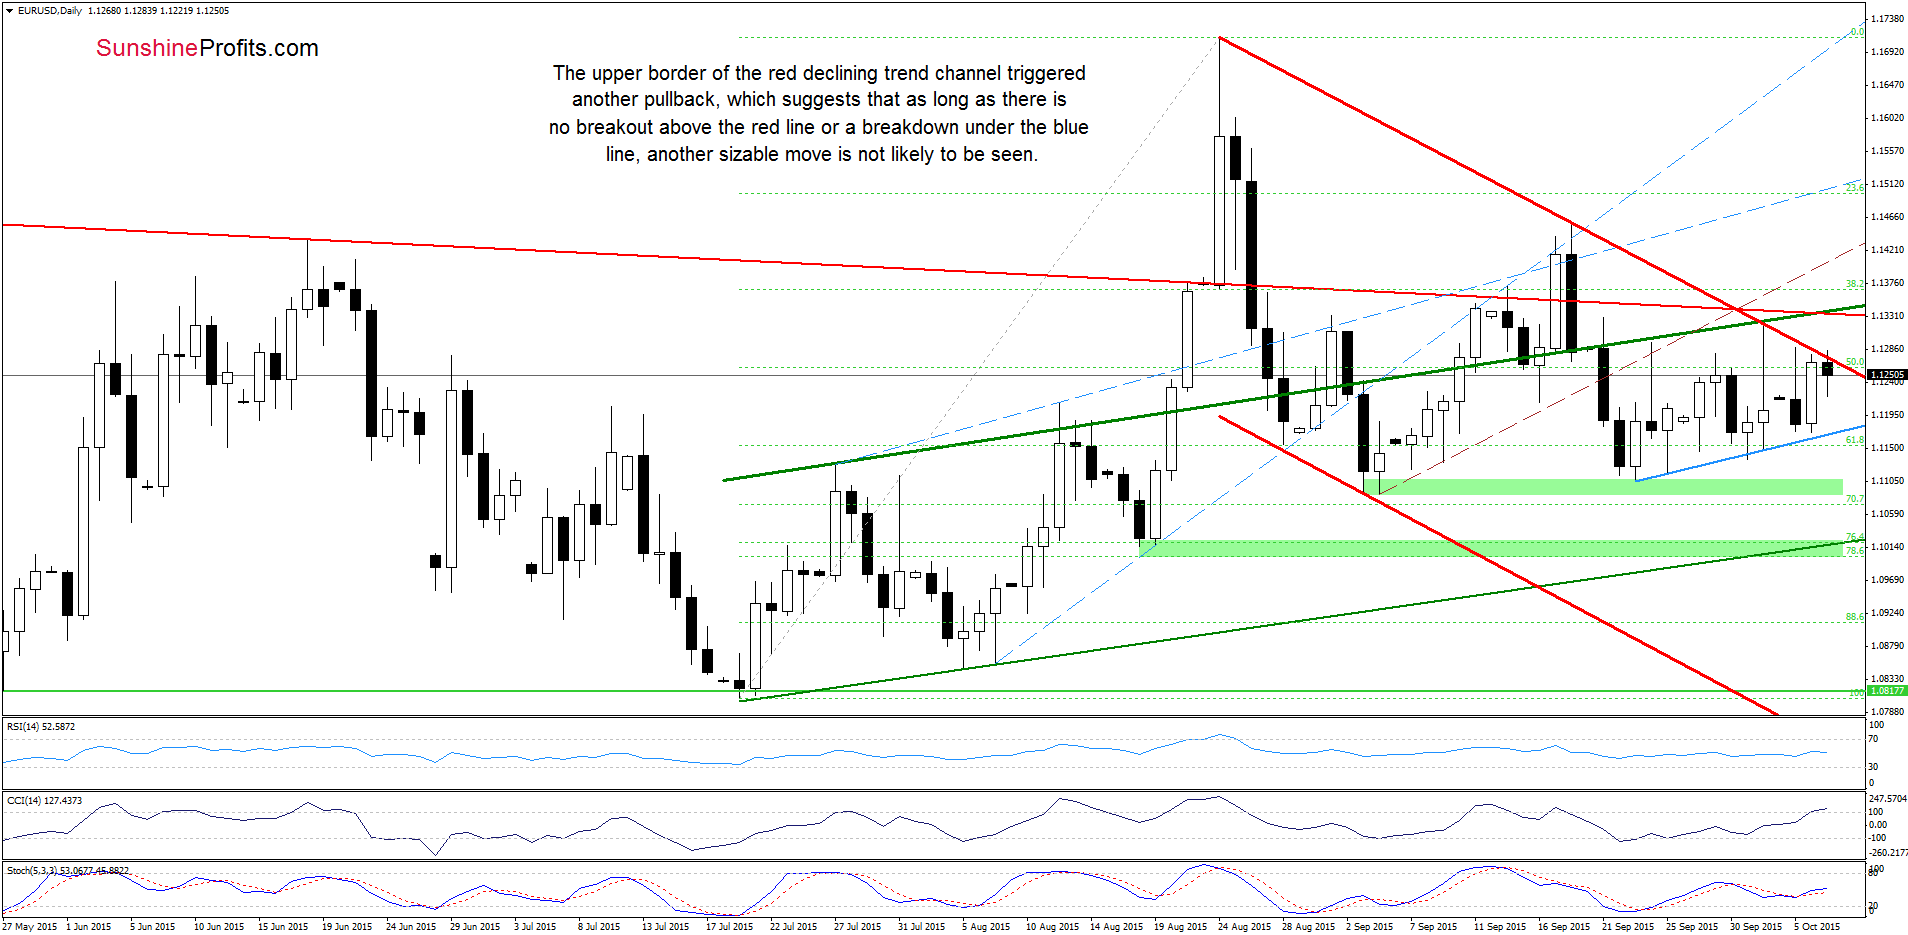
Yesterday, EUR/USD moved higher and approached the upper border of the red declining trend channel once again. Earlier today, this solid resistance line triggered another pullback - similarly to what we saw in previous days. Taking this fact into account, we believe that what we wrote yesterday is up-to-date:
(…) as long as there is no successful breakout above the upper border of the red declining trend channel or a breakdown below the blue line, another sizable move is not likely to be seen and short-lived moves in both directions should not surprise us.
Very short-term outlook: bearish
Short-term outlook: bearish
MT outlook: mixed with bearish bias
LT outlook: mixed
Trading position (short-term; our opinion): Short positions with a stop-loss order at 1.1887 are justified from the risk/reward perspective. We will keep you informed should anything change, or should we see a confirmation/invalidation of the above.
GBP/USD
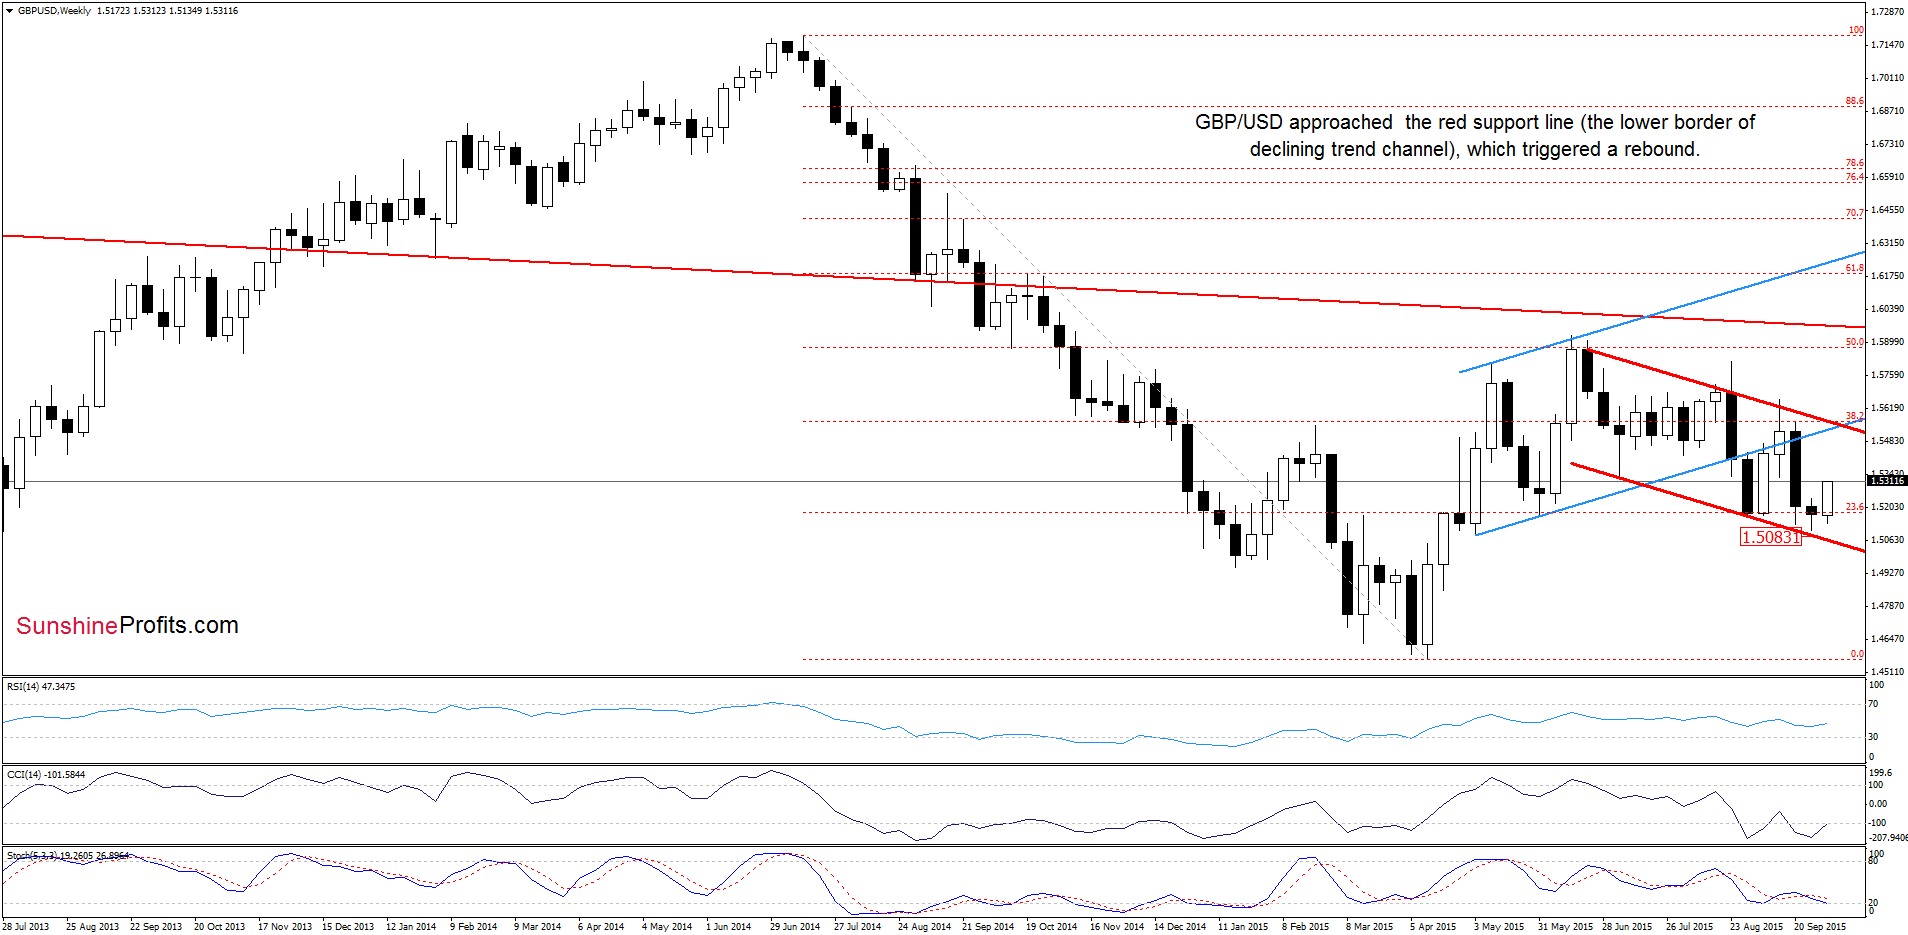
In the previous week, GBP/USD approached the lower border of the declining red trend channel, which encouraged currency bulls to act and resulted in a rebound. Earlier this week, the exchange rate extended gains and climbed above 1.5300.
What impact did this increase have on the very short-term picture? Let’s check.
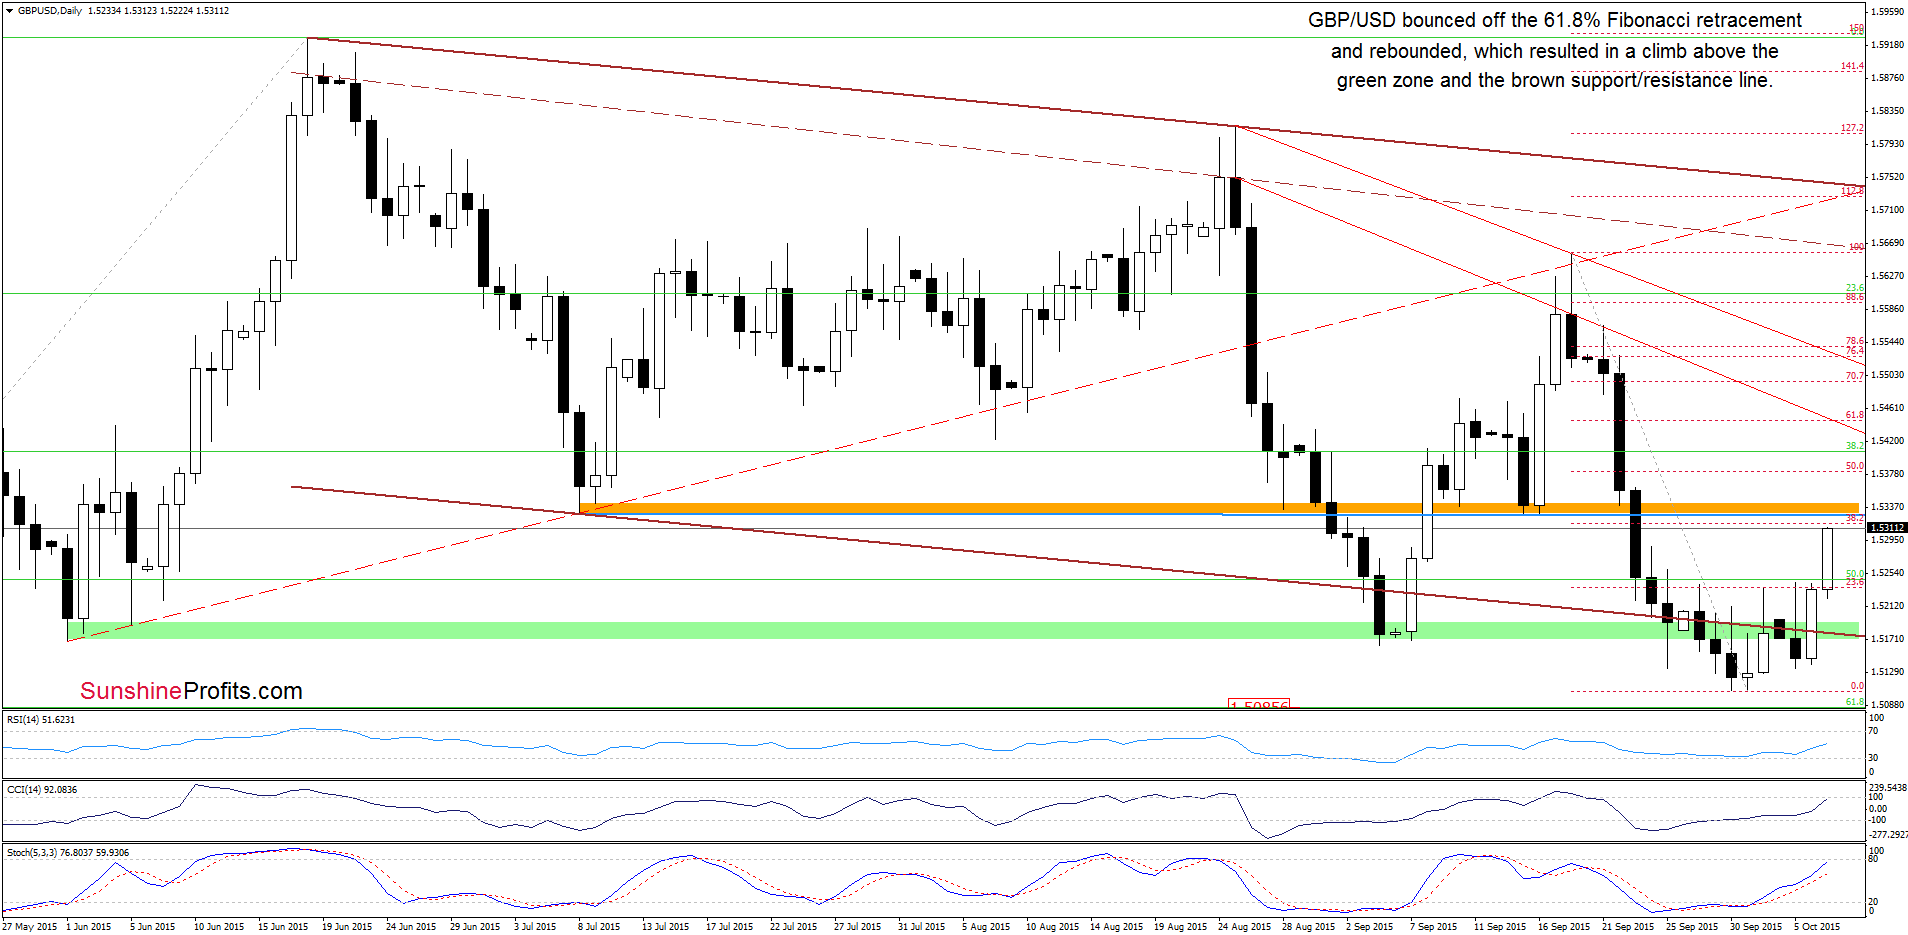
As you see on the daily chart, GBP/USD slipped under the green zone and the lower border of the brown declining trend channel on Monday. Despite this deterioration, buy signals generated by the indicators and the medium-term picture encouraged currency bulls to act, which resulted in a climb and daily closure above these levels. In this way, the pair invalidated earlier breakdown, which was a positive signal that triggered further improvement earlier today. With this upswing, GBP/USD approached the orange resistance zone and the 38.2% Fibonacci retracement level, which together could stop further rally (in this case, we may see a comeback to the green zone). Nevertheless, as long as there are no sell signals, an attempt to move higher is likely. Therefore, if we see a breakout above this resistance area, the initial upside target for currency bulls would be around 1.5381, where the 50% Fibonacci retracement is.
Very short-term outlook: mixed with bullish bias
Short-term outlook: mixed
MT outlook: mixed
LT outlook: mixed
Trading position (short-term; our opinion): No positions are justified from the risk/reward perspective at the moment. We will keep you informed should anything change, or should we see a confirmation/invalidation of the above.
AUD/USD
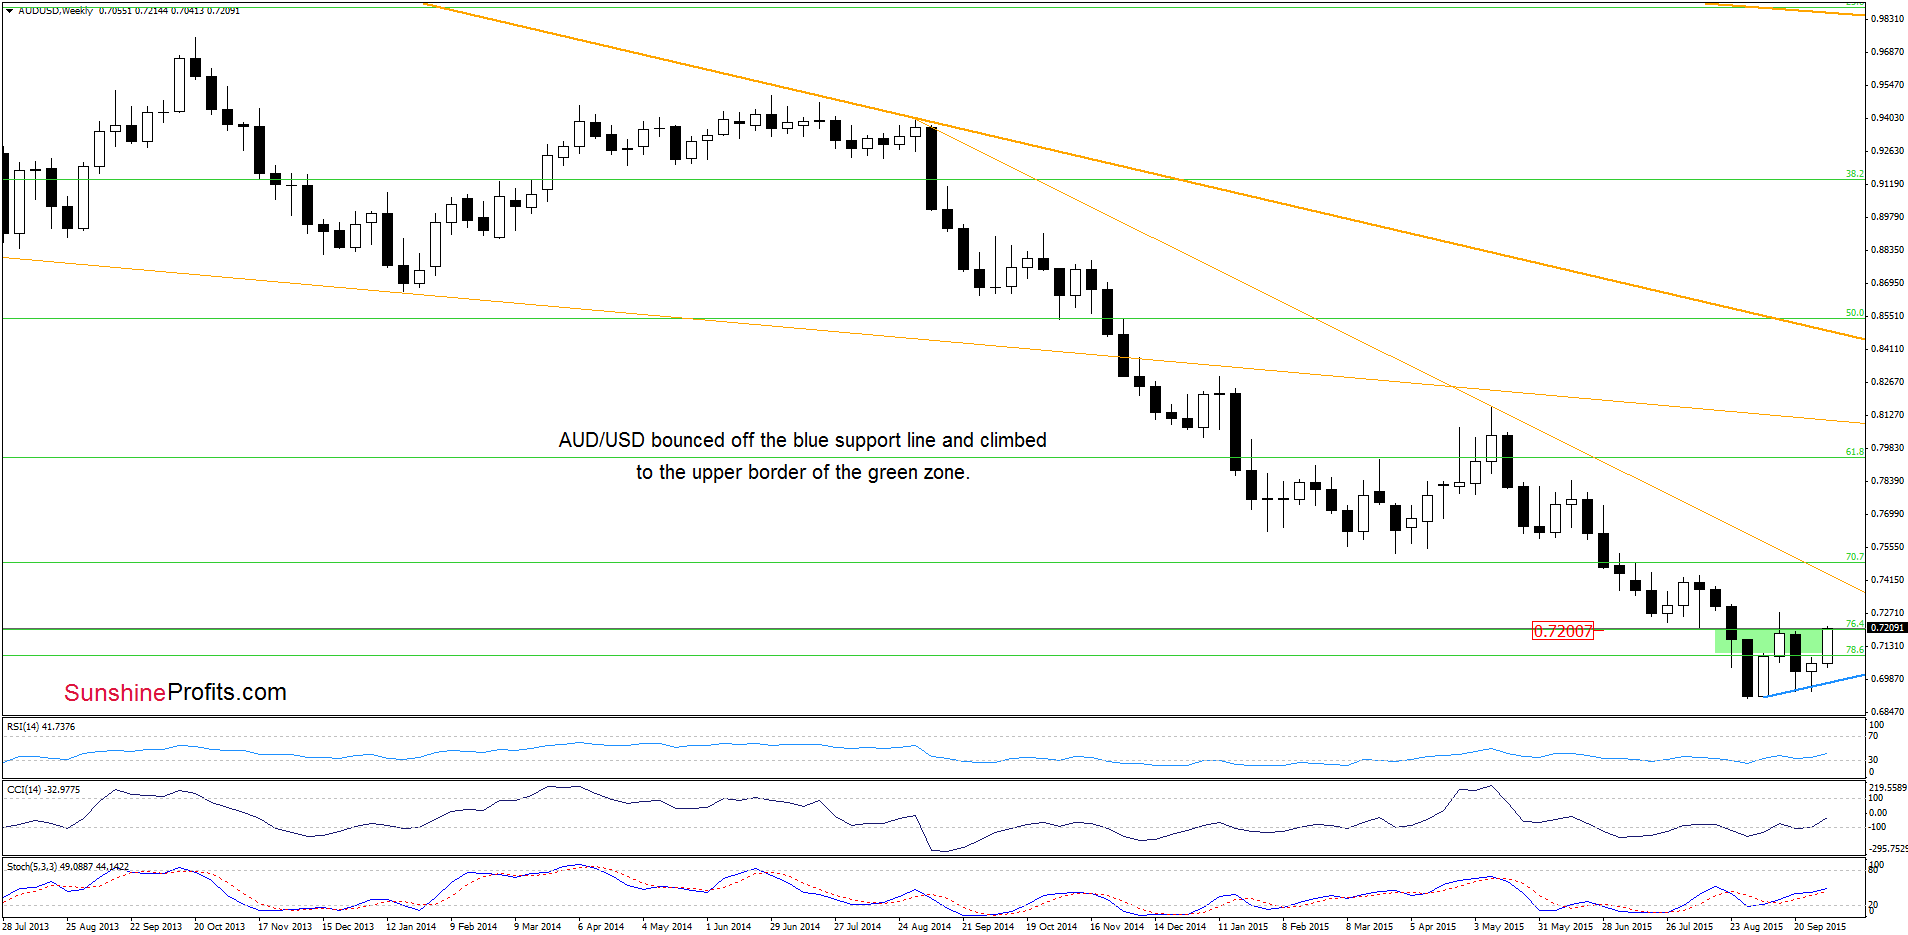
The situation in the medium-term has improved slightly as AUD/USD bounced off the blue support line and climbed to the upper border of the previously-broken green zone.
What impact did this move have on the daily chart? Let’s take a closer look at the chart below and find out.
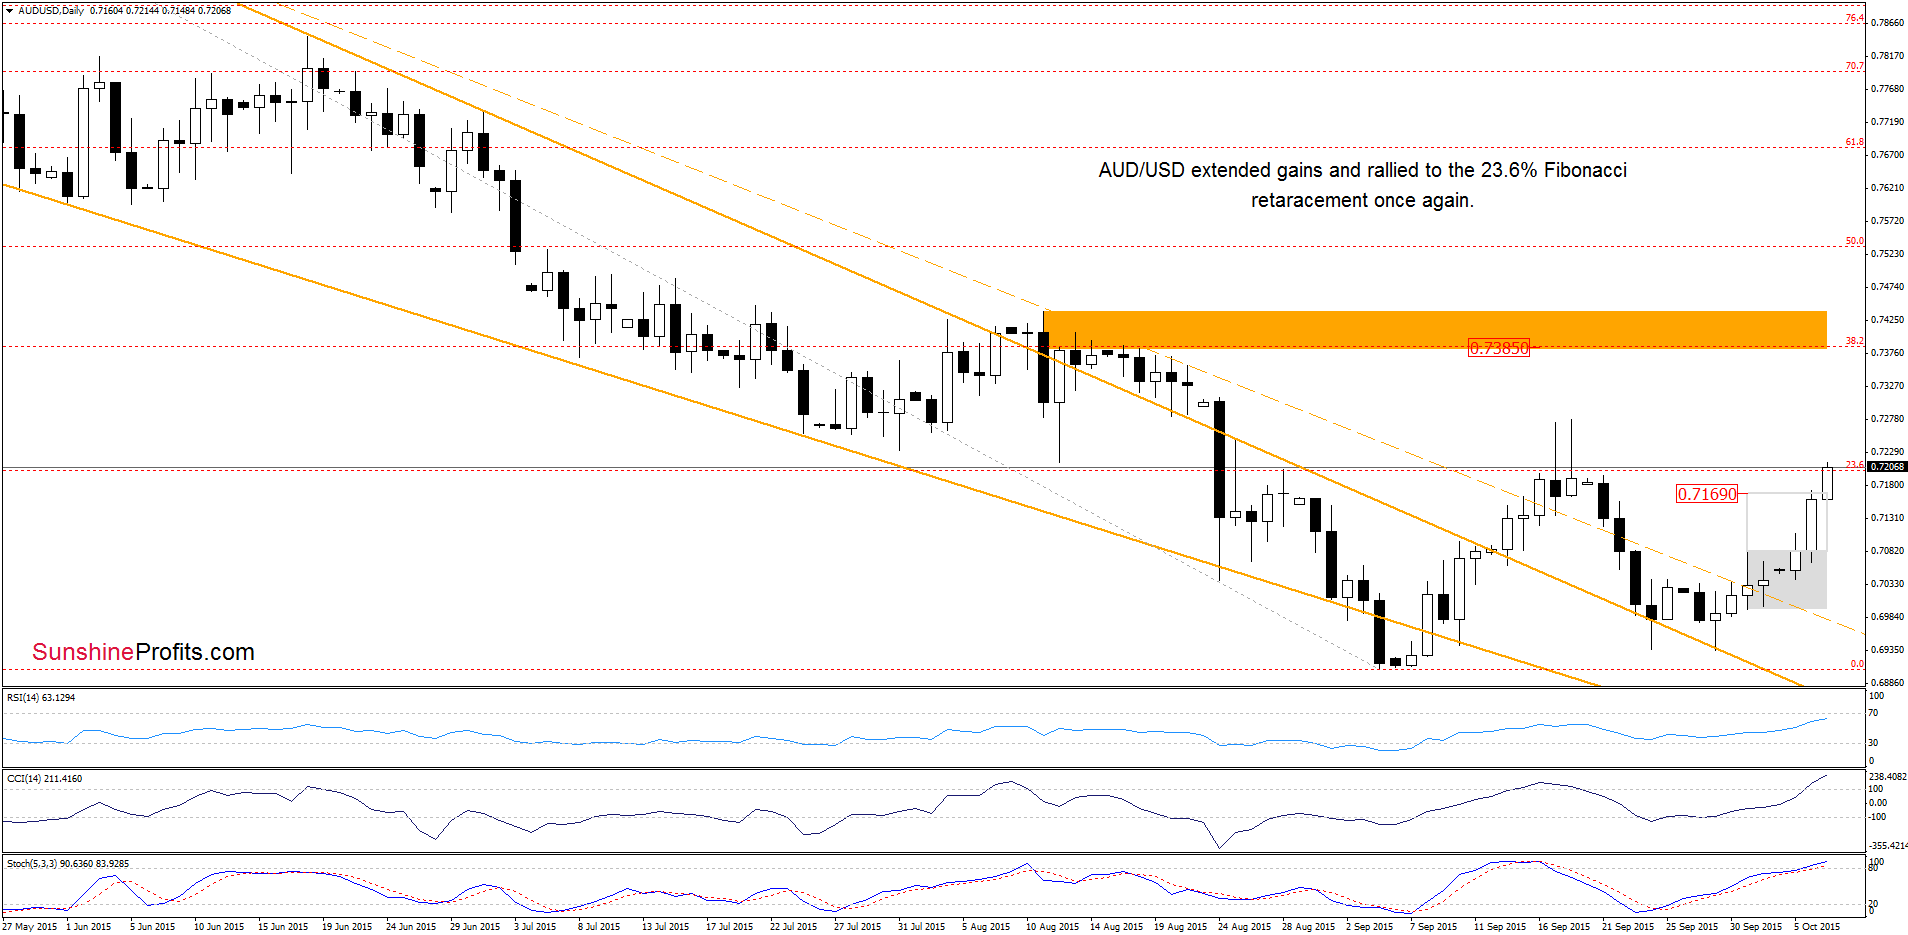
On Monday, we wrote the following:
(…) AUD/USD broke above the upper border of the grey consolidation, which is a positive signal that suggests further improvement – especially when we factor in the current position of the indicators. How high could the pair go in the coming days? In our opinion, the initial upside target would be around 0.7169, where the size of the upswing will correspond to the height of the formation.
Looking at the daily chart, we see that currency bulls took the exchange rate not only to our initial upside target, but also managed to push AUD/USD to the 23.6% Fibonacci retracement. This is a positive signal, which suggests that if we see a daily closure above this resistance, the pair may test the Sep highs in the near future.
Very short-term outlook: mixed with bullish bias
Short-term outlook: mixed
MT outlook: mixed
LT outlook: mixed
Trading position (short-term; our opinion): No positions are justified from the risk/reward perspective at the moment. We will keep you informed should anything change, or should we see a confirmation/invalidation of the above.
Thank you.
Nadia Simmons
Forex & Oil Trading Strategist
Przemyslaw Radomski, CFA
Founder, Editor-in-chief
Gold & Silver Trading Alerts
Forex Trading Alerts
Oil Investment Updates
Oil Trading Alerts

