

Although the U.S. unemployment rate remained unchanged at 5.1% in the previous month, the U.S. Labor Department showed that the economy added 142.000 jobs in September, missing expectations for a 203.000 increase. Additionally, average hourly earnings were flat in September, missing forecasts for a 0.2% rise. These disappointing numbers, raised uncertainty over whether or not the Federal Reserve will raise interest rates before the end of the year. As a result, the USD Index declined sharply, breaking below the level of 96. What impact did this drop have on our six currency pairs?
In our opinion the following forex trading positions are justified - summary:
- EUR/USD: short (a stop-loss order at 1.1887; the downside target around 1.0938)
- GBP/USD: none
- USD/JPY: none
- USD/CAD: none
- USD/CHF: none
- AUD/USD: none
EUR/USD
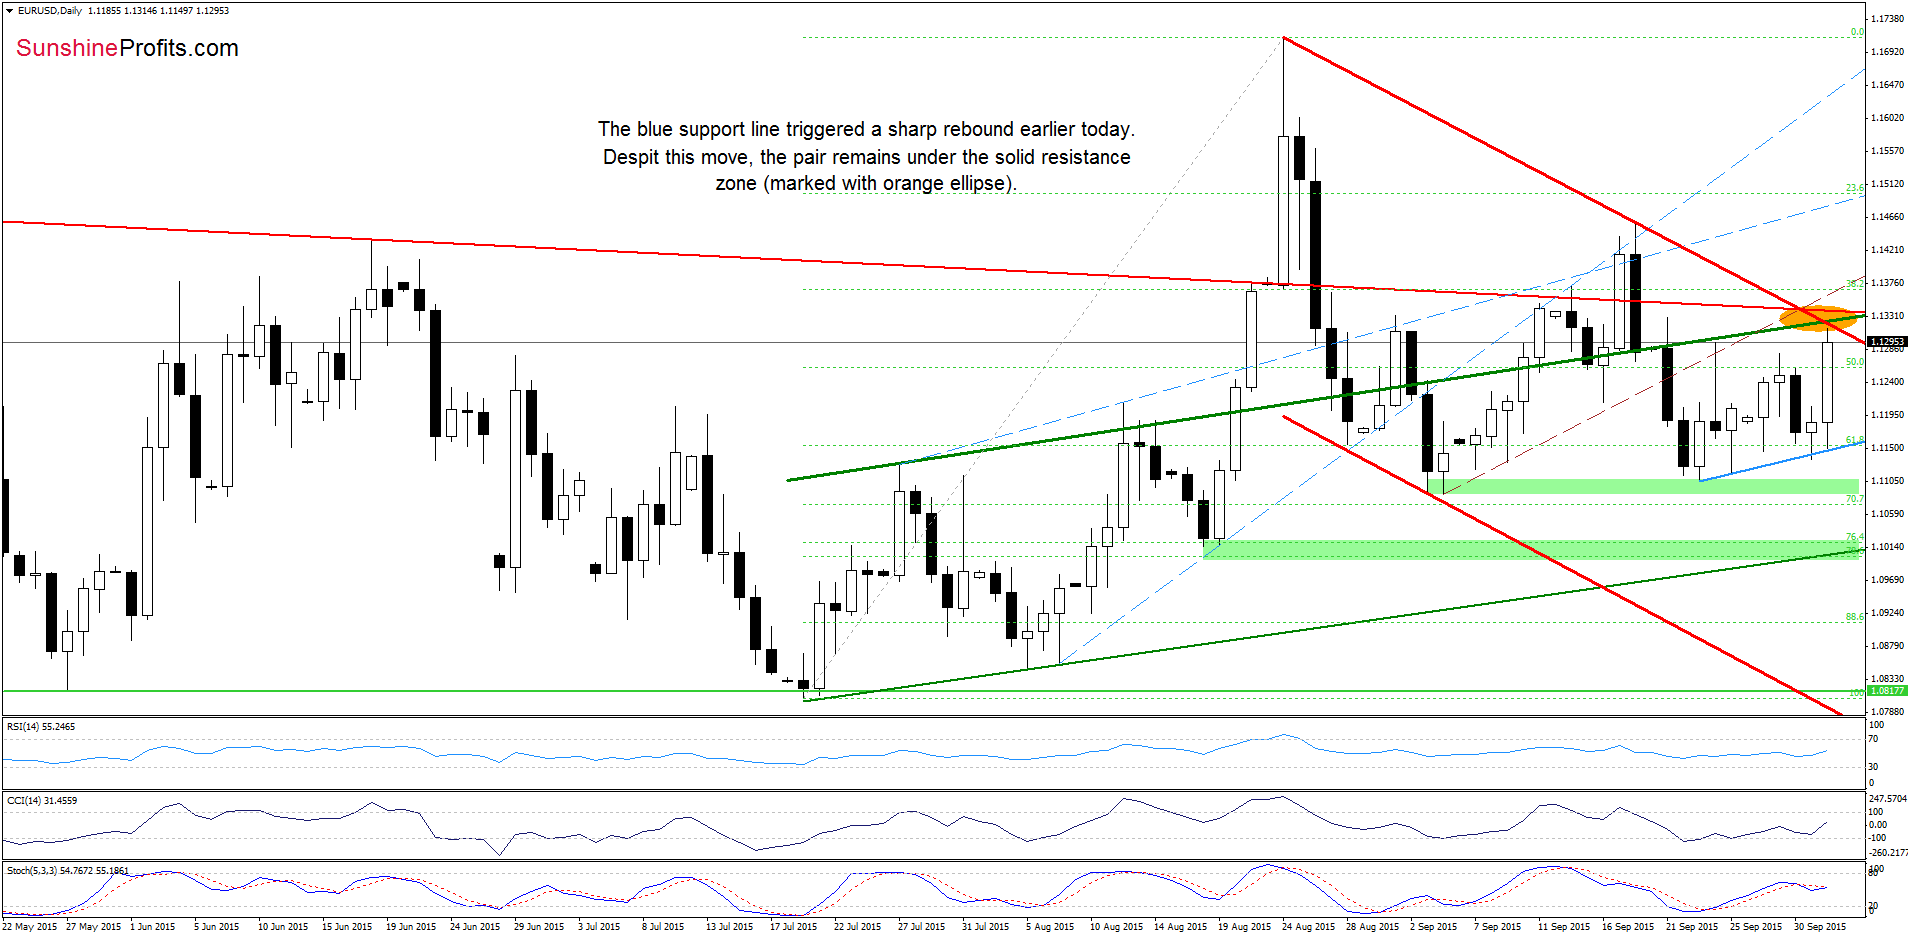
Earlier today, the blue support line triggered a sharp rebound, which took EUR/USD to the solid orange resistance zone (created by the upper border of the red declining trend channel, the green and red resistance lines). Although his is a positive signal, we think that as long as the exchange rate is trading below this area another attempt to move lower is very likely.
Did this increase change anything in the medium-term picture? Let’s check.
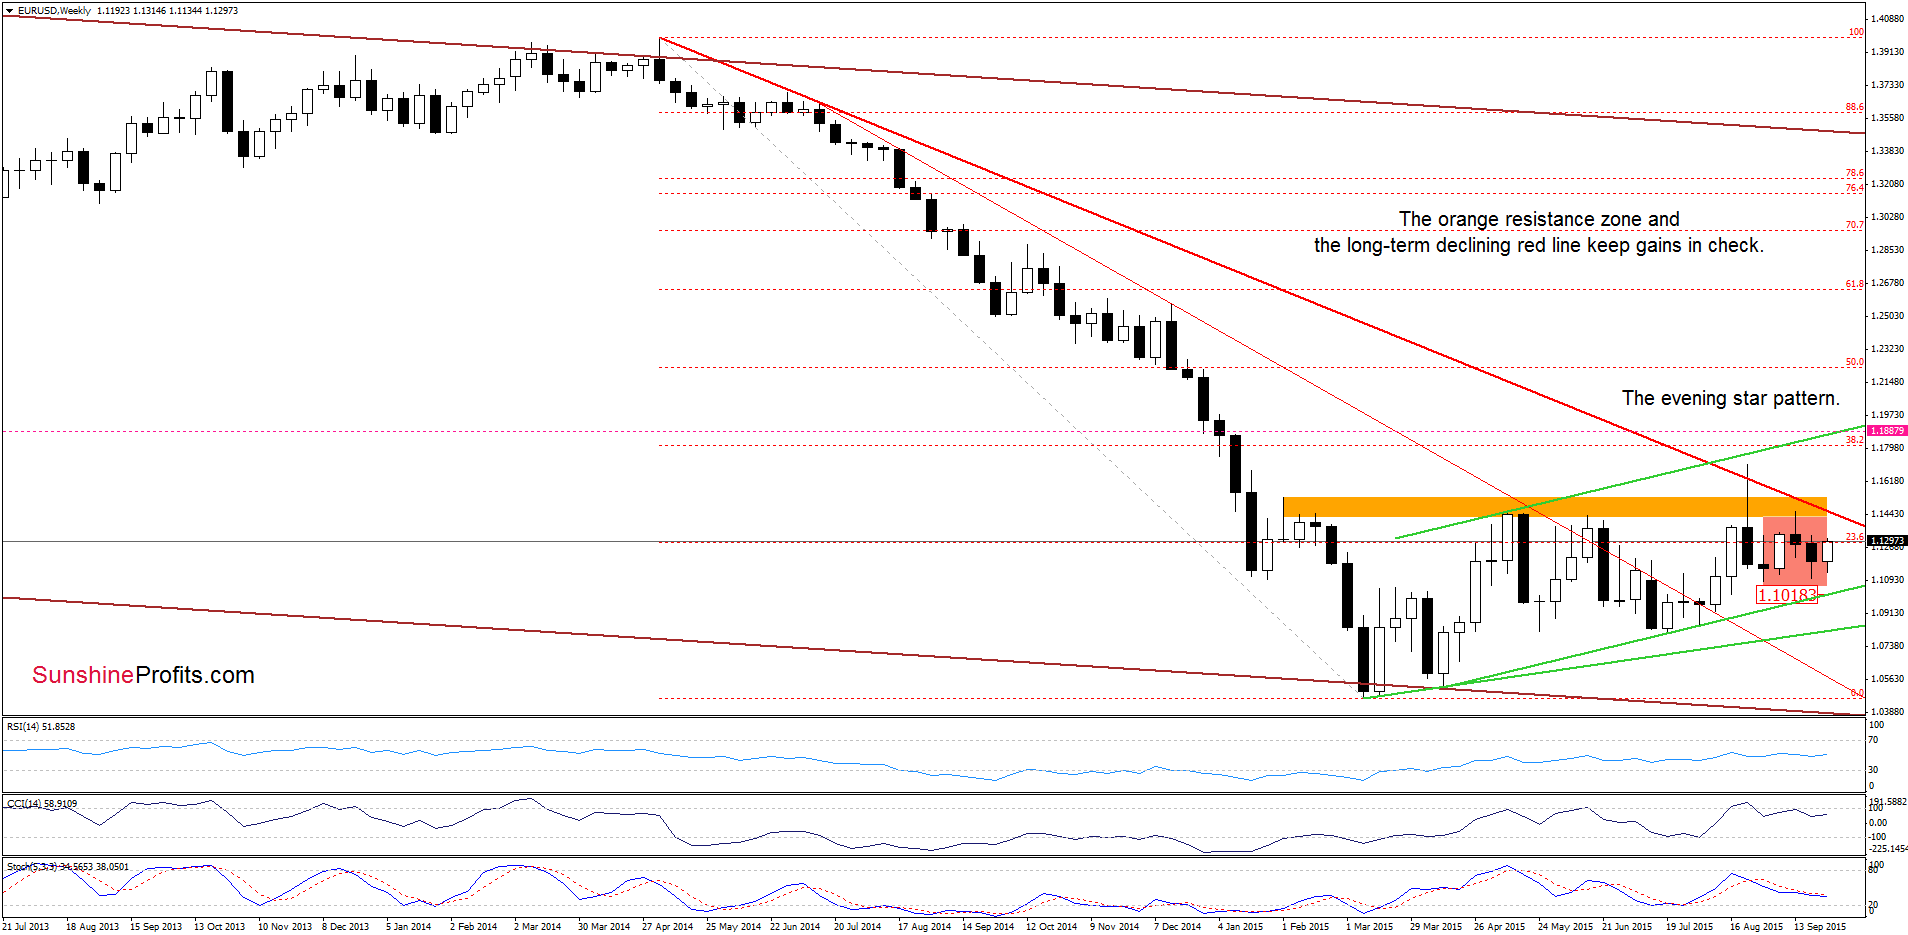
From this perspective, we see that the situation in the medium term reamins unchannged as EUR/USD remains under the long-term red declining resistance line and the orange resistance zone, which is also rinforced by the bearish evening pattern. Therefore, in our opinion, as long as there is no successful breakout above this area, a sizable raaly is not likely to be seen.
Very short-term outlook: bearish
Short-term outlook: bearish
MT outlook: mixed with bearish bias
LT outlook: mixed
Trading position (short-term; our opinion): Short positions with a stop-loss order at 1.1887 are justified from the risk/reward perspective. We will keep you informed should anything change, or should we see a confirmation/invalidation of the above.
GBP/USD
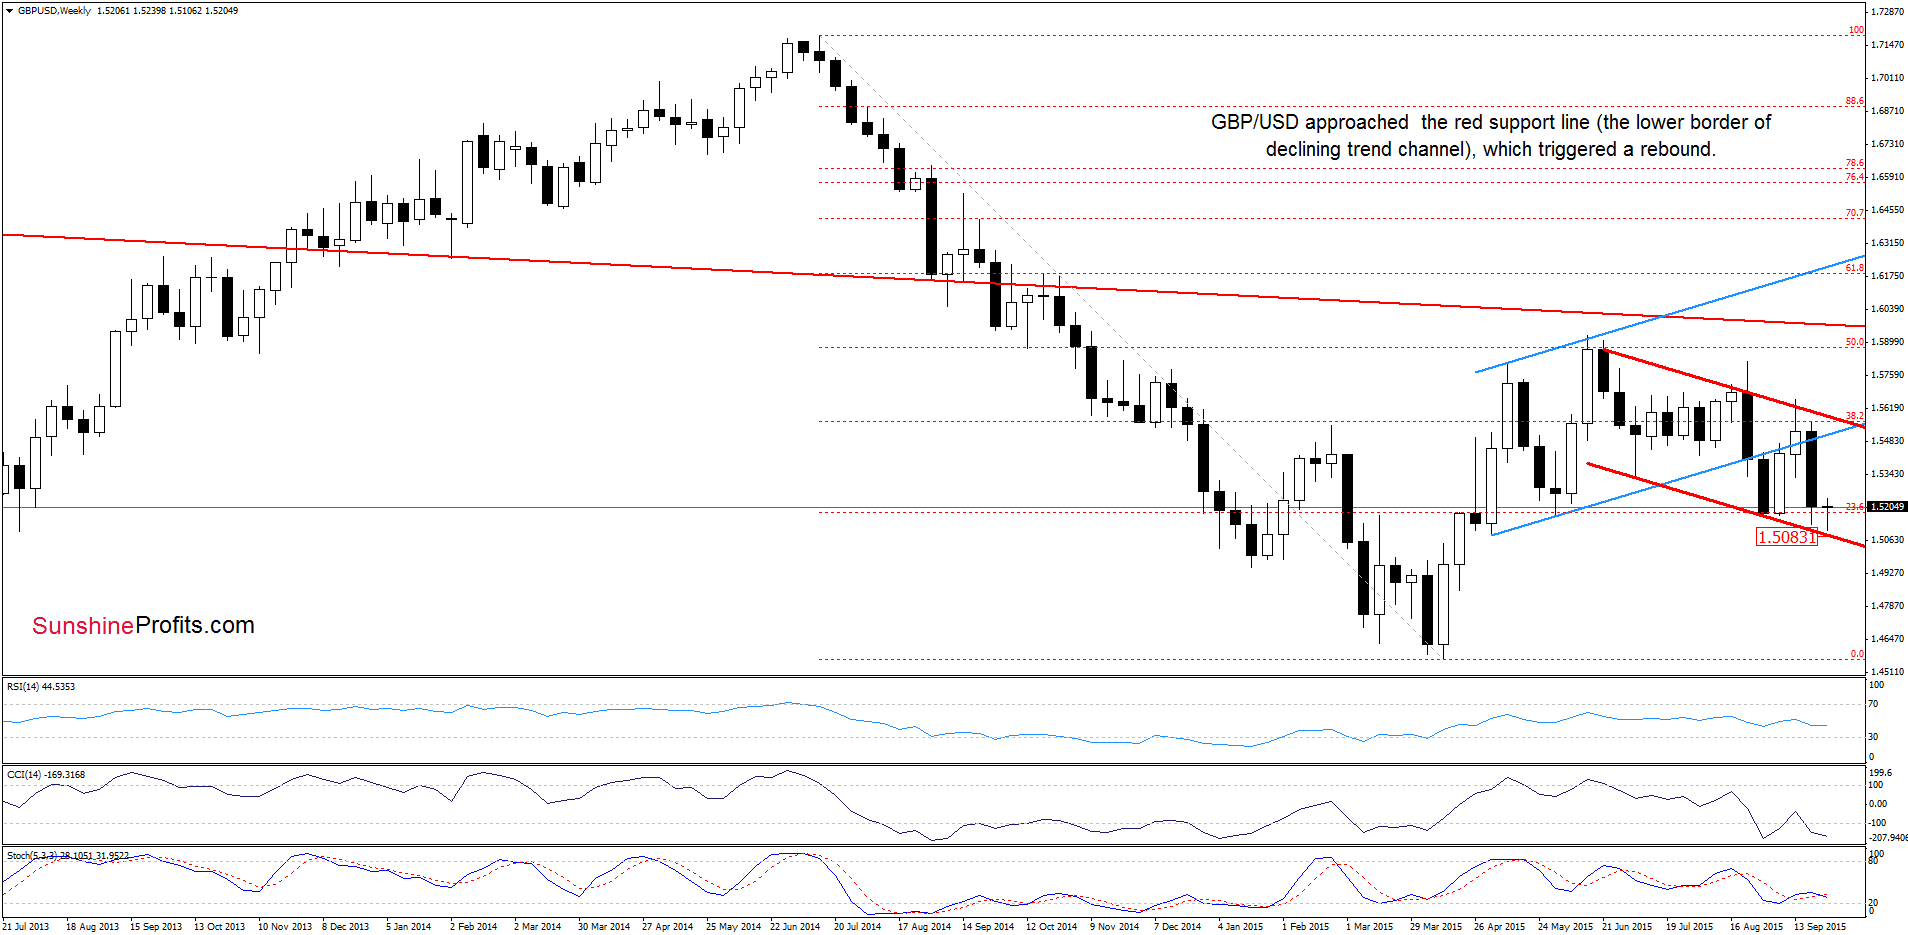
GBP/USD approached the lower border of the declining red trend channel, which encouraged currency bulls to act and resulted in a rebound.
What impact did this increase have on the very short-term picture? Let’s find out.
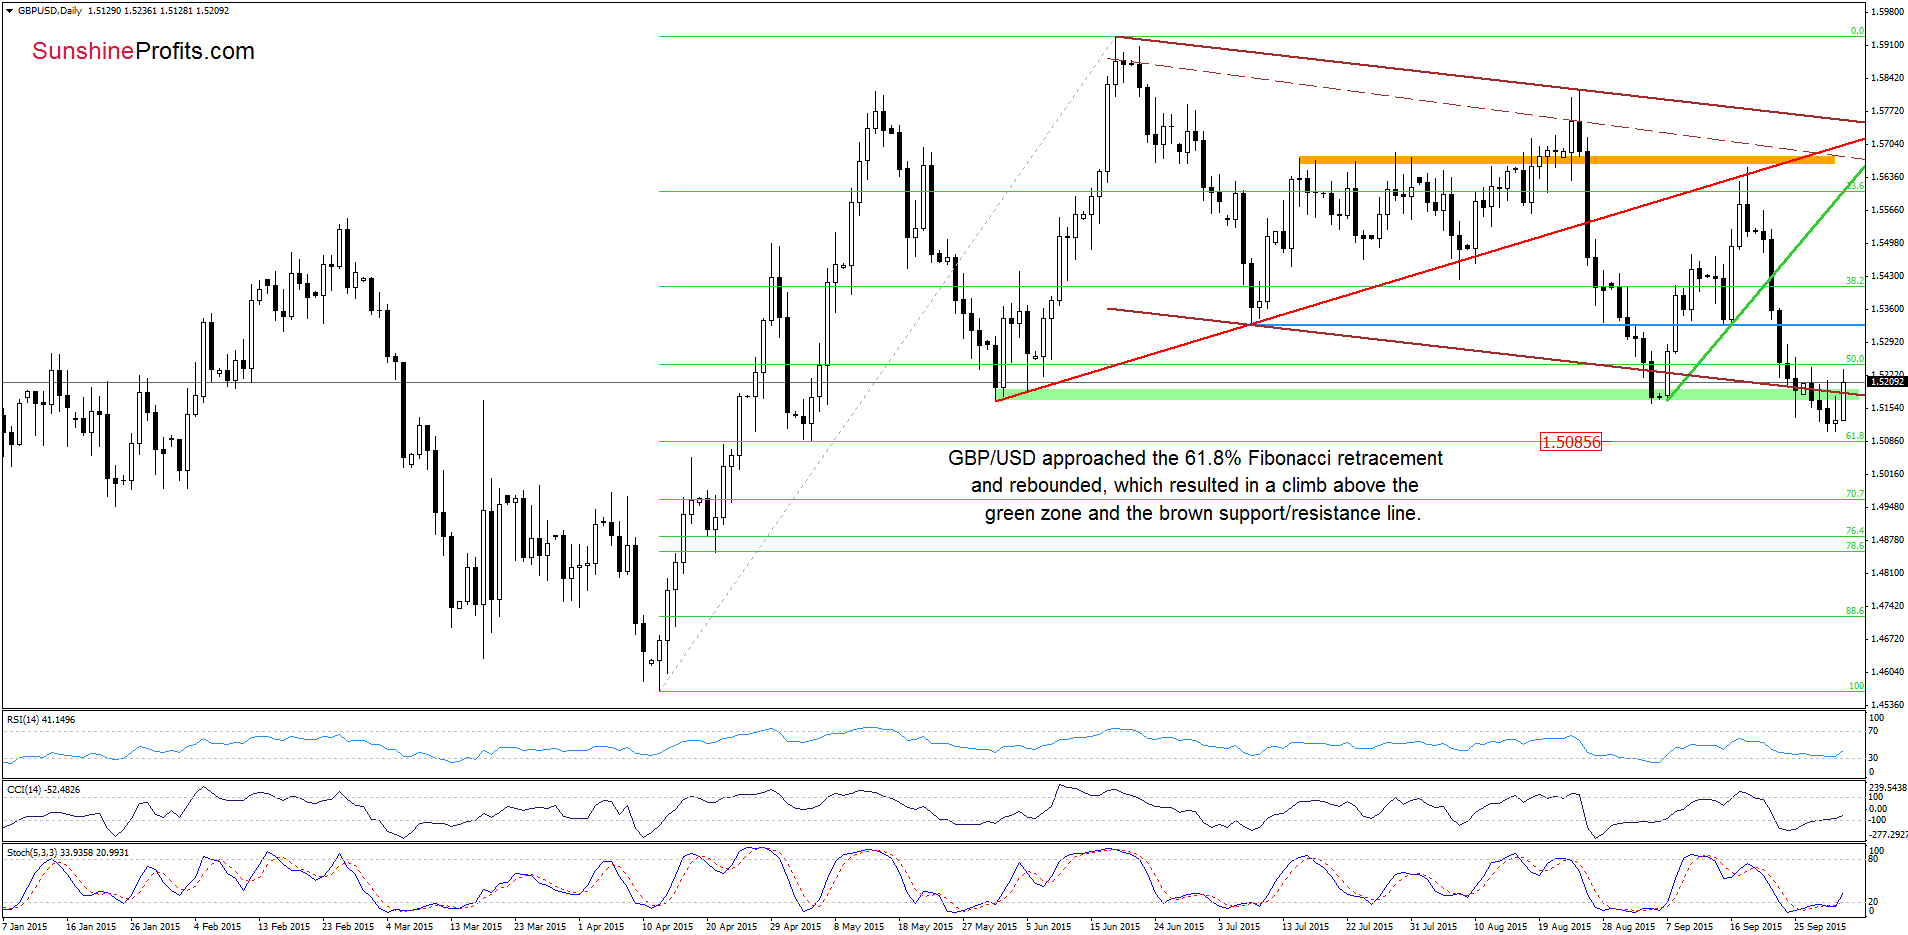
As you see on the daily chart, currency bears approached the exchange rate to the 61.8% Fibonacci retracement, which triggered a rebound and a comeback above the previously-broken green zone and the lower border of the brown declining trend channel. In this way, the pair invalidated earlier breakdown, which is a positive signal that suggests further improvement – especially when we factor in the medium-term picture and buy signals generated by the indicators. Nevertheless, such price action will be more reliable if we see a daily closure above these levels.
Very short-term outlook: mixed with bullish bias
Short-term outlook: mixed
MT outlook: mixed
LT outlook: mixed
Trading position (short-term; our opinion): No positions are justified from the risk/reward perspective at the moment. We will keep you informed should anything change, or should we see a confirmation/invalidation of the above.
USD/JPY
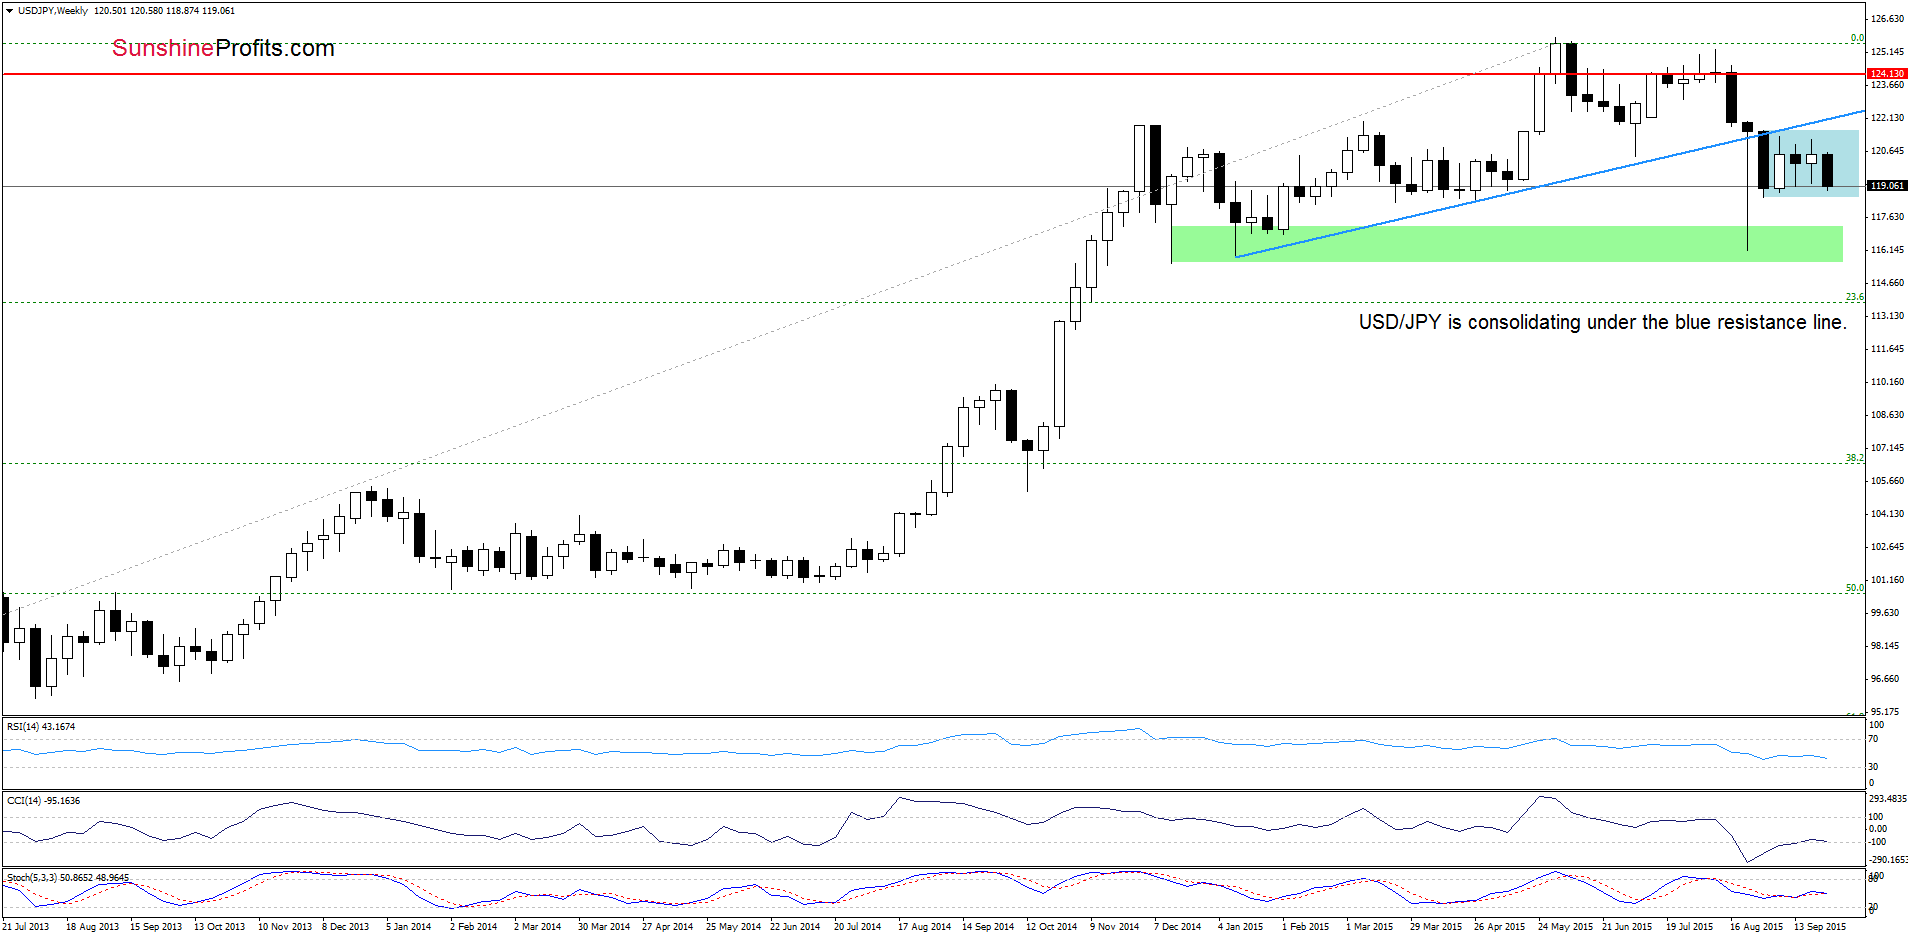
Although USD/JPY moved lower, the overall situation in the medium-term hasn’t changed much as the exchange rate is still trading in the consolidation under the blue resistance line.
Will the daily chart give us more clues about future moves? Let’s check.
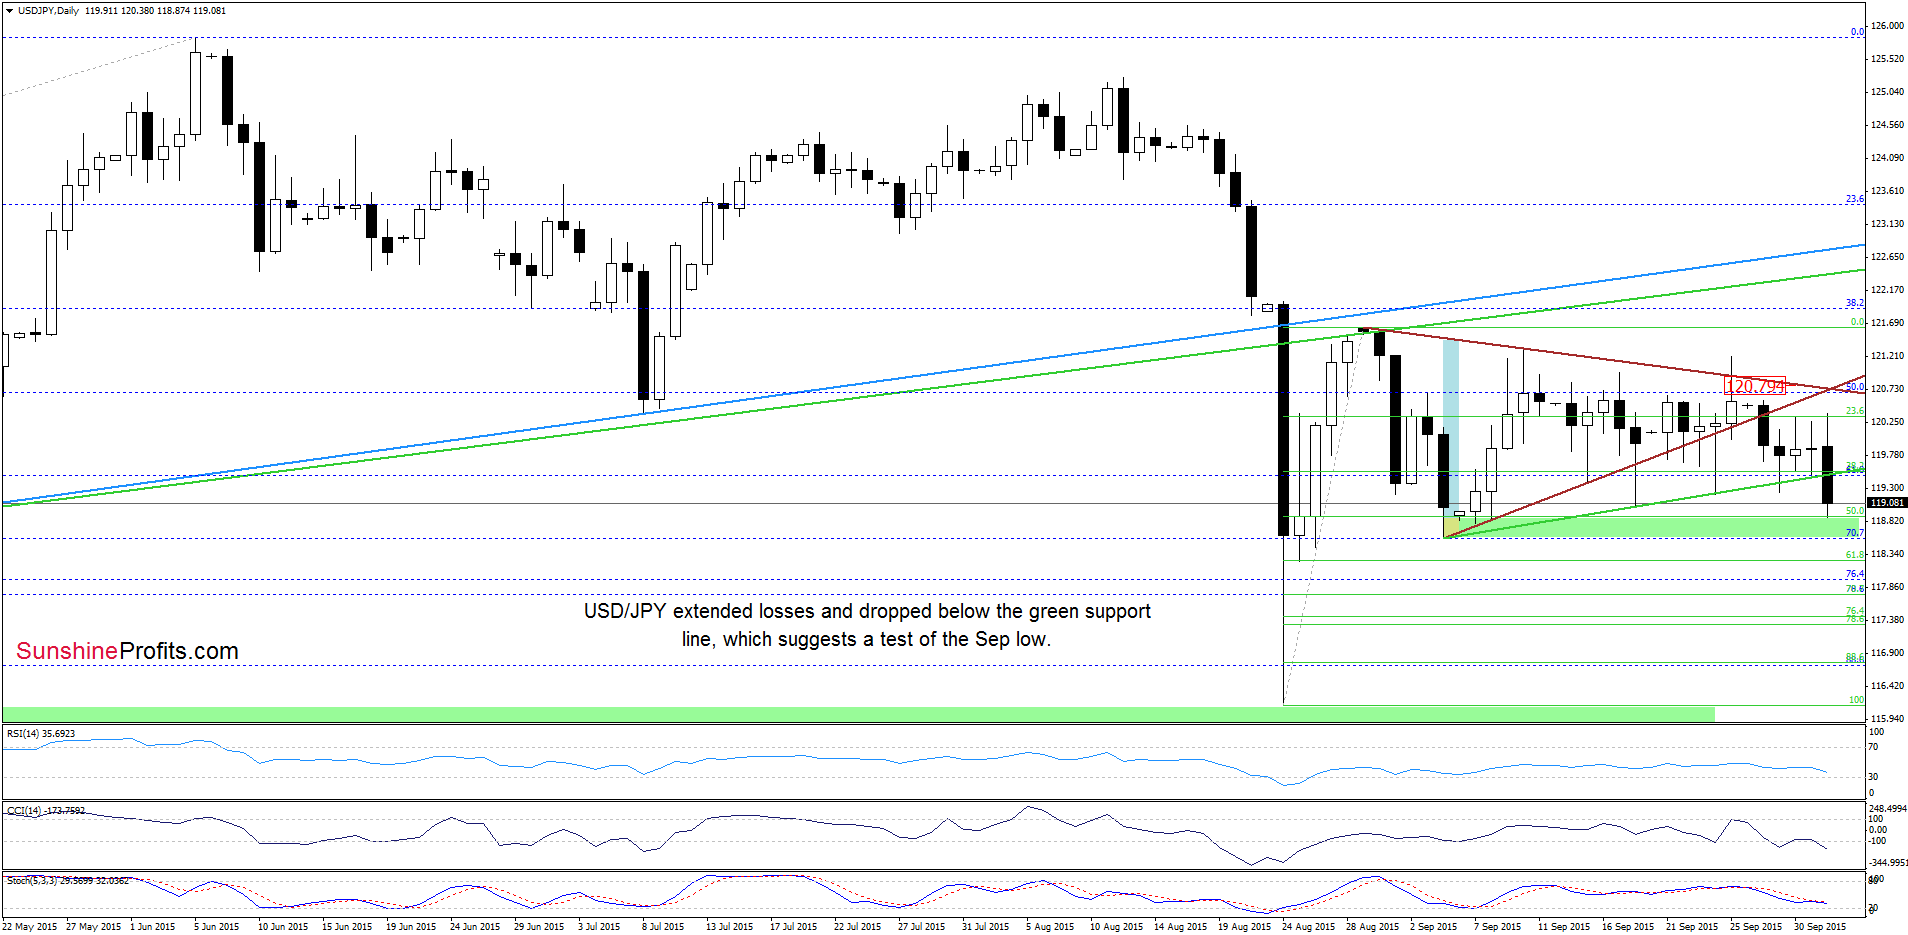
From today’s point of view, we see that currency bears pushed USD/JPY under the green support line, which is a negative signal that suggests a test of the Sep lows. If the green support zone withstood the selling pressure, we’ll see a rebound and an attempt to come back above the green line. However, if it is broken, we may see a drop to around 118.25, where the 61.8% Fibonacci retracement is.
Very short-term outlook: mixed with bearish bias
Short-term outlook: mixed
MT outlook: mixed
LT outlook: mixed
Trading position (short-term; our opinion): No positions are justified from the risk/reward perspective at the moment. We will keep you informed should anything change, or should we see a confirmation/invalidation of the above.
USD/CAD
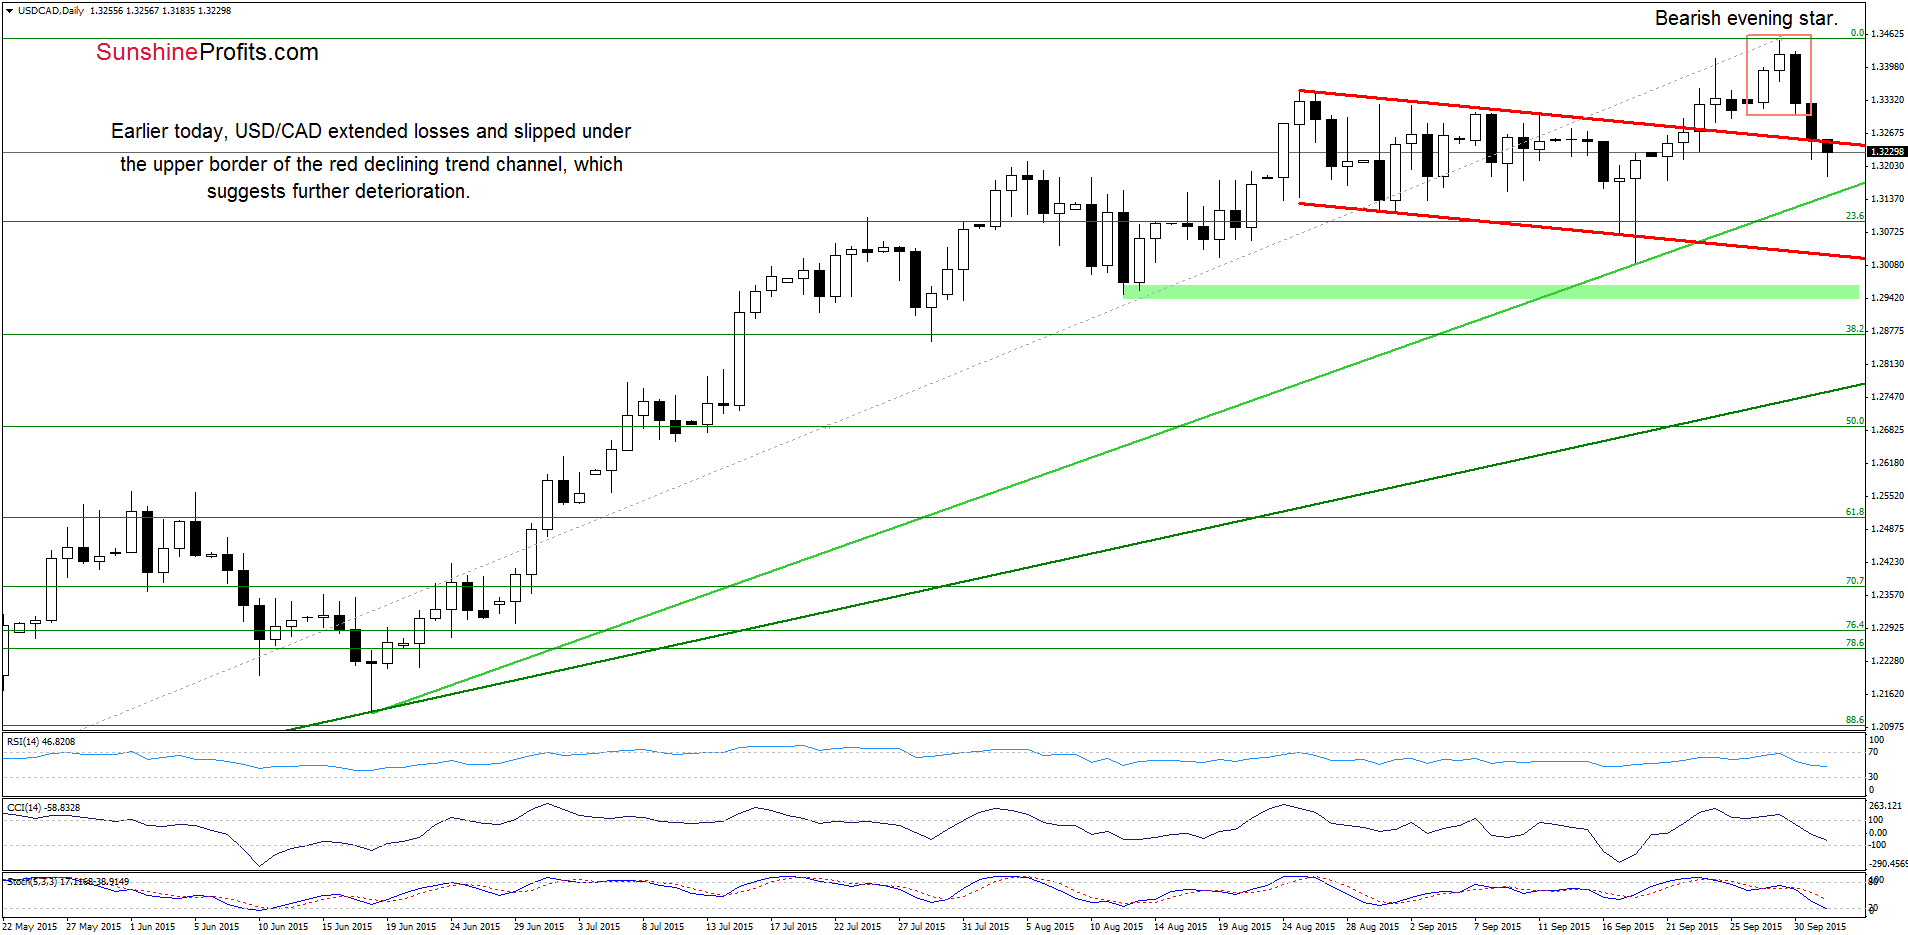
Looking at the charts we see that USD/CAD extended losses and slipped under the upper border of the declining red trend channel, which is a negative sign that suggests further declines. Nevertheless, this scenario would be more reliable if we see a daily closure under this resistance. In we see such price action, the initial downside target would be around 1.3145, where the upper green support line is.
Very short-term outlook: mixed with bearish bias
Short-term outlook: mixed
MT outlook: mixed
LT outlook: mixed
Trading position (short-term; our opinion): No positions are justified from the risk/reward perspective at the moment. We will keep you informed should anything change, or should we see a confirmation/invalidation of the above.
USD/CHF
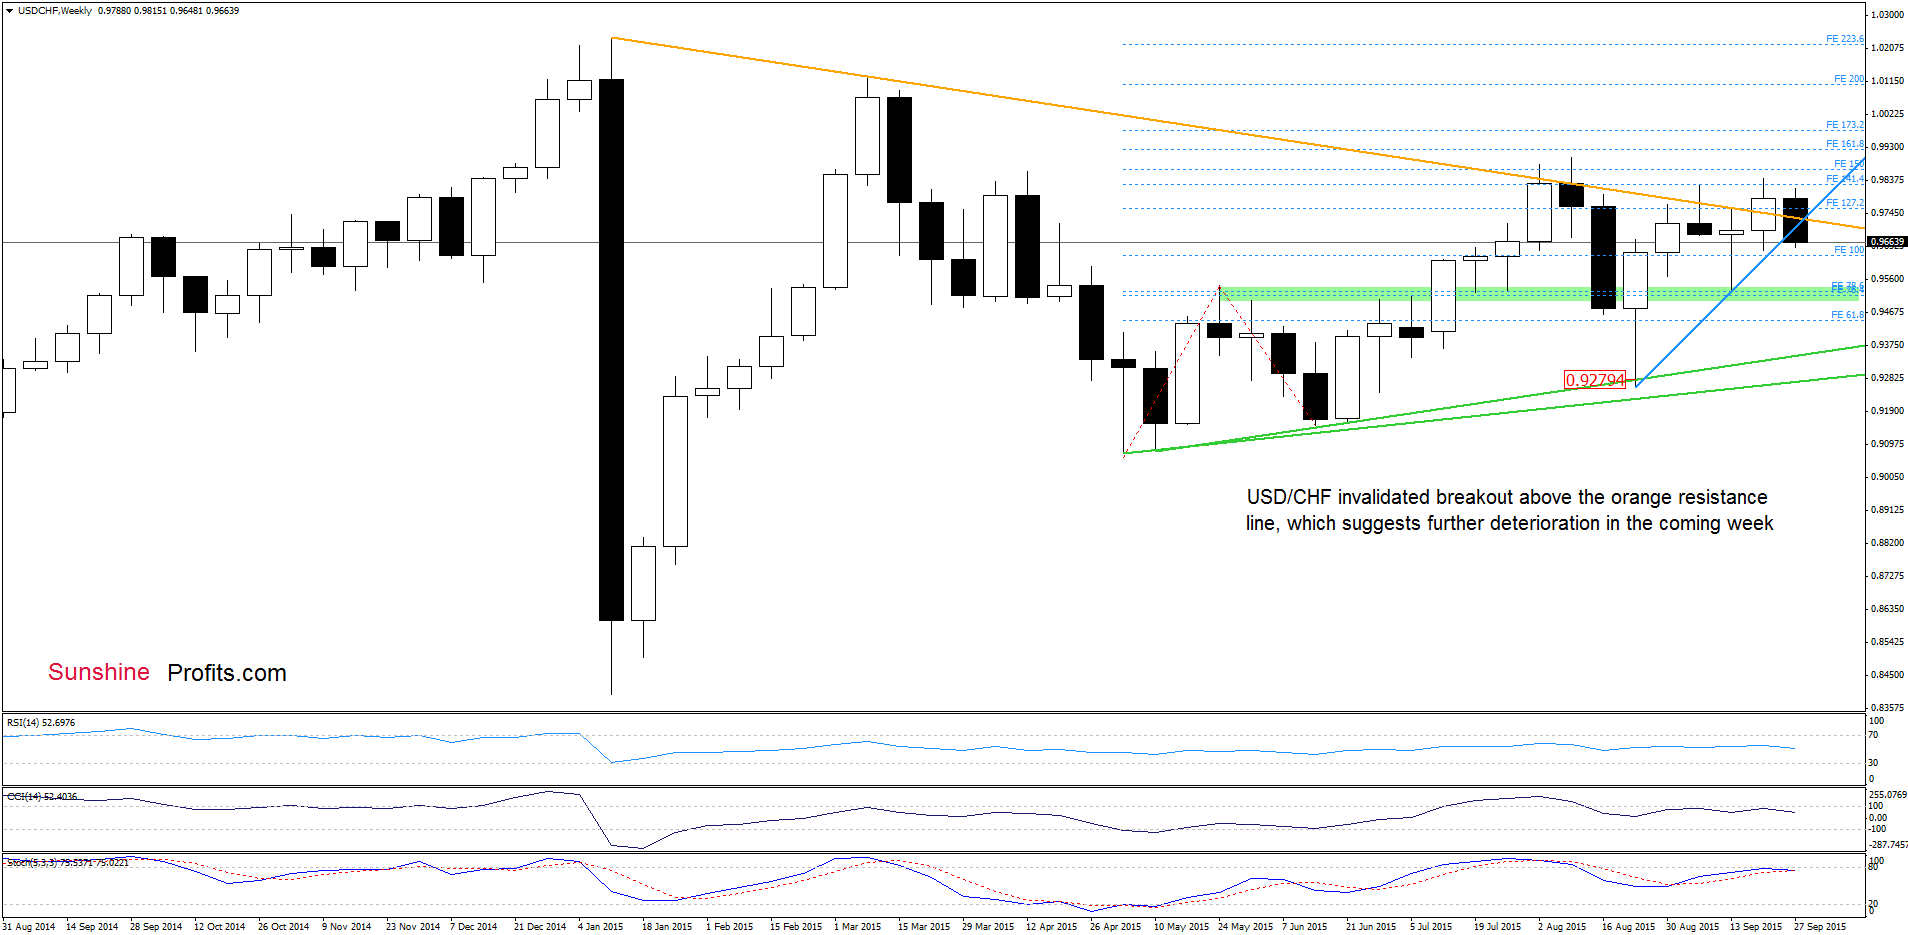
The situation has deteriorated as USD/CHF moved sharply lower, invalidating earlier breakout above the previously-broken orange support/resistance line. If the pair closes the week below this line, it would be a bearish signal, which will likely translate to lower values of the exchange rate in the coming week.
Having said that, let’s take a closer look at the daily chart.
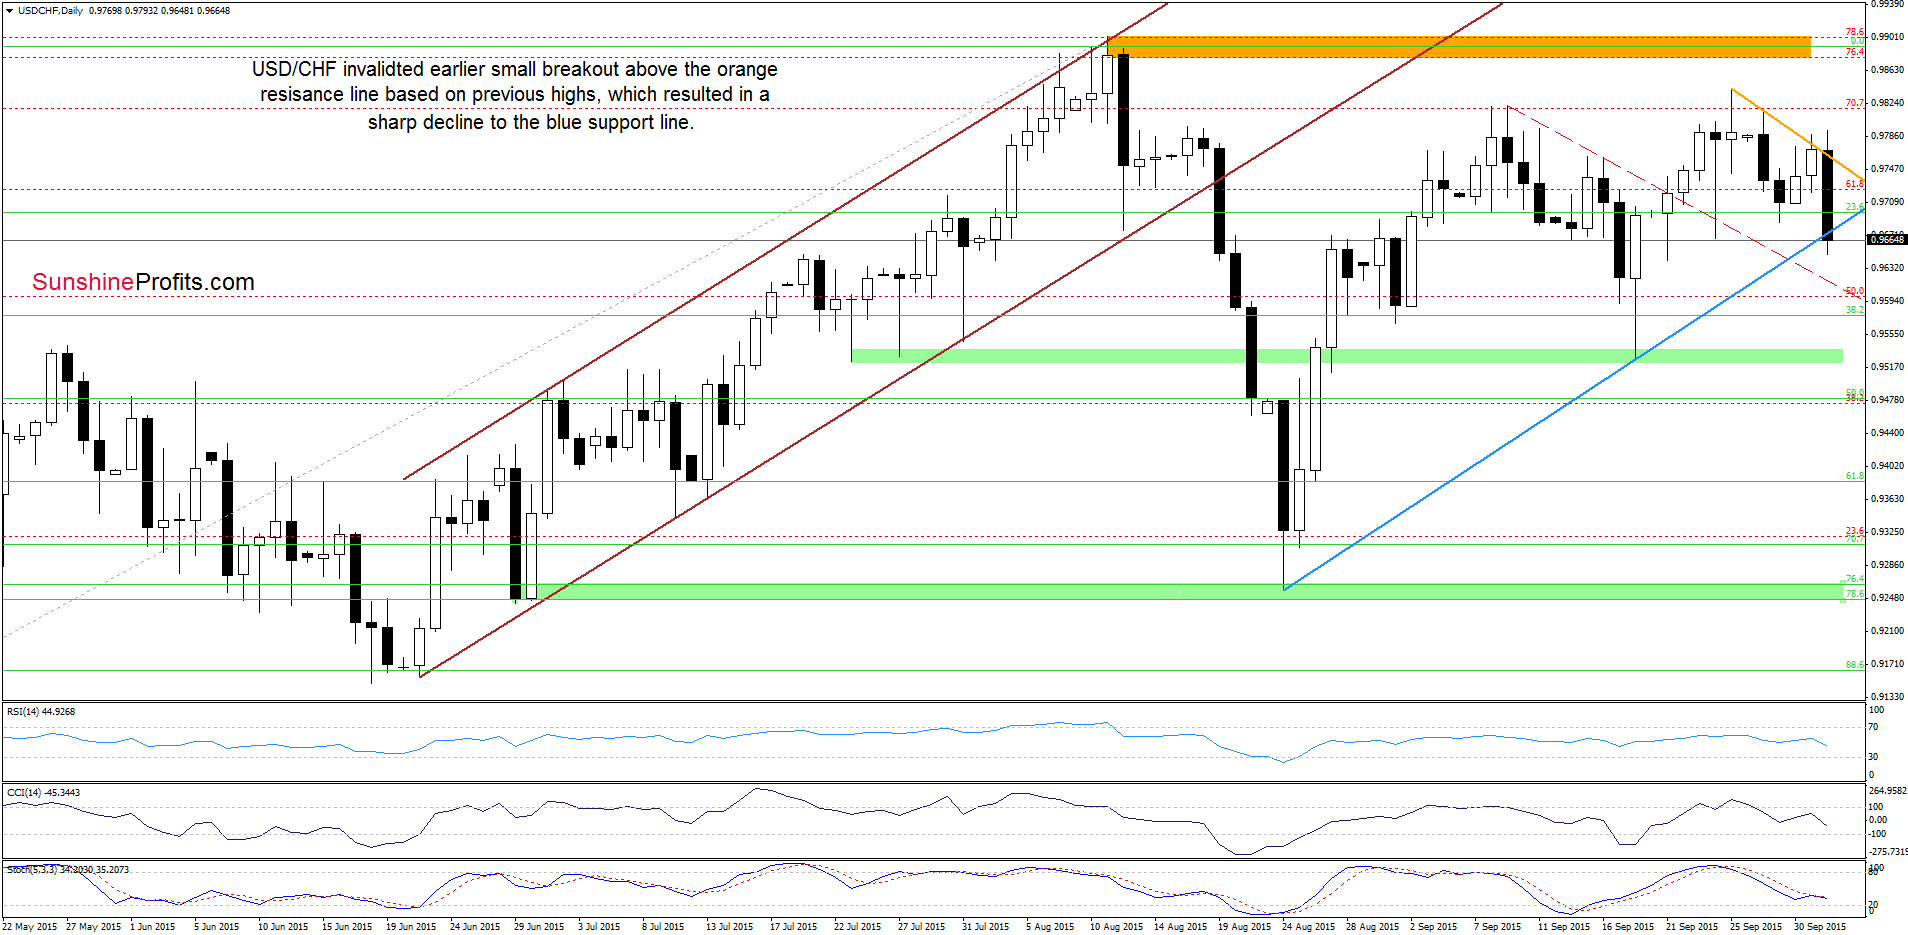
Earlier today, USD/CHF reversed and invalidated small breakout above the orange resistance line based on the previous highs. This negative event encouraged currency bears to act, which translated into a sharp decline that took the exchange rate to the blue rising support line. If it withstands the selling pressure, we’ll see another test of the orange line. However if the pair closes today’s session below it, we may see a drop even to the green support zone based on the Sep low.
Very short-term outlook: mixed
Short-term outlook: mixed
MT outlook: mixed
LT outlook: mixed
Trading position (short-term; our opinion): No positions are justified from the risk/reward perspective at the moment. We will keep you informed should anything change, or should we see a confirmation/invalidation of the above.
AUD/USD
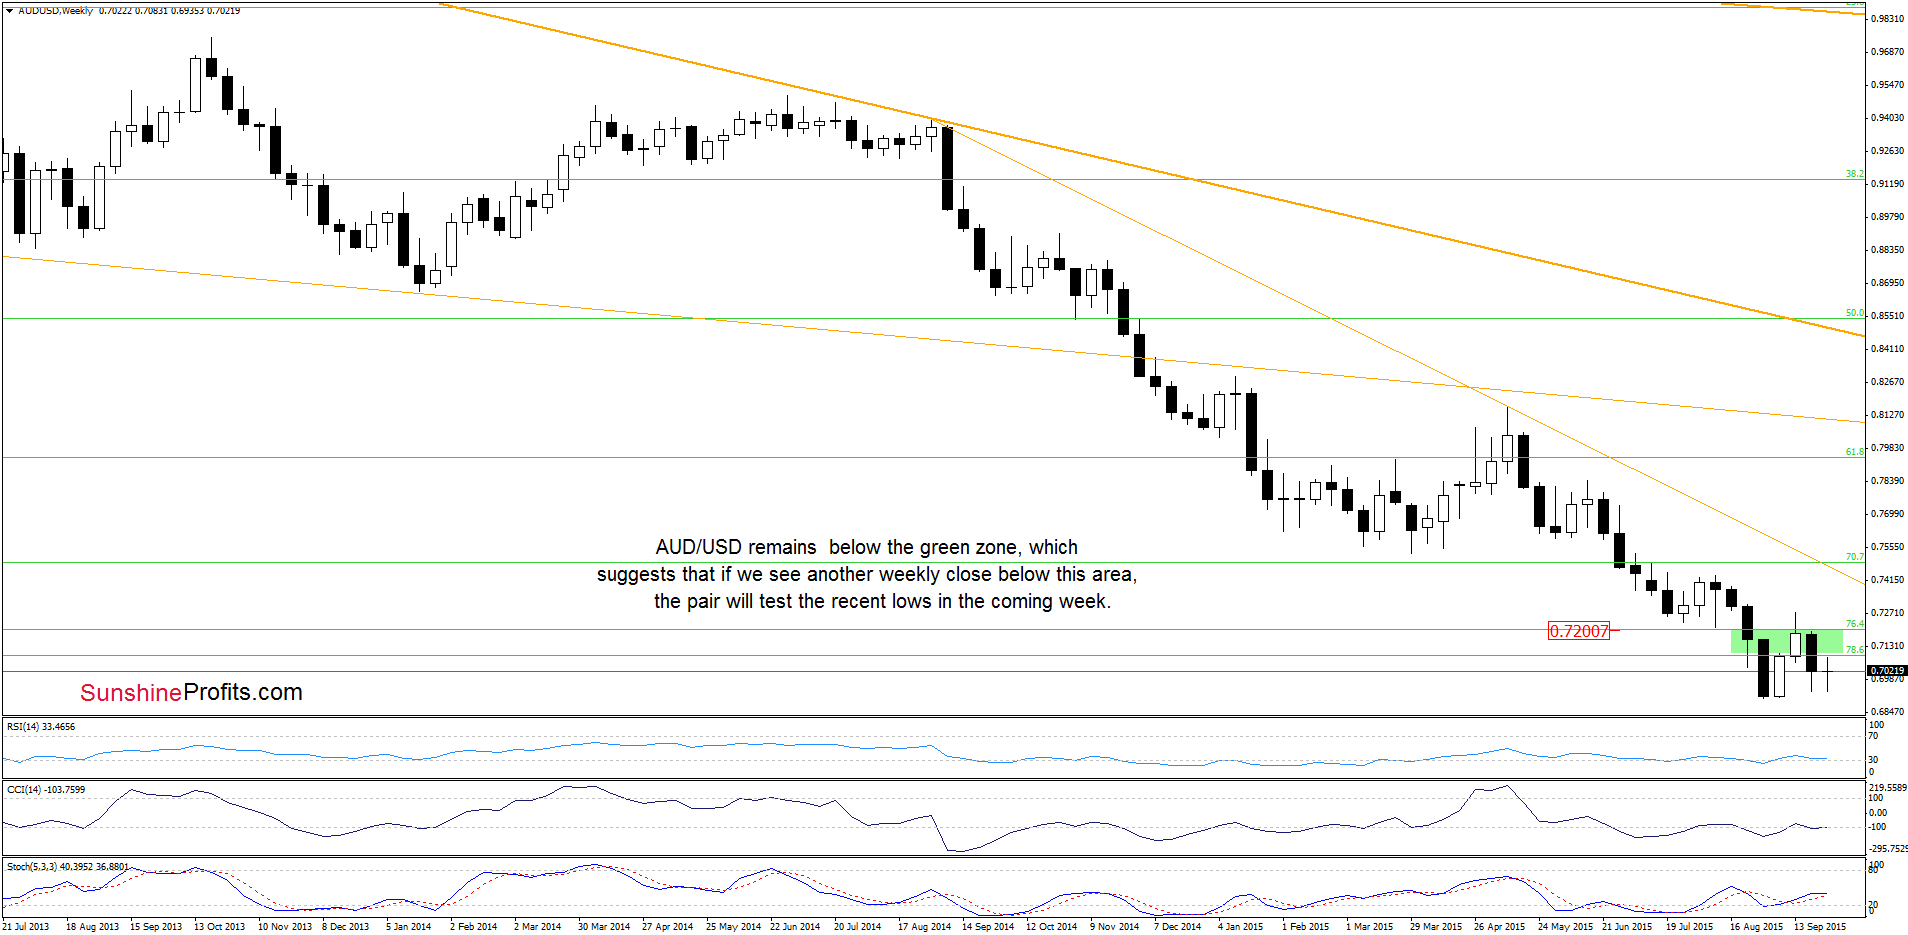
The situation in the medium-term hasn’t changed much as AUD/USD it trading below the previously-broken green zone. Today, we’ll focus on the very short-term changes.
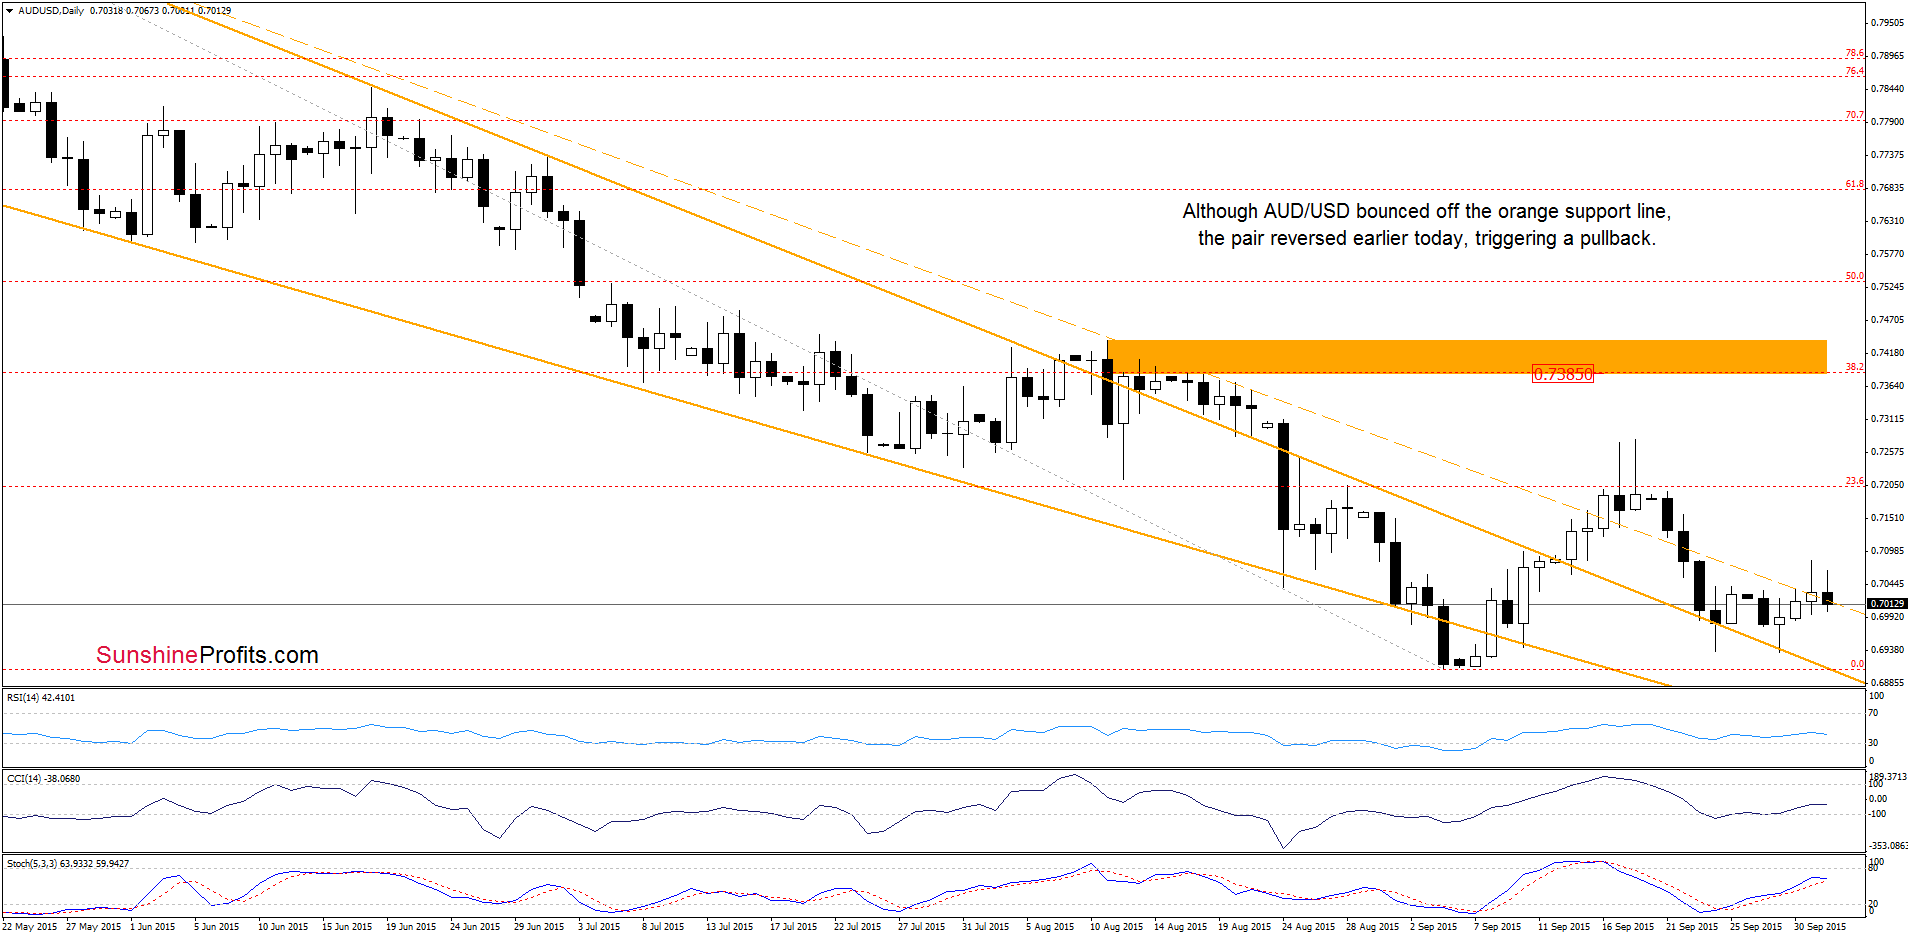
Looking at the daily chart, we see that the upper border of the declining orange wedge triggered a rebound, which took AUD/USD above the orange dashed line. Despite this move, the pair pulled back earlier today, which suggests that currency bears will try to close today’s session under this support. Nevertheless, buy signals generated by the indicators remain in place, which could trigger another rebound in the coming week. Finishing today’s commentary on this currency pair, please note that we still believe that as long as there is no daily closure above the 23.6% Fibonacci retracement and an invalidation of the breakdown under the medium-term green zone, a sizable rally is not likely to be seen and another downswing can’t be ruled out.
Very short-term outlook: mixed
Short-term outlook: mixed
MT outlook: mixed
LT outlook: mixed
Trading position (short-term; our opinion): No positions are justified from the risk/reward perspective at the moment. We will keep you informed should anything change, or should we see a confirmation/invalidation of the above.
Thank you.
Nadia Simmons
Forex & Oil Trading Strategist
Przemyslaw Radomski, CFA
Founder, Editor-in-chief
Gold & Silver Trading Alerts
Forex Trading Alerts
Oil Investment Updates
Oil Trading Alerts

