

In yesterday's speech, Fed Chair Janet Yellen fuelled new hopes for a rate hike before the end of the year, which supported the U.S. currency and pushed the USD Index to an intraday high of 96.33. Earlier today, the greenback extended gains and climbed to a fresh Sep high. What impact did this increase have on our six currency pairs? Let’s take a closer look at their charts and find out.
In our opinion the following forex trading positions are justified - summary:
- EUR/USD: short (a stop-loss order at 1.1887; the downside target around 1.0938)
- GBP/USD: none
- USD/JPY: none
- USD/CAD: none
- USD/CHF: none
- AUD/USD: none
EUR/USD
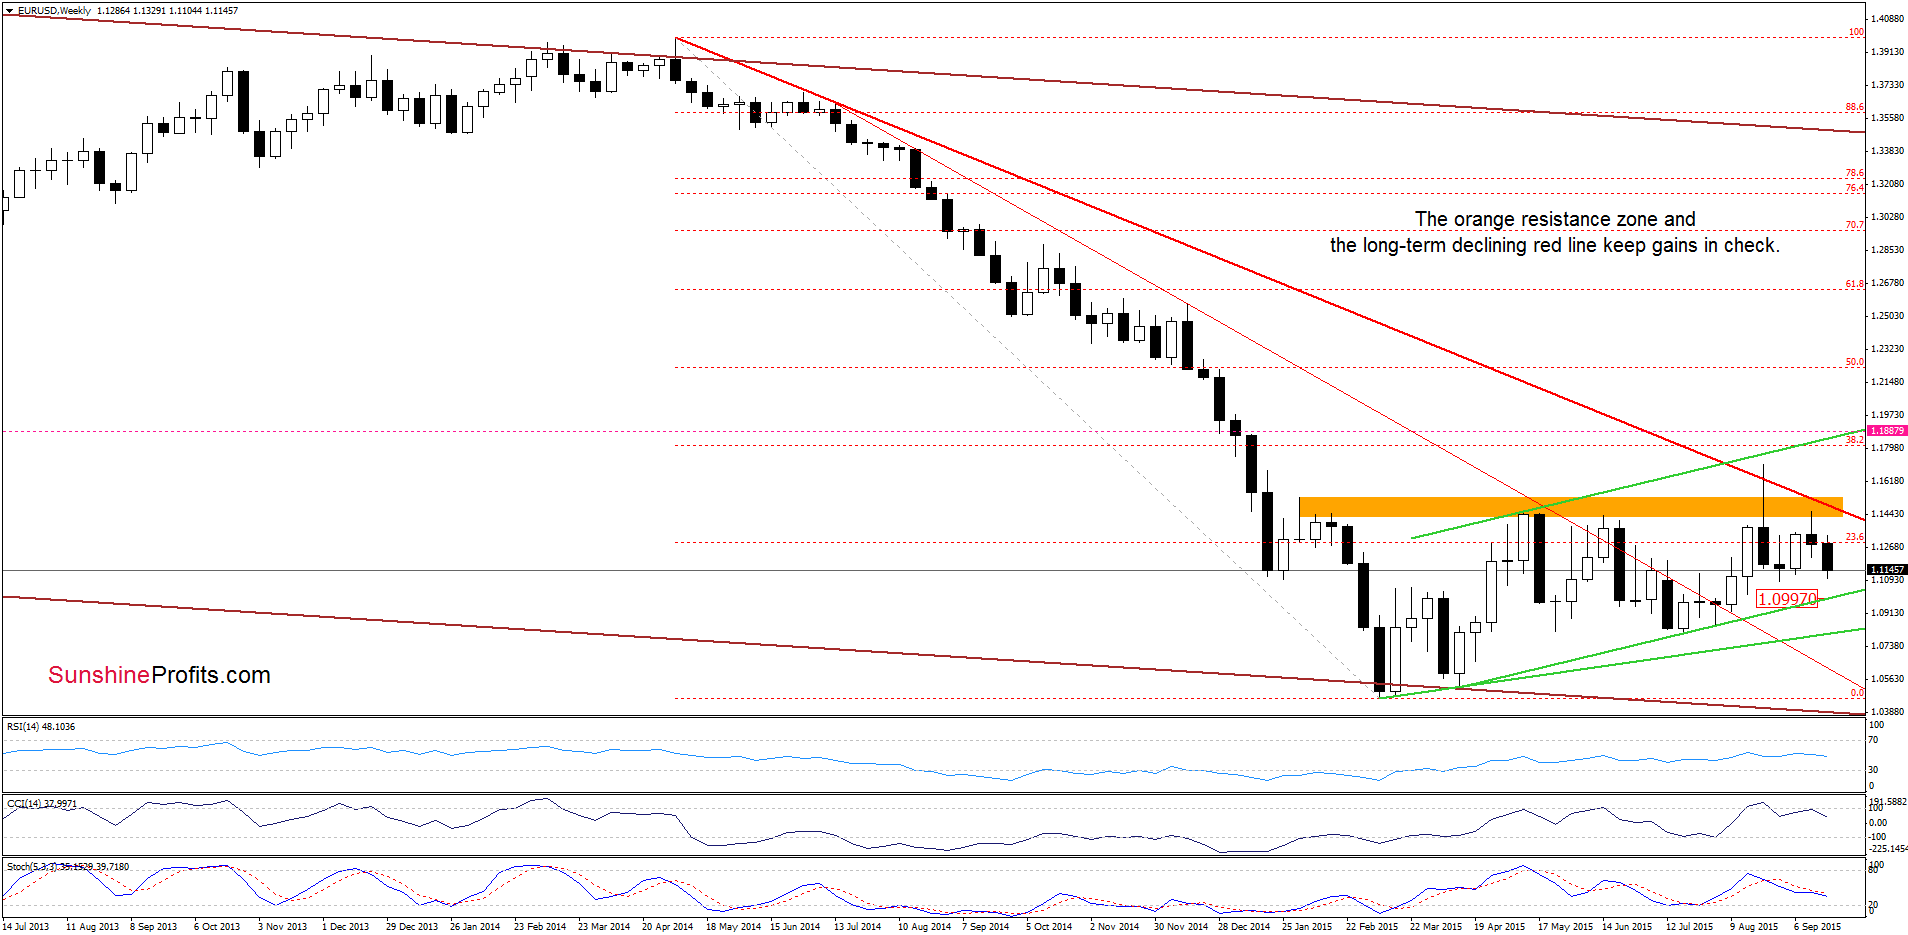
EUR/USD extended losses below the long-term red resistance line and the orange resistance zone, which in combination with sell signals generated by the indicators suggests further deterioration. Additionally, if the pair closes this week under 1.1155, we’ll receive a bearish evening star on the above chart, which will reinforce the orange resistance area, encouraging currency bears to act.
Having said that, let’s examine the daily chart and find out what can we infer from it.
Quoting our yesterday’s alert:
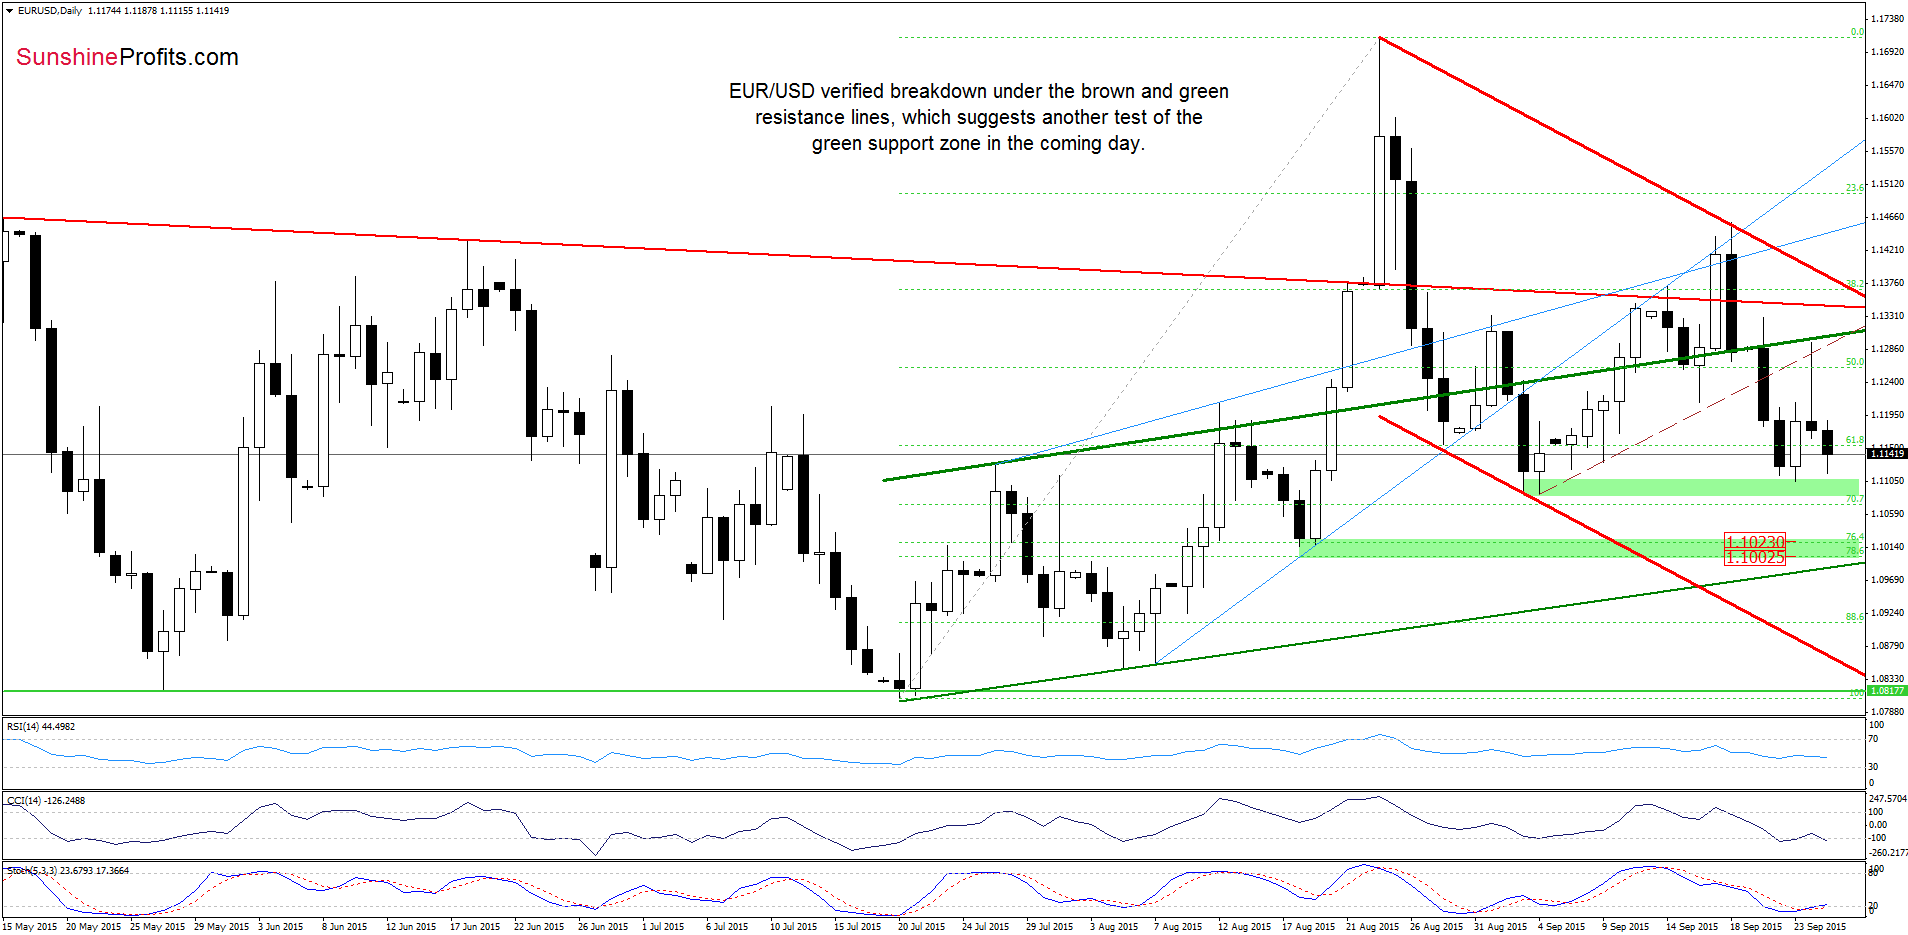
(…) the green support area triggered a rebound, which resulted in a climb above 1.1200. Earlier today, the pair extended yesterday’s increase, but despite this move, EUR/USD is still trading under the previously-broken brown dashed line, the upper border of the rising trend channel and well below the red declining resistance line, which in combination with the medium-term picture suggests that even if the exchange rate moves little higher from here, a sizable rally is questionable – especially when we factor in what we wrote yesterday about the current situation in the USD Index.
Looking at the daily chart, we see that the situation developed in line with the above scenario and EUR/USD reversed after an increase to the brown and green resistance lines. In this way, the exchange rate verified earlier breakdown, which was a bearish signal. Thanks to these circumstances, the pair extended losses earlier today, which means that we’ll see likely see another test of the green support zone in near future. Nevertheless, the medium-term picture suggests that currency bears will try to push EUR/USD lower. If they succeed, the initial downside target would be around 1.100, where the next green support zone (based on the 76.4% and 78.6% Fibonacci retracement levels) is.
Very short-term outlook: bearish
Short-term outlook: bearish
MT outlook: mixed with bearish bias
LT outlook: mixed
Trading position (short-term; our opinion): Short positions with a stop-loss order at 1.1887 are justified from the risk/reward perspective. We will keep you informed should anything change, or should we see a confirmation/invalidation of the above.
GBP/USD
In our previous commentary, we wrote the following:
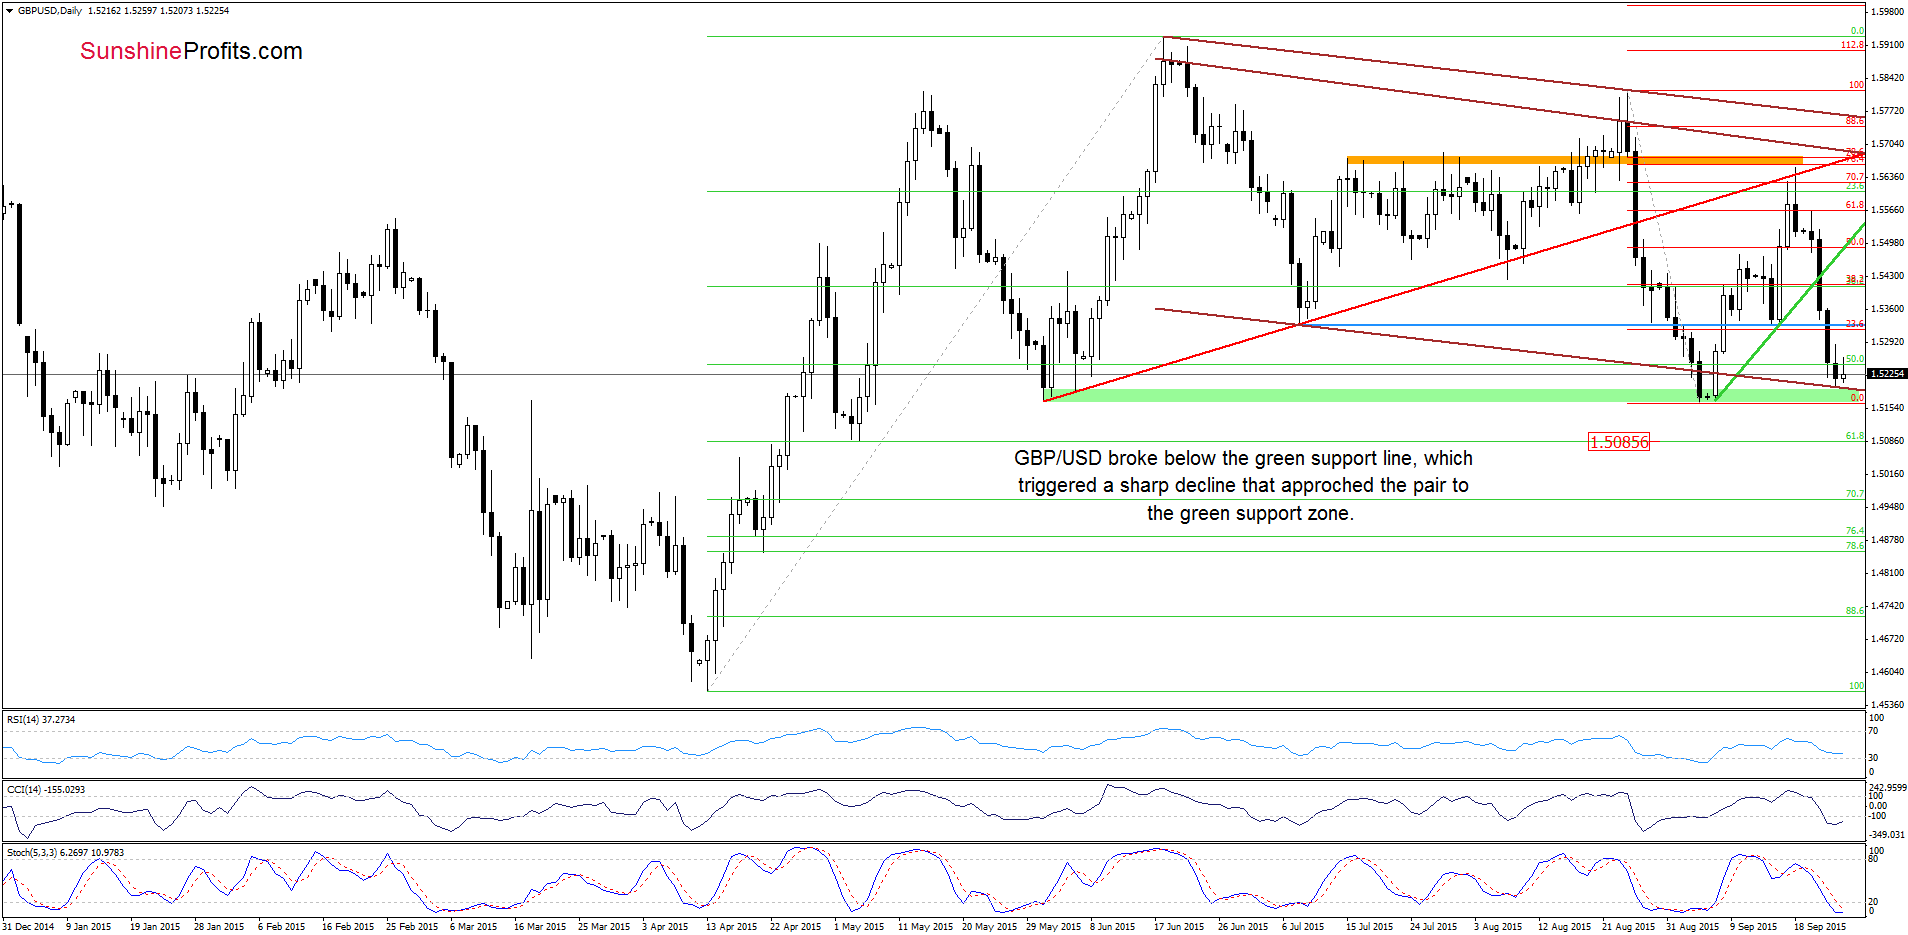
(…) the pair reversed and declined sharply, invalidating earlier small breakout above the red rising resistance line. Earlier today, the exchange rate moved lower once again, which in combination with sell signals generated by the indicators suggests further deterioration. If this is the case, and GBP/USD drops from here, the initial downside target would be around 1.5402, where the green support line based on the previous lows is.
From today’s point of view, we see that currency bears not only took the pair to our initial downside target, but also managed to push GBP/UDS below it. As a result, the current decline accelerated and the exchange rate erased almost all Sep rally, approaching the green support zone. As you see on the chart, in this area is also the lower border of the declining brown channel, which could encourage currency bulls to act. Nevertheless, taking into account that there are no buy signals at the moment, another attempt to move lower can’t be ruled out.
What could happen if GBP/USD broke below the nearest short-term support? Let’s examine the weekly chart and find out.
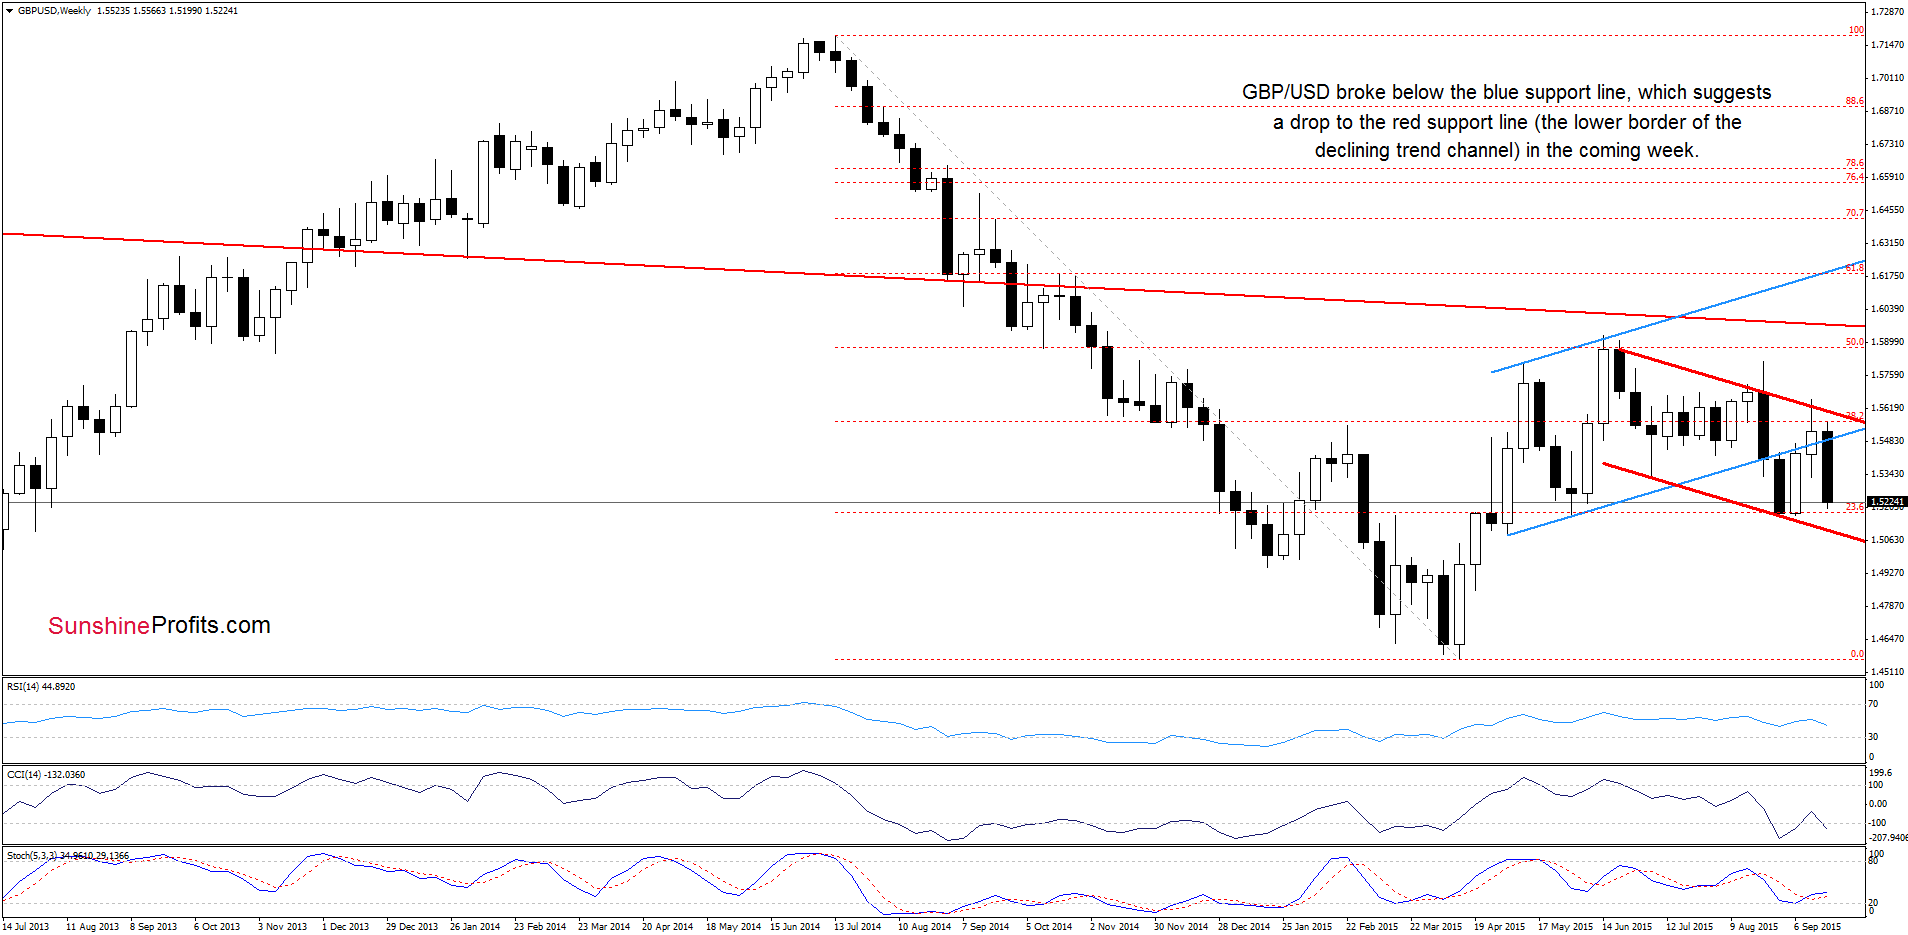
As you see on the above chart, the exchange rate reversed and broke below the blue support line (the lower border of the rising trend channel), which means that our downside target from previous commentary is up-to-date:
(…) we think that if the pair drops below it, we’ll see a test of the Sep low.
Please note that if this support level is broken, the next target would be around 1.5114, where the red declining support line (the lower border of the declining trend channel) is.
Very short-term outlook: mixed with bearish bias
Short-term outlook: mixed with bearish bias
MT outlook: mixed with bearish bias
LT outlook: mixed
Trading position (short-term; our opinion): No positions are justified from the risk/reward perspective at the moment. We will keep you informed should anything change, or should we see a confirmation/invalidation of the above.
USD/JPY
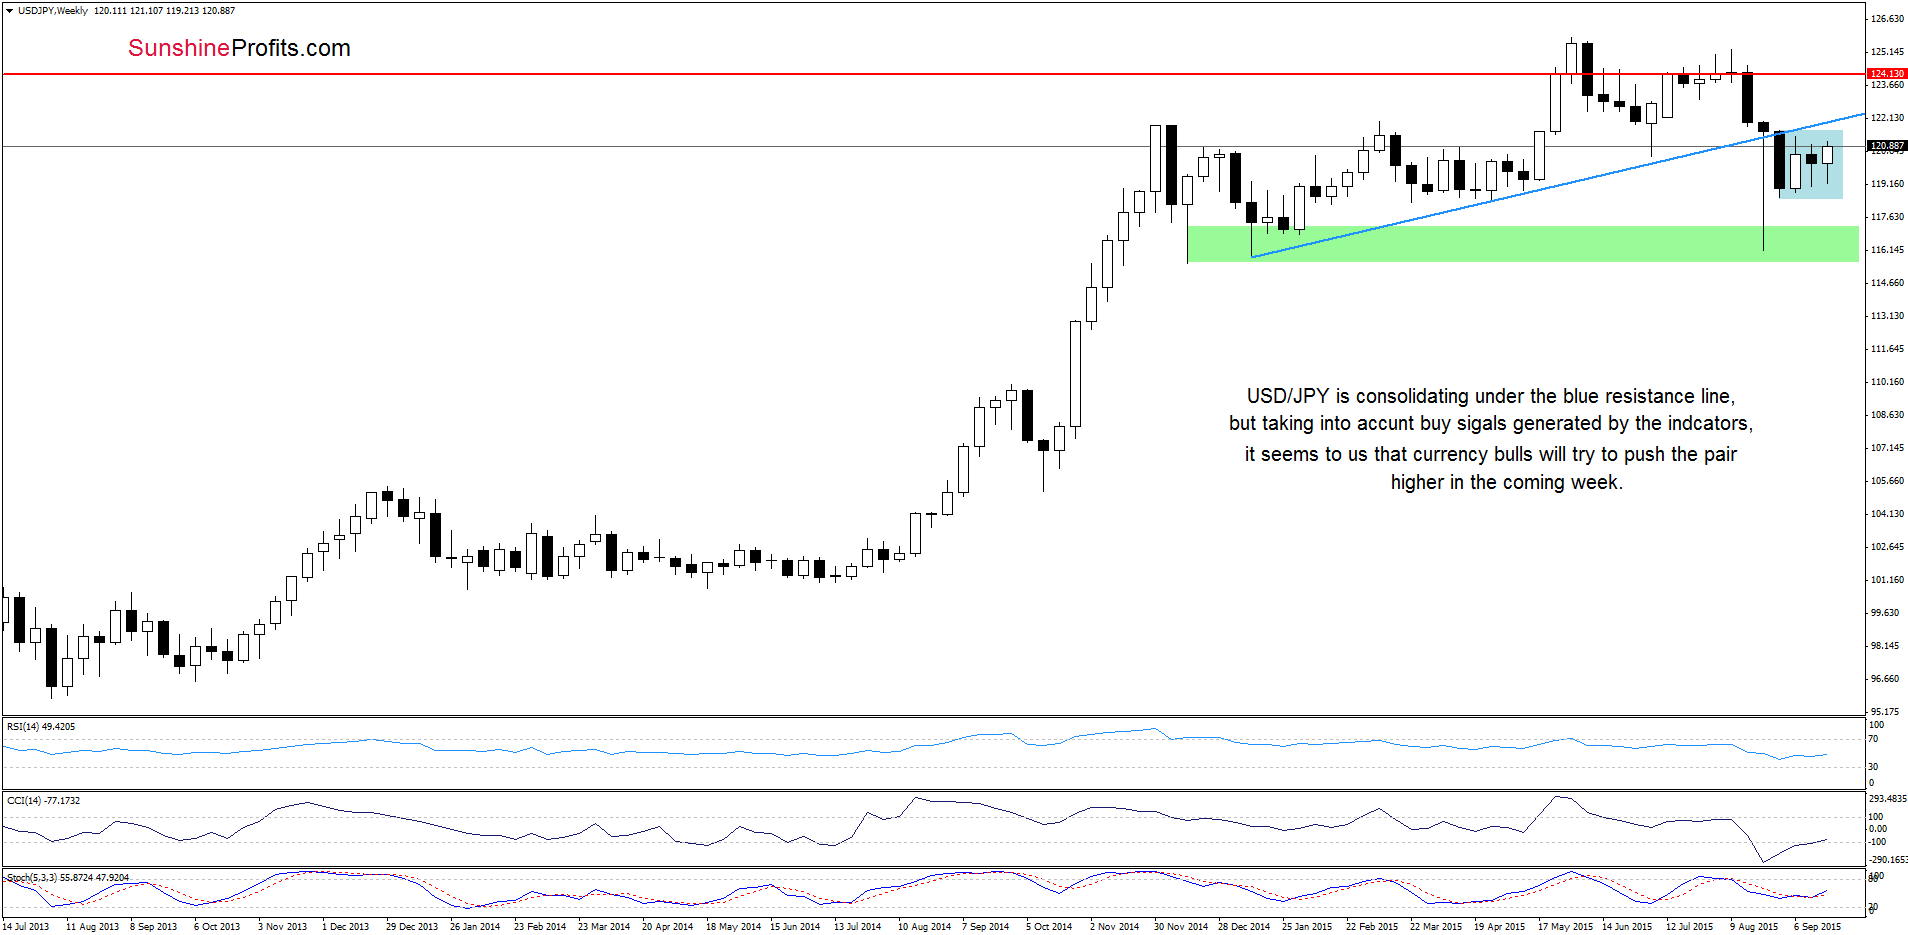
The situation in the medium-term hasn’t changed much as USD/JPY is still trading in the consolidation under the blue resistance line. Nevertheless, taking into account the fact that the CCI and Stochastic Oscillator generated buy signals, it seems t us that currency bulls will try to push the pair higher in the coming week.
Will the daily chart confirm this pro growth scenario? Let’s check.
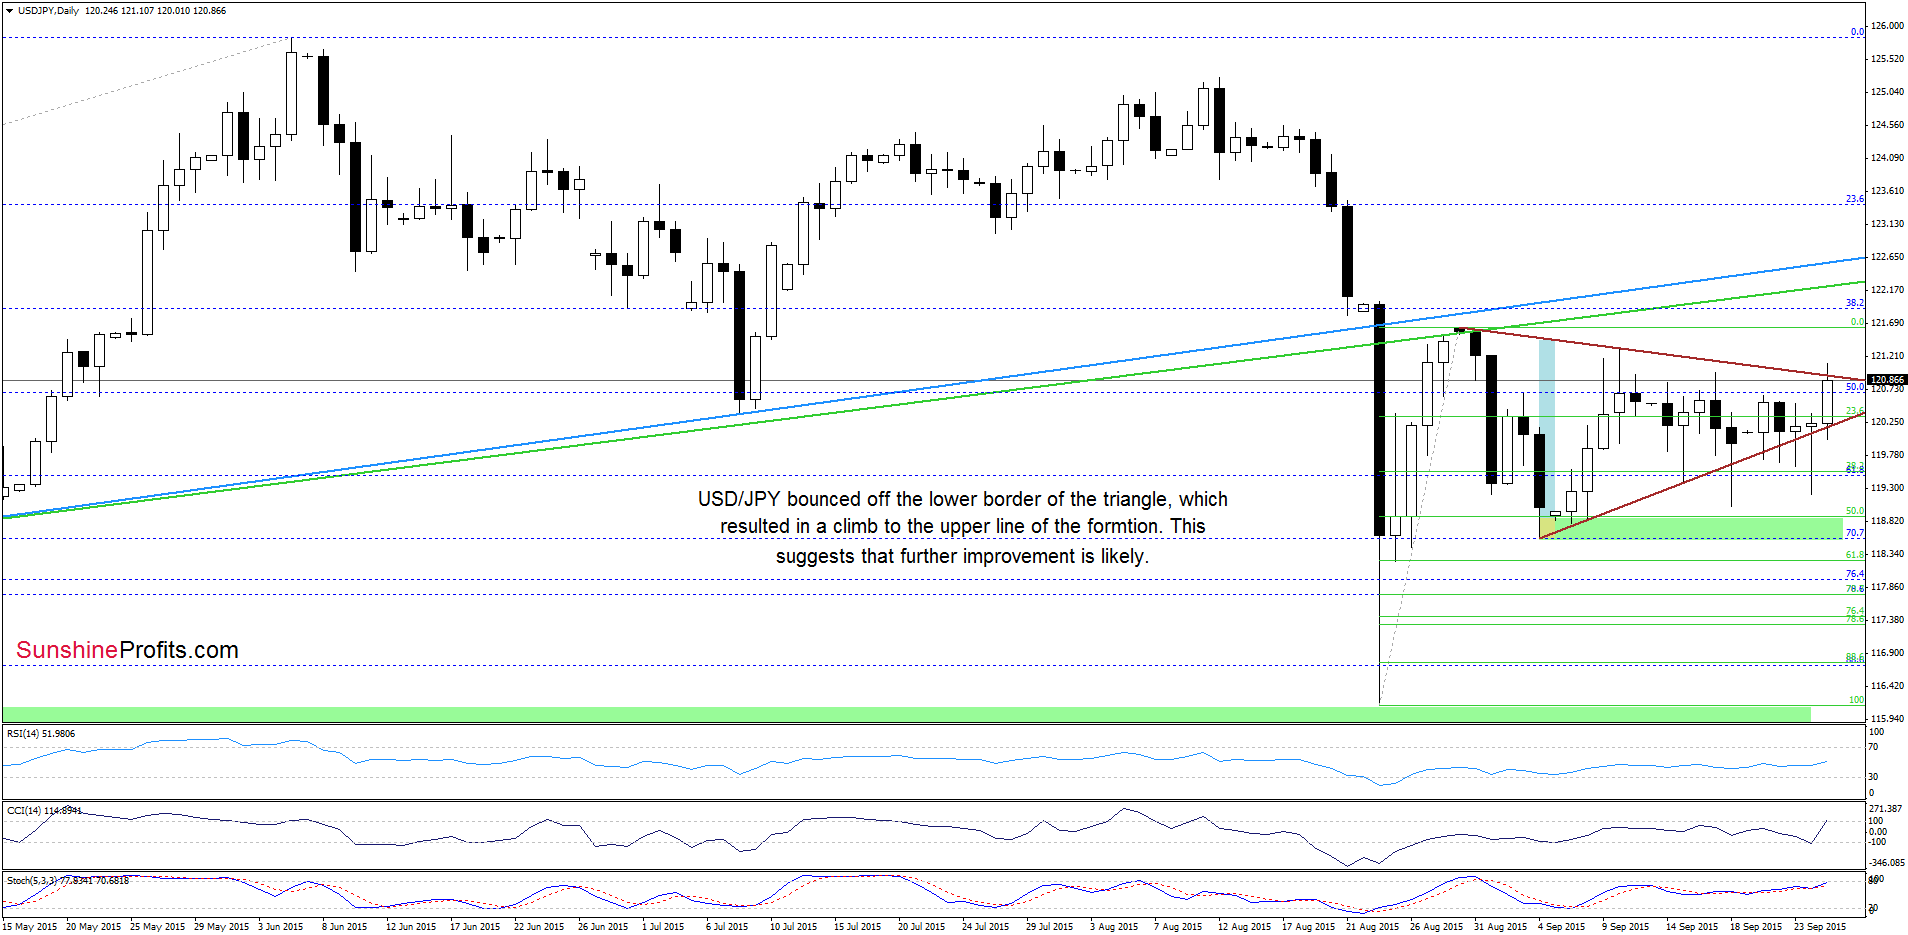
Quoting our yesterday’s alert:
(…) Although the pair re-tested the lower border of the formation several times in recent days, all attempts to move lower failed, which can be considered a positive signal. Nevertheless, the current position of the daily indicators (sell signal are still in play) in combination with the medium-term picture suggests that currency bears will likely try to push the pair lower once again.
Looking at the daily chart, we see that the situation developed in tune with the above scenario and USD/JPY dropped under tested the lower border of the triangle. Despite this deterioration, the pair reversed and invalidated earlier breakdown – similarly to what we saw in previous days. This positive signal triggered further improvement and the pair rebounded to the upper line of the formation. Taking into account buy signals generated by the indicators, we think that currency bulls will try to push the pair higher in the coming day(s). If they succeed, and we’ll see a daily close above the upper line of the triangle, the next upside target would be around 121.64, where the Aug 30 high is.
Very short-term outlook: mixed with bullish bias
Short-term outlook: mixed
MT outlook: mixed
LT outlook: mixed
Trading position (short-term; our opinion): No positions are justified from the risk/reward perspective at the moment. We will keep you informed should anything change, or should we see a confirmation/invalidation of the above.
USD/CAD
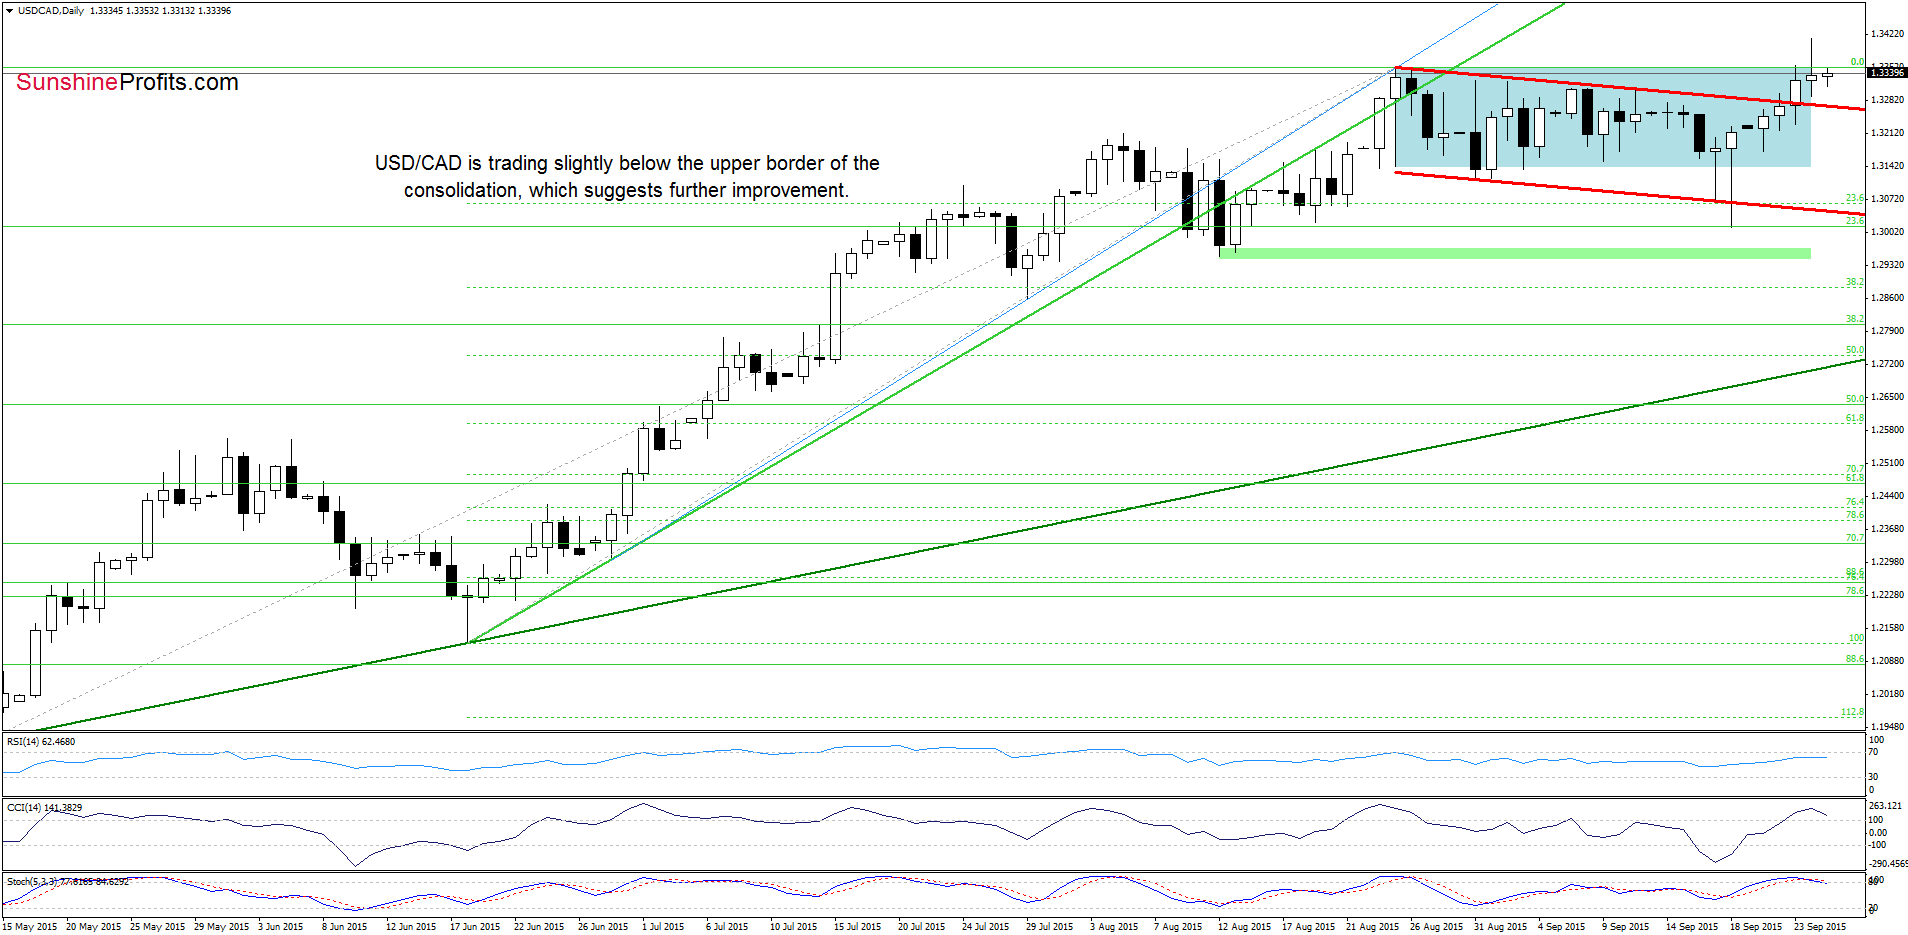
Looking at the daily chart, we see that although USD/CAD broke above the upper border of the consolidation, hitting a fresh 2015 high yesterday, the pair gave up some gains and slipped below the previous high. This is a negative signal, which suggests that we may see a test of the previously-broken red support line (the upper border of the declining trend channel) in the coming days. Nevertheless, as long as there are no sell signals generated by the indicators, another attempt to move higher can’t be ruled out.
How high could the exchange rate go if currency bulls manage to push the pair above the upper border of the consolidation once again? Let’s take a closer look at the weekly chart and find out.
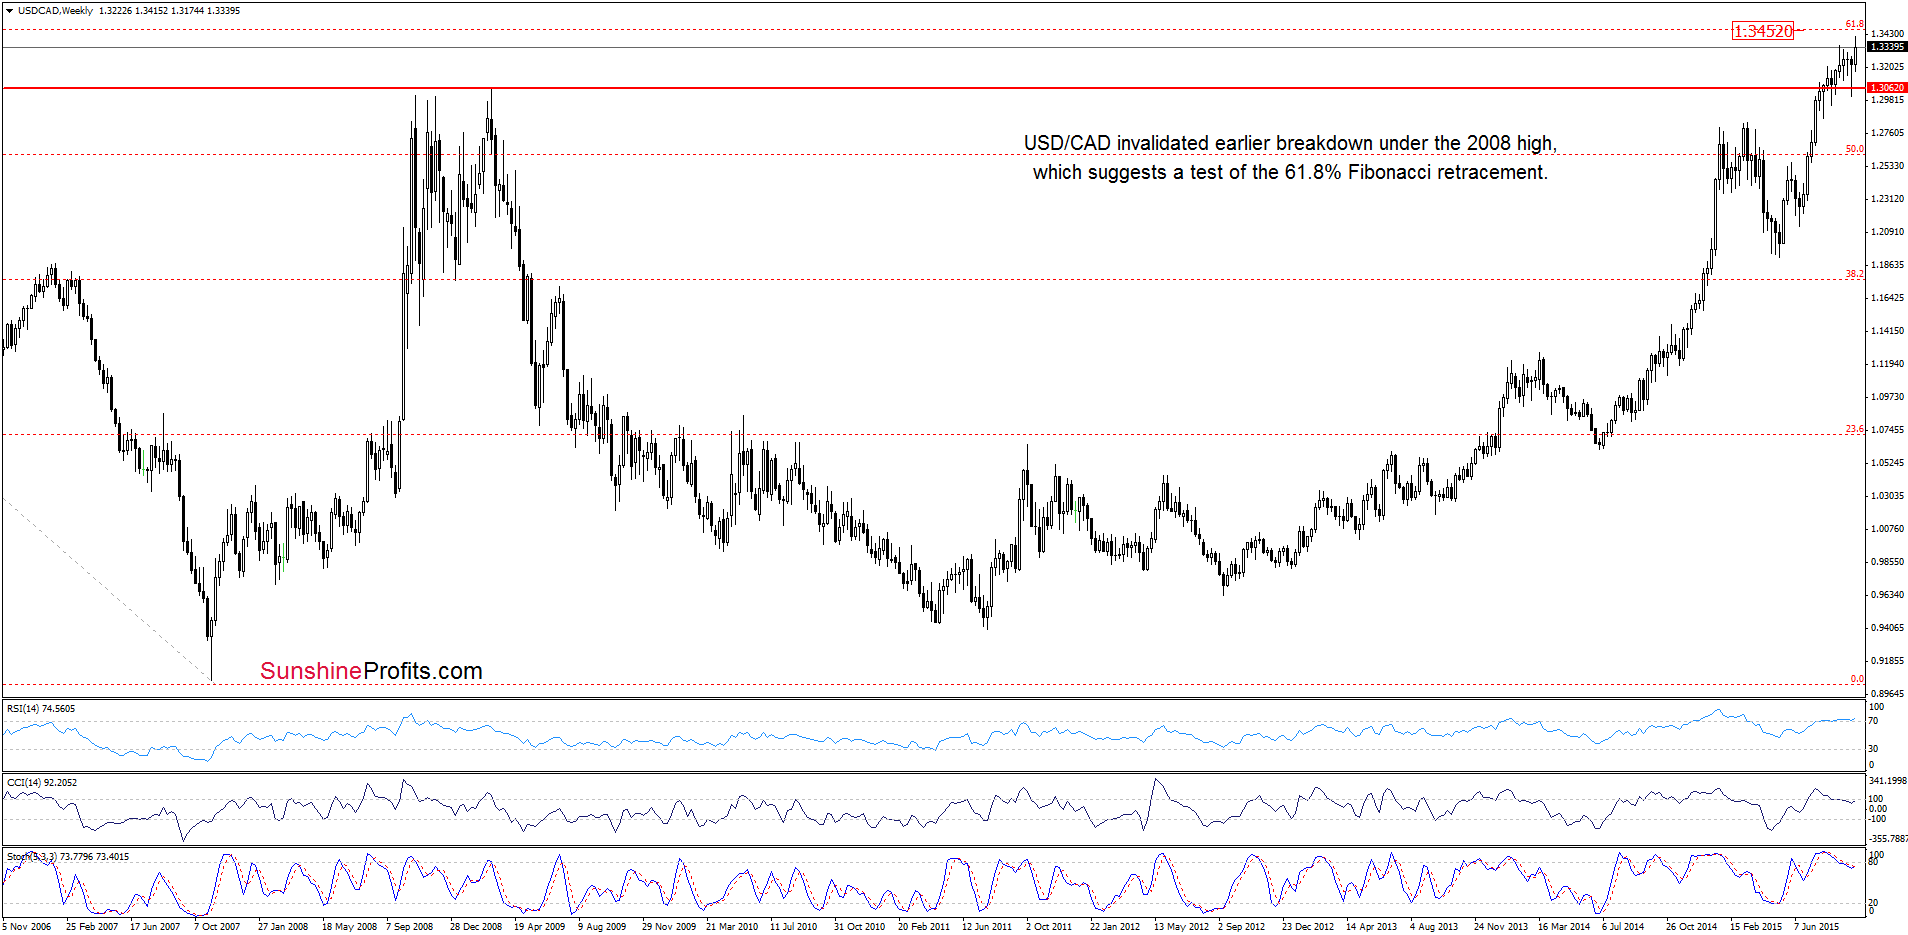
From this perspective, we see that the initial upside target for currency bulls would be around 1.3452, where the 61.8% Fibonacci retracement is (at 1.3444 is also the 127.2% Fibonacci extension based on the Aug-Sep decline). Nevertheless, we should keep in mind that the daily and weekly CCI and Stochastic Oscillator are overbought, while the weekly RSI climbed above the level of 70, which suggests that reversal is just around the corner.
Very short-term outlook: mixed with bullish bias
Short-term outlook: mixed
MT outlook: mixed
LT outlook: mixed
Trading position (short-term; our opinion): No positions are justified from the risk/reward perspective at the moment. We will keep you informed should anything change, or should we see a confirmation/invalidation of the above.
USD/CHF
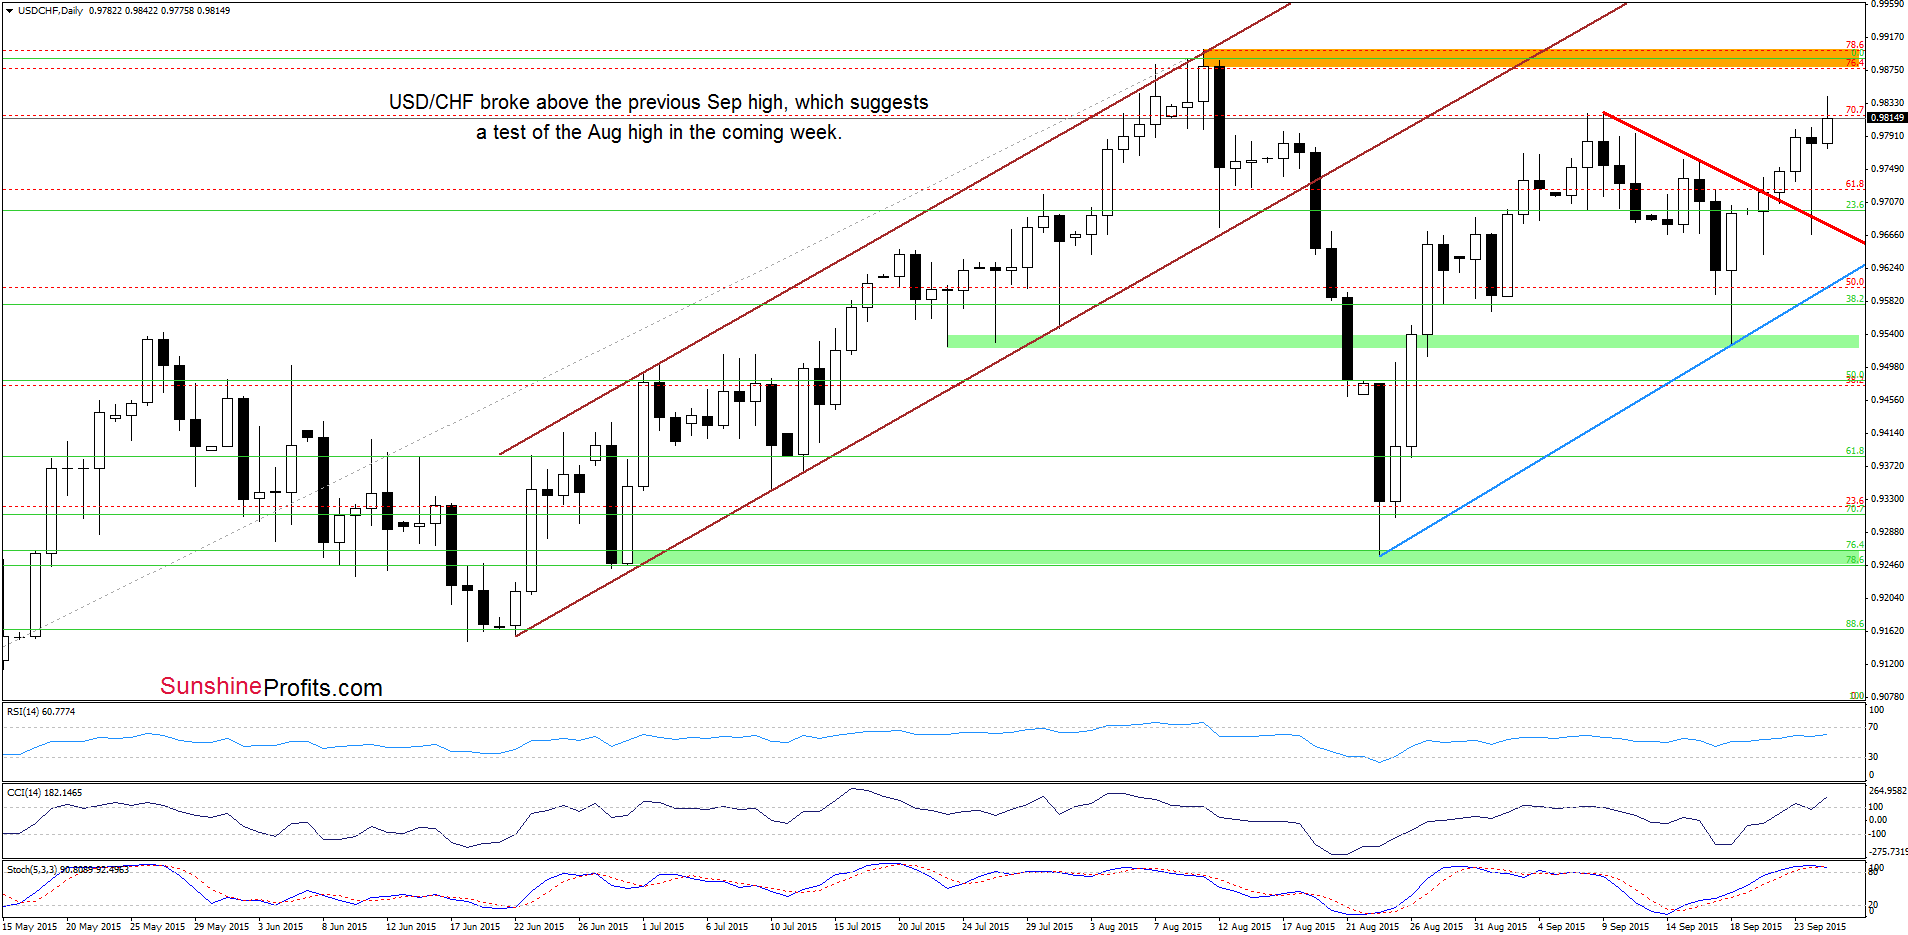
On Tuesday, we wrote the following:
(…) the pair climbed above the red declining resistance line (based on the recent highs), which is a positive signal that suggests further improvement – especially when we factor in buy signals generated by the indicators. In our opinion, if the exchange rate closes today’s session above this line, we’ll see a test of the Sep highs in the coming days.
On the above chart, we see that USD/CHF hit a fresh Sep high earlier today, which is a positive signal that suggests a test of the Aug high in the coming week.
Did this increase have any impact on the medium-term picture? Let’s check.
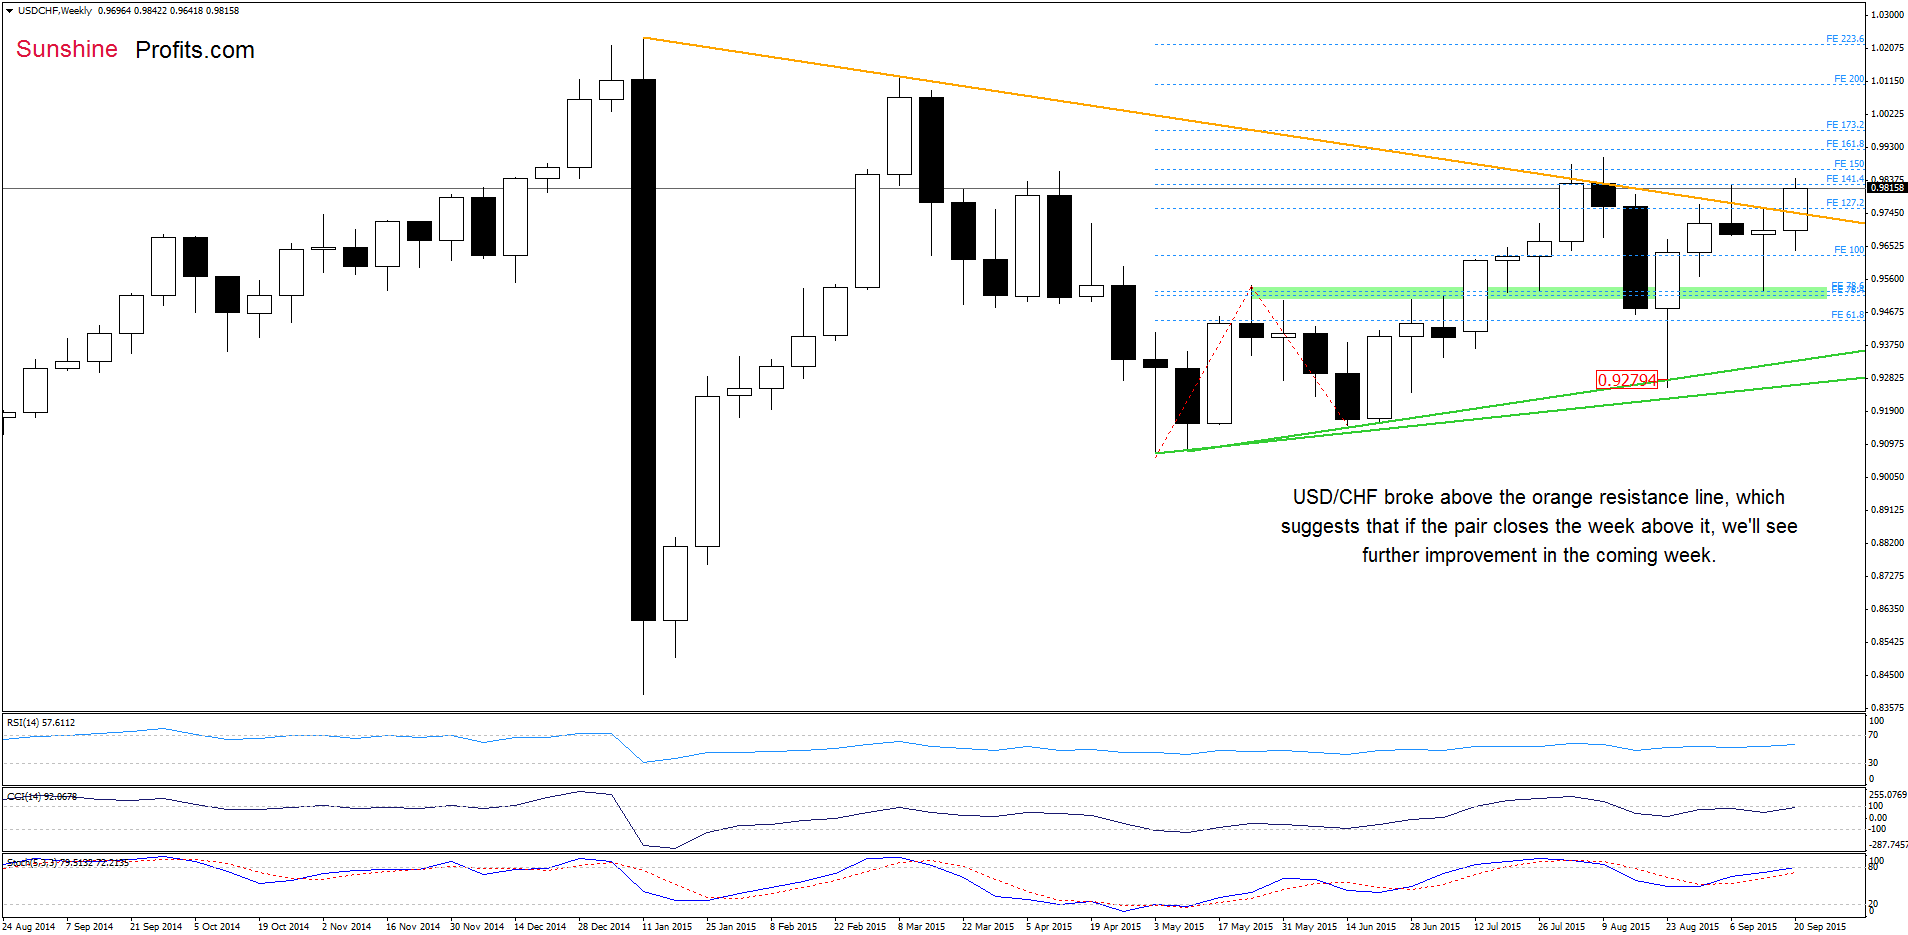
Looking at the weekly chart, we see that USD/CHF broke above the orange resistance line once again, which suggests further improvement. Nevertheless, taking into account what we saw in previous weeks, we believe that another upward move will be more likely and reliable if we see a weekly close above this key support/resistance line.
Very short-term outlook: mixed with bullish bias
Short-term outlook: mixed
MT outlook: mixed
LT outlook: mixed
Trading position (short-term; our opinion): No positions are justified from the risk/reward perspective at the moment. We will keep you informed should anything change, or should we see a confirmation/invalidation of the above.
AUD/USD
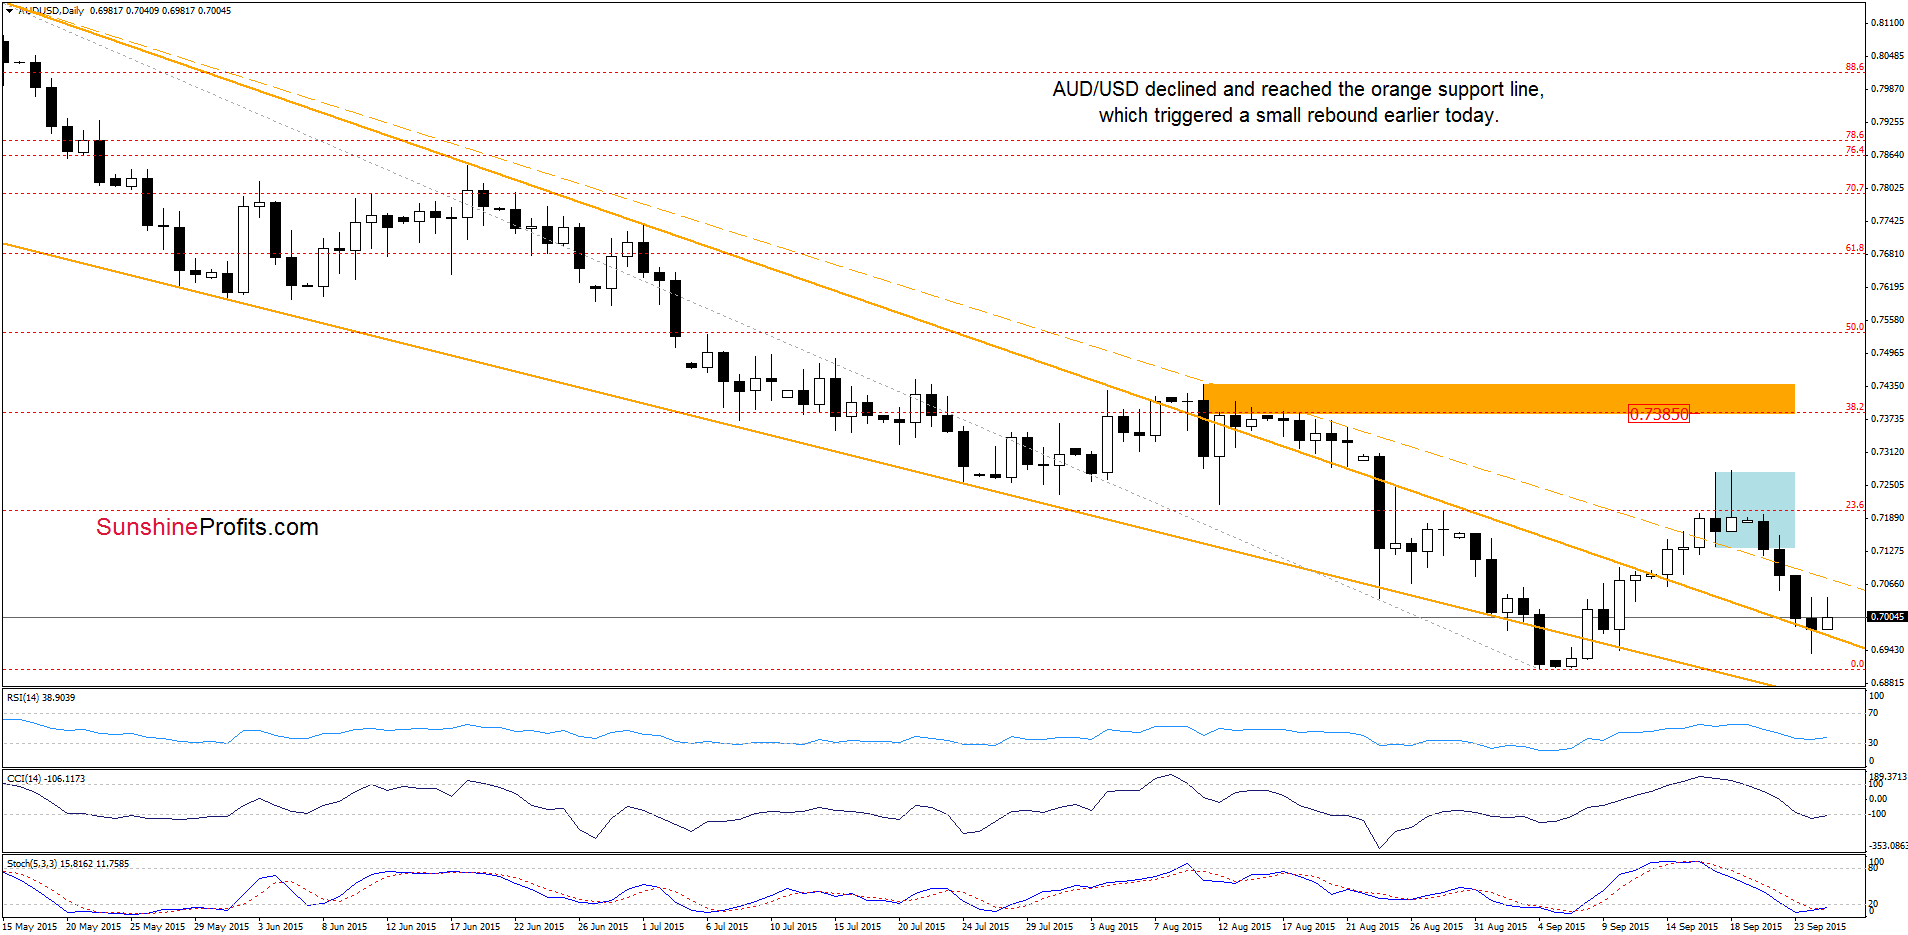
Quoting our last commentaryon this currency pair:
(…) AUD/USD invalidated earlier breakout above the 23.6% Fibonacci retracement, which is a negative signal. Additionally, the CCI and Stochastic Oscillator generated sell signals, which in combination with the medium-term picture suggests lower values of the exchange rate in the coming week. If the pair declines from here, the initial downside target would be the previously-broken orange dashed line or even the upper border of the declining orange wedge.
From today’s point of view, we see that the situation developed in line with the above scenario and AUD/USD reached our downside targets. As you see on the daily chart, the upper border of the declining orange wedge triggered a rebound earlier today, but taking into account the size of today’s candlestick (at least at the moment when these words are written), it seems that the worst is not behind currency bulls. Why? We think that the best answer to this question will be the current situation in the medium term.
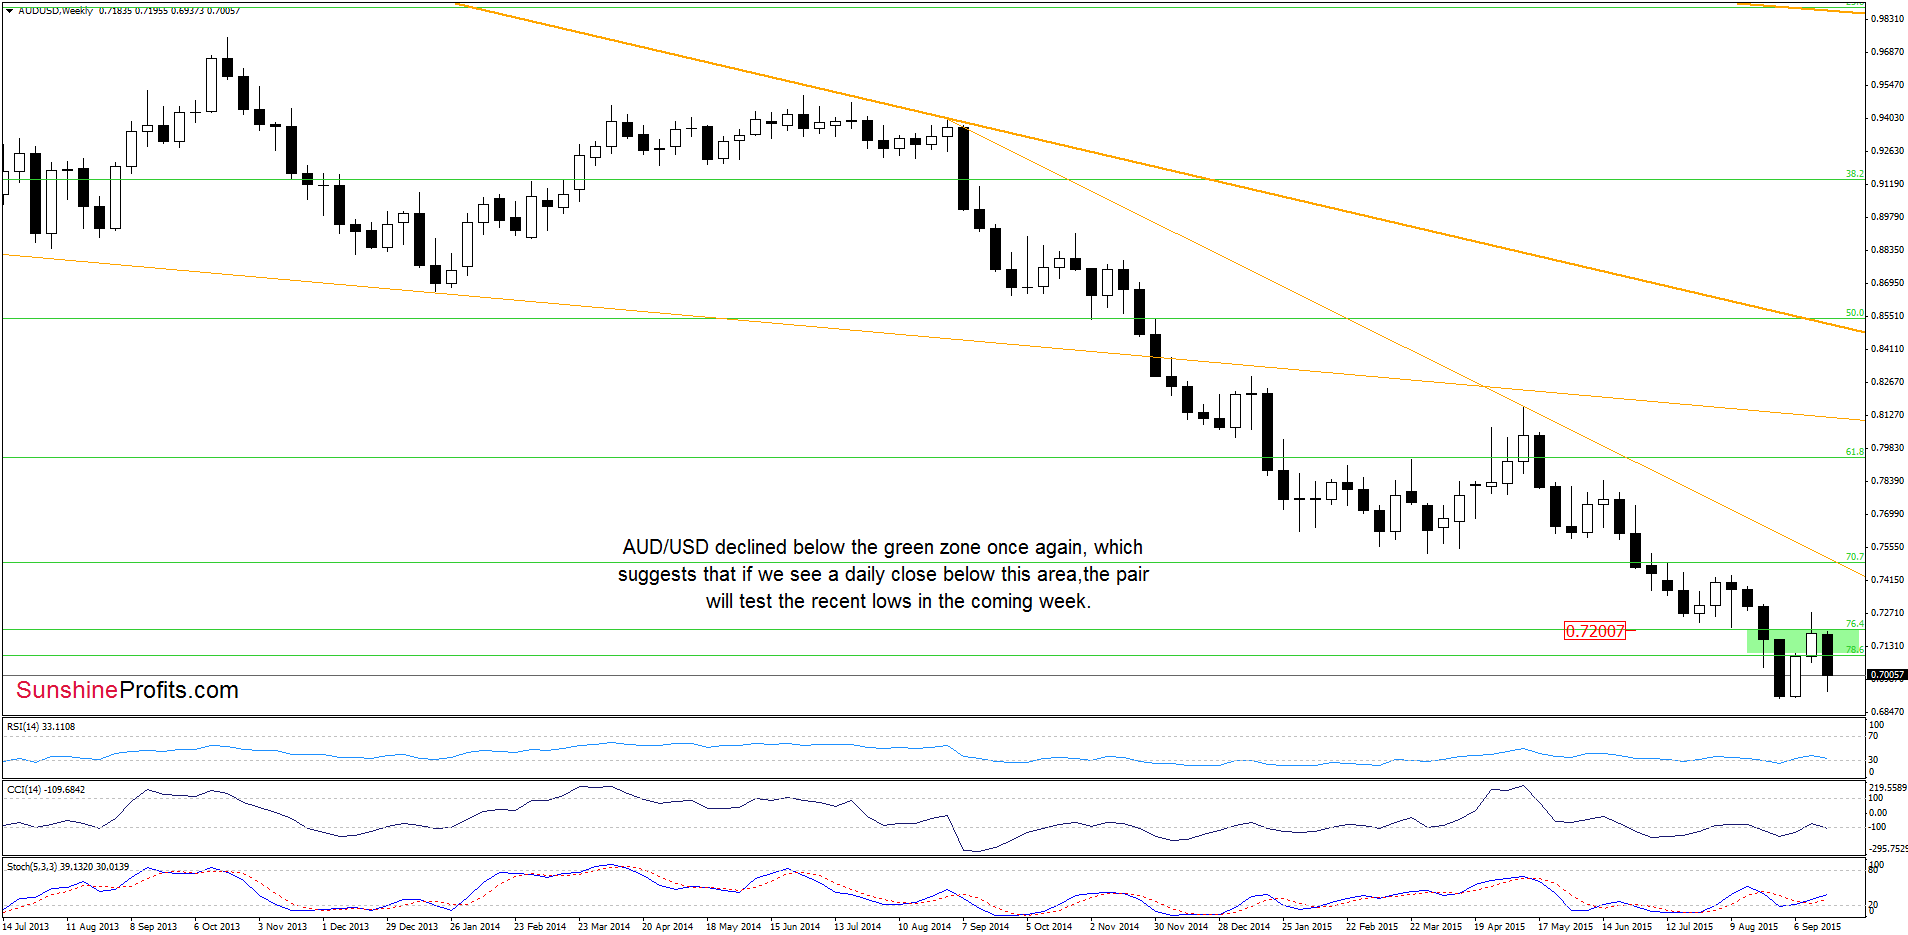
From this perspective, we see that AUD/USD reversed and slipped under the green zone once again. This suggests that if we see a weekly close below this area, the pair will likely test the recent lows in the coming week.
Very short-term outlook: mixed with bearish bias
Short-term outlook: mixed with bearish bias
MT outlook: mixed
LT outlook: mixed
Trading position (short-term; our opinion): No positions are justified from the risk/reward perspective at the moment. We will keep you informed should anything change, or should we see a confirmation/invalidation of the above.
Thank you.
Nadia Simmons
Forex & Oil Trading Strategist
Przemyslaw Radomski, CFA
Founder, Editor-in-chief
Gold & Silver Trading Alerts
Forex Trading Alerts
Oil Investment Updates
Oil Trading Alerts

