

Yesterday’s minutes of the Federal Reserve’s latest meeting showed that although Fed officials believe that the economy is coming to the point where interest rates should move higher, the subdued inflation outlook in combination with weakness in the global economy could still pose a risk to the U.S. economic outlook. Thanks to this disappointing news, the USD Index reversed and declined sharply, pushing the euro higher. Will we see EUR/USD above 1.1200 in the coming days?
In our opinion the following forex trading positions are justified - summary:
EUR/USD
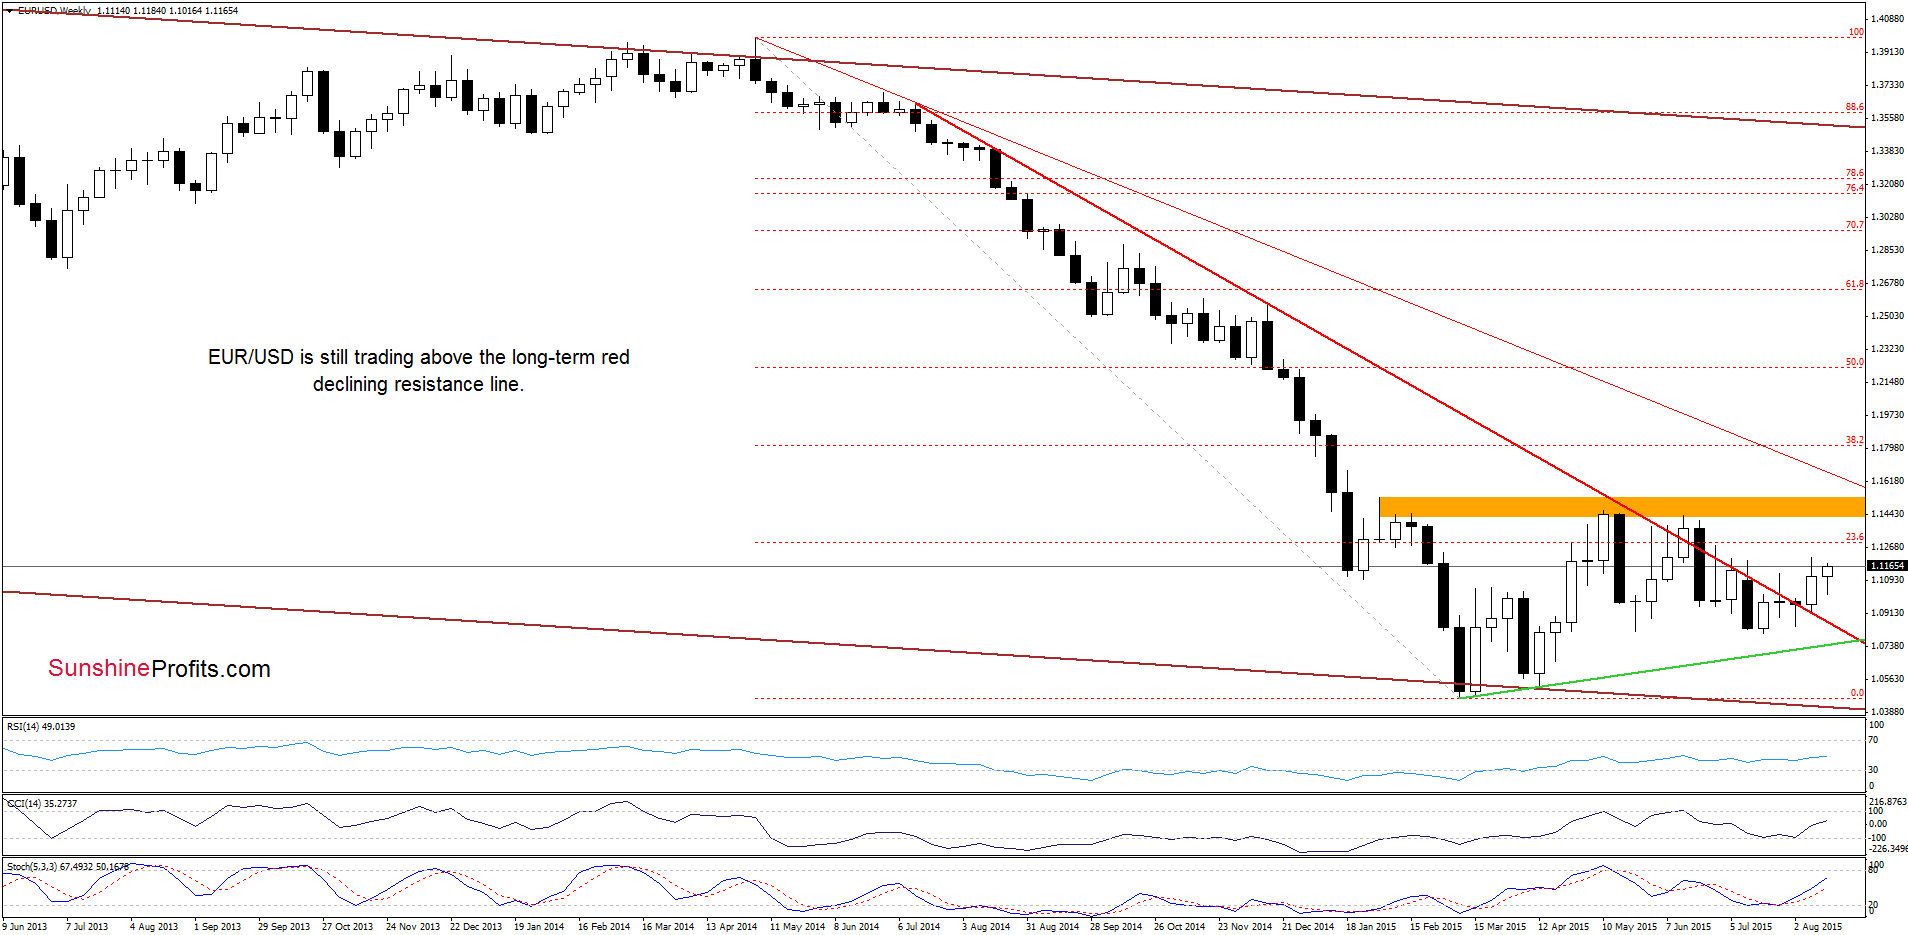
The situation in the medium term hasn’t changed much as EUR/USD remains above the previously-broken long-term red declining resistance line. Additionally buy signals generated by the indicators remain n place, suggesting further improvement.
Will the very short-term picture confirm this pro-growth scenario? Let’s check.
Quoting our previous alert:
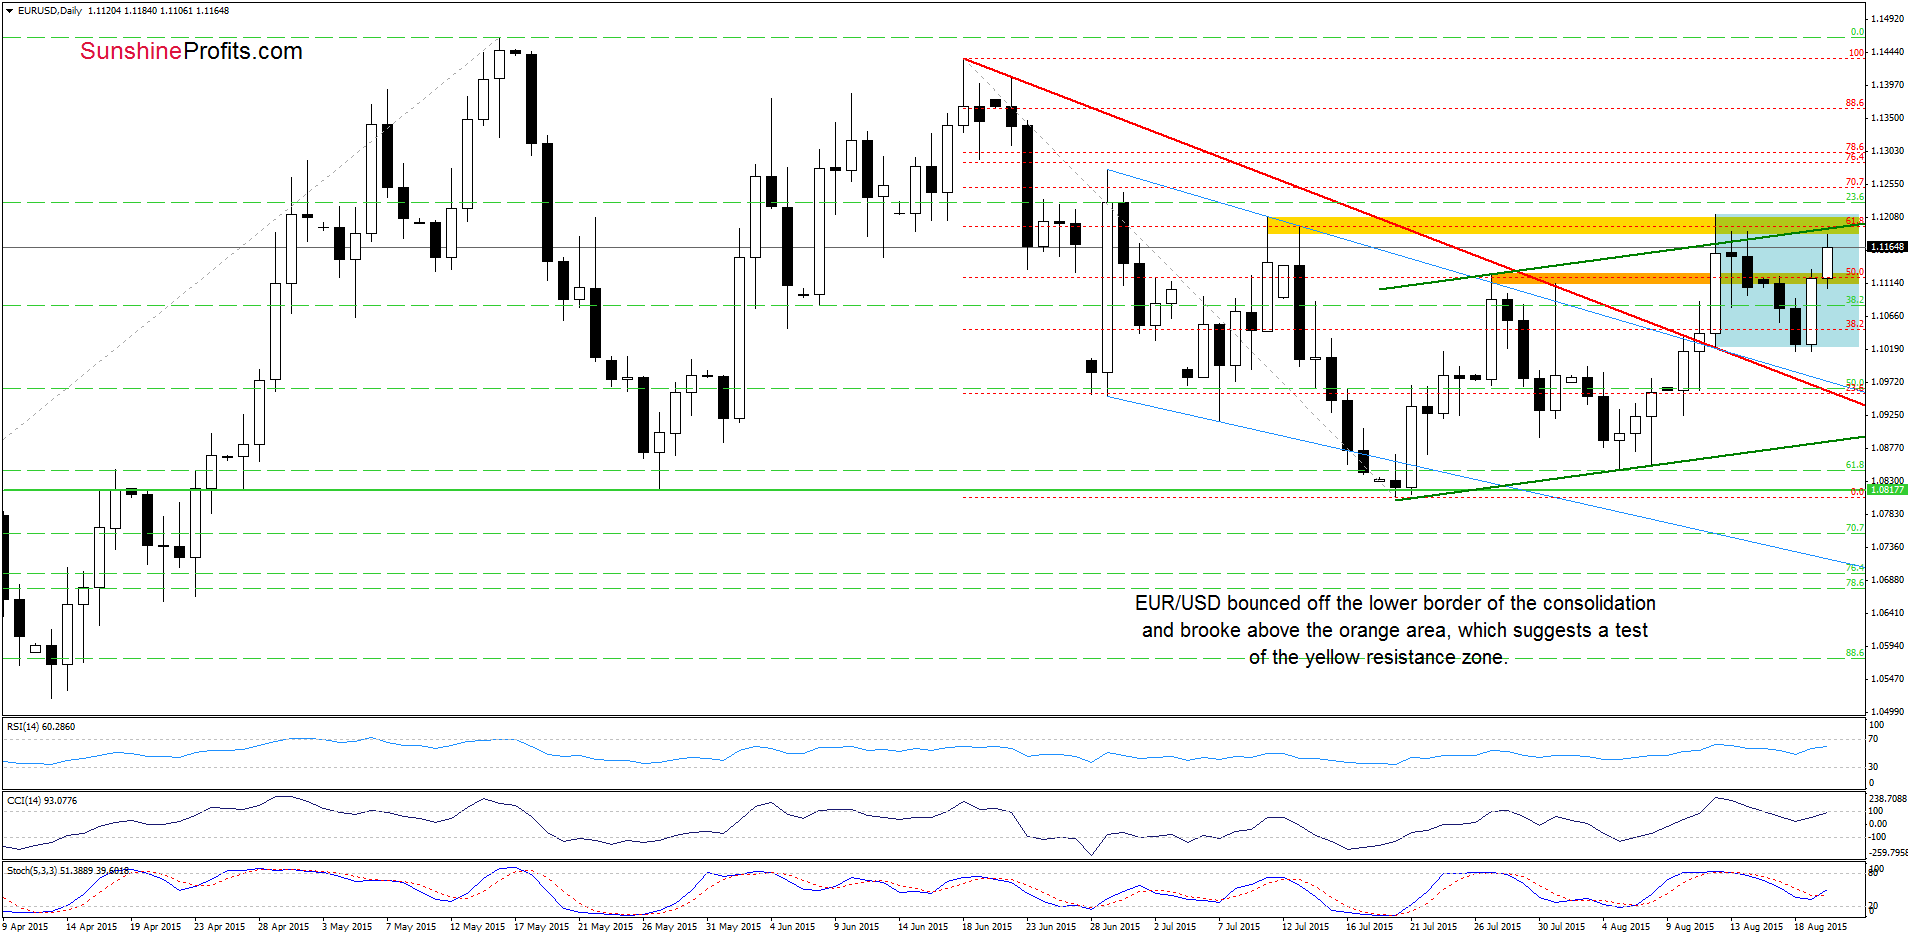
(…) the lower line of the consolidation triggered an upswing, which suggests a test of the previously-broken orange support/resistance area.
Looking at the daily chart we see that currency bulls took the pair not only to our initial upside target, but also managed to push it higher earlier today, which suggests a test of the upper border of the green rising trend channel, the upper line of the blue consolidation and the yellow resistance zone. If this area stops currency bulls (similarly to what we saw in the previous week), we’ll see a decline to (at least) the previously-broken orange area. Nevertheless, taking into account the medium-term picture and a buy signal generated b the Stochastic Oscillator it seems that they will try to push the pair higher. If they succeed, the next upside target would be around 1.1250, where the 70.7% Fibonacci retracement is.
Very short-term outlook: mixed with bullish bias
Short-term outlook: mixed
MT outlook: mixed
LT outlook: mixed
Trading position (short-term; our opinion): No positions are justified from the risk/reward perspective at the moment. We will keep you informed should anything change, or should we see a confirmation/invalidation of the above.
USD/JPY
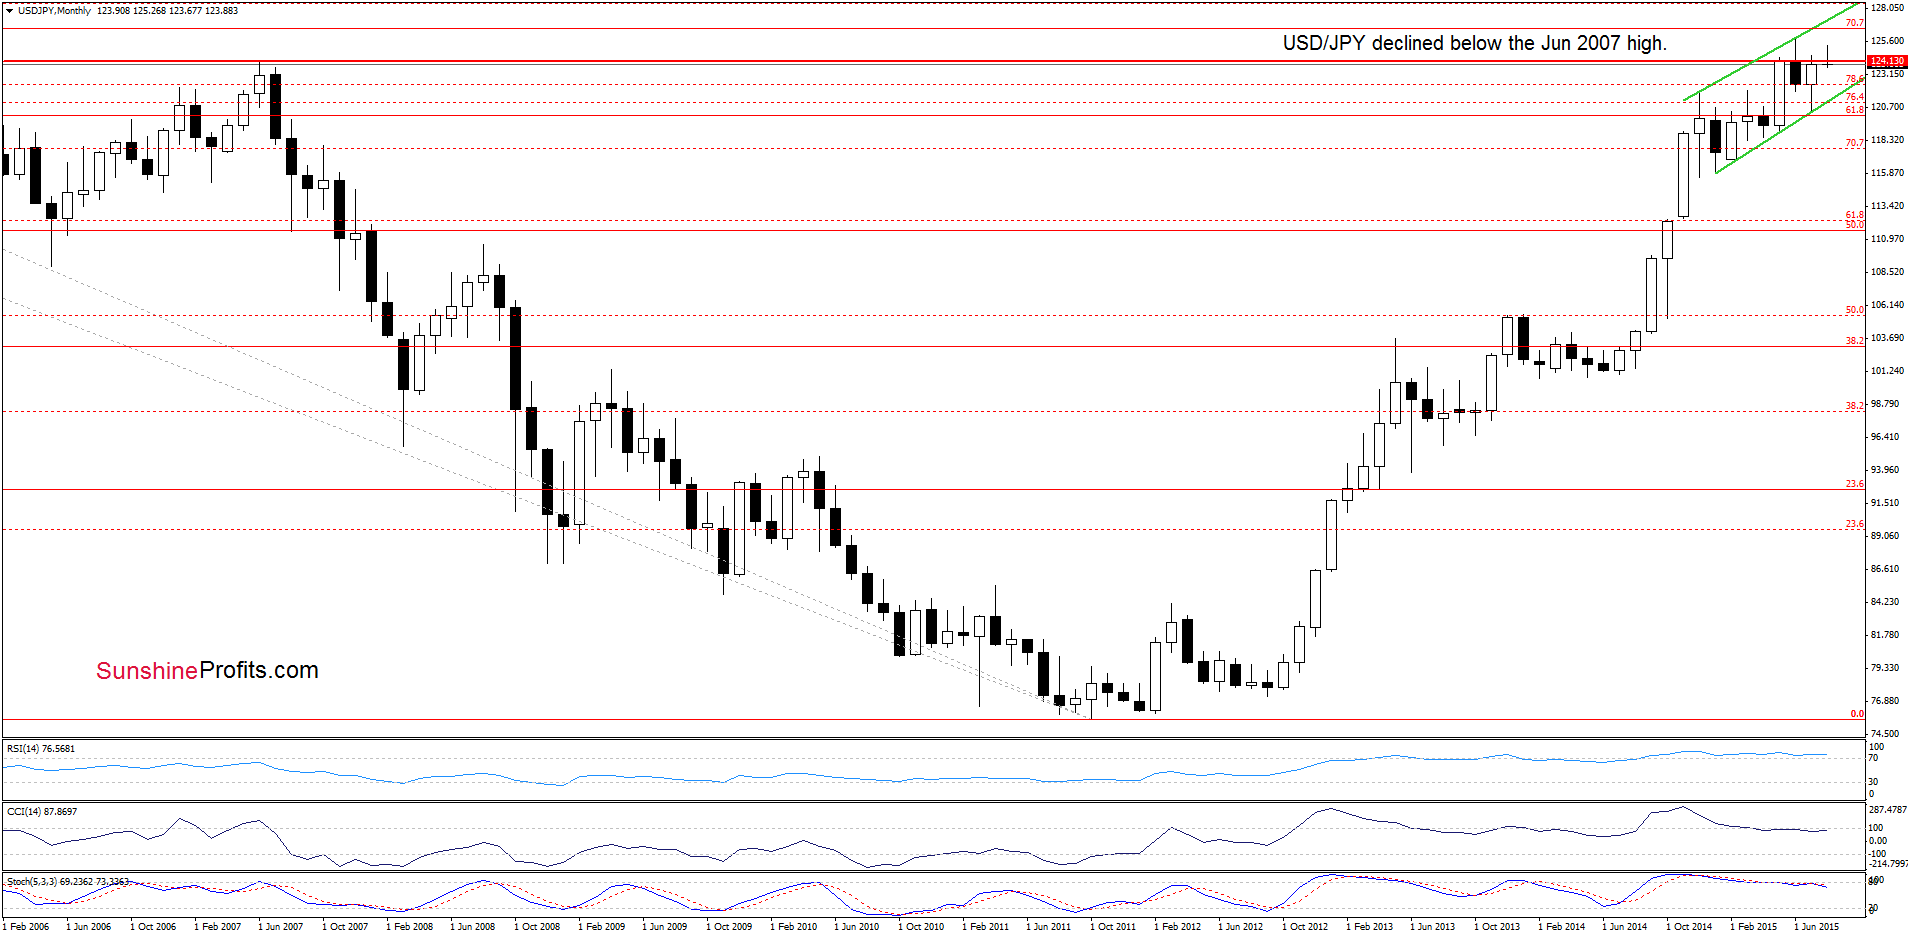
The medium-term picture has deteriorated slightly as USD/JPY slipped under the June 2007. What impact did this drop have on the very short-term picture? Let’s check.
In our last commentary on this currency pair, we wrote the following:
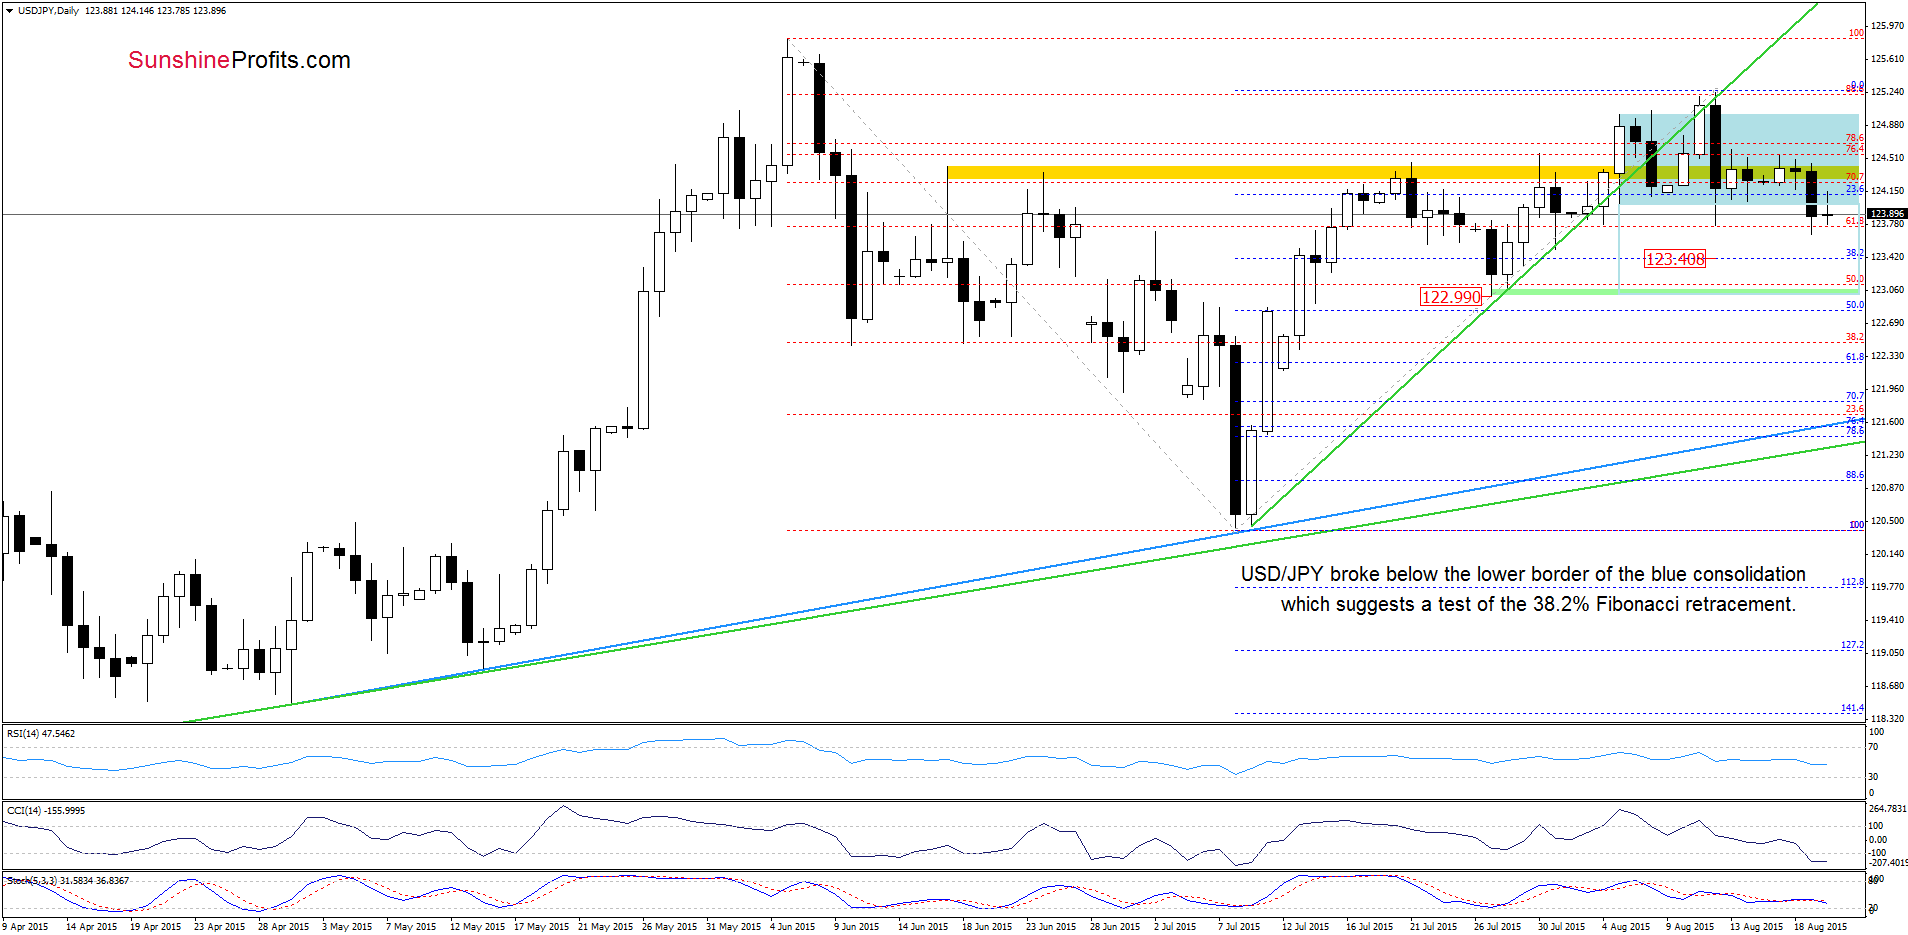
(…) USD/JPY is still trading in the blue consolidation. Therefore, in our opinion, a daily closure above/below the upper/lower border of the formation will indicate the direction of future moves. If currency bears win, and we see a successful drop not only below the lower line of the consolidation, but also under the June 2007 high (124-124.13), the initial downside target would be around 123.41, where the 38.2% Fibonacci retracement (based on the Jul-Aug rally) is.
As you see on the daily chart, USD/JPY closed yesterday’s session under the above-mentioned levels, which suggests that our initial downside target would be in play in the coming day(s). However, it is worth to keep in mind that if this support is broken, we may see a decline even to around 123, where the size of the downward move will correspond to the height of the formation and where the green support zone is.
Very short-term outlook: bearish
Short-term outlook: mixed
MT outlook: mixed
LT outlook: mixed
Trading position (short-term; our opinion): No positions are justified from the risk/reward perspective at the moment. We will keep you informed should anything change, or should we see a confirmation/invalidation of the above.
USD/CHF
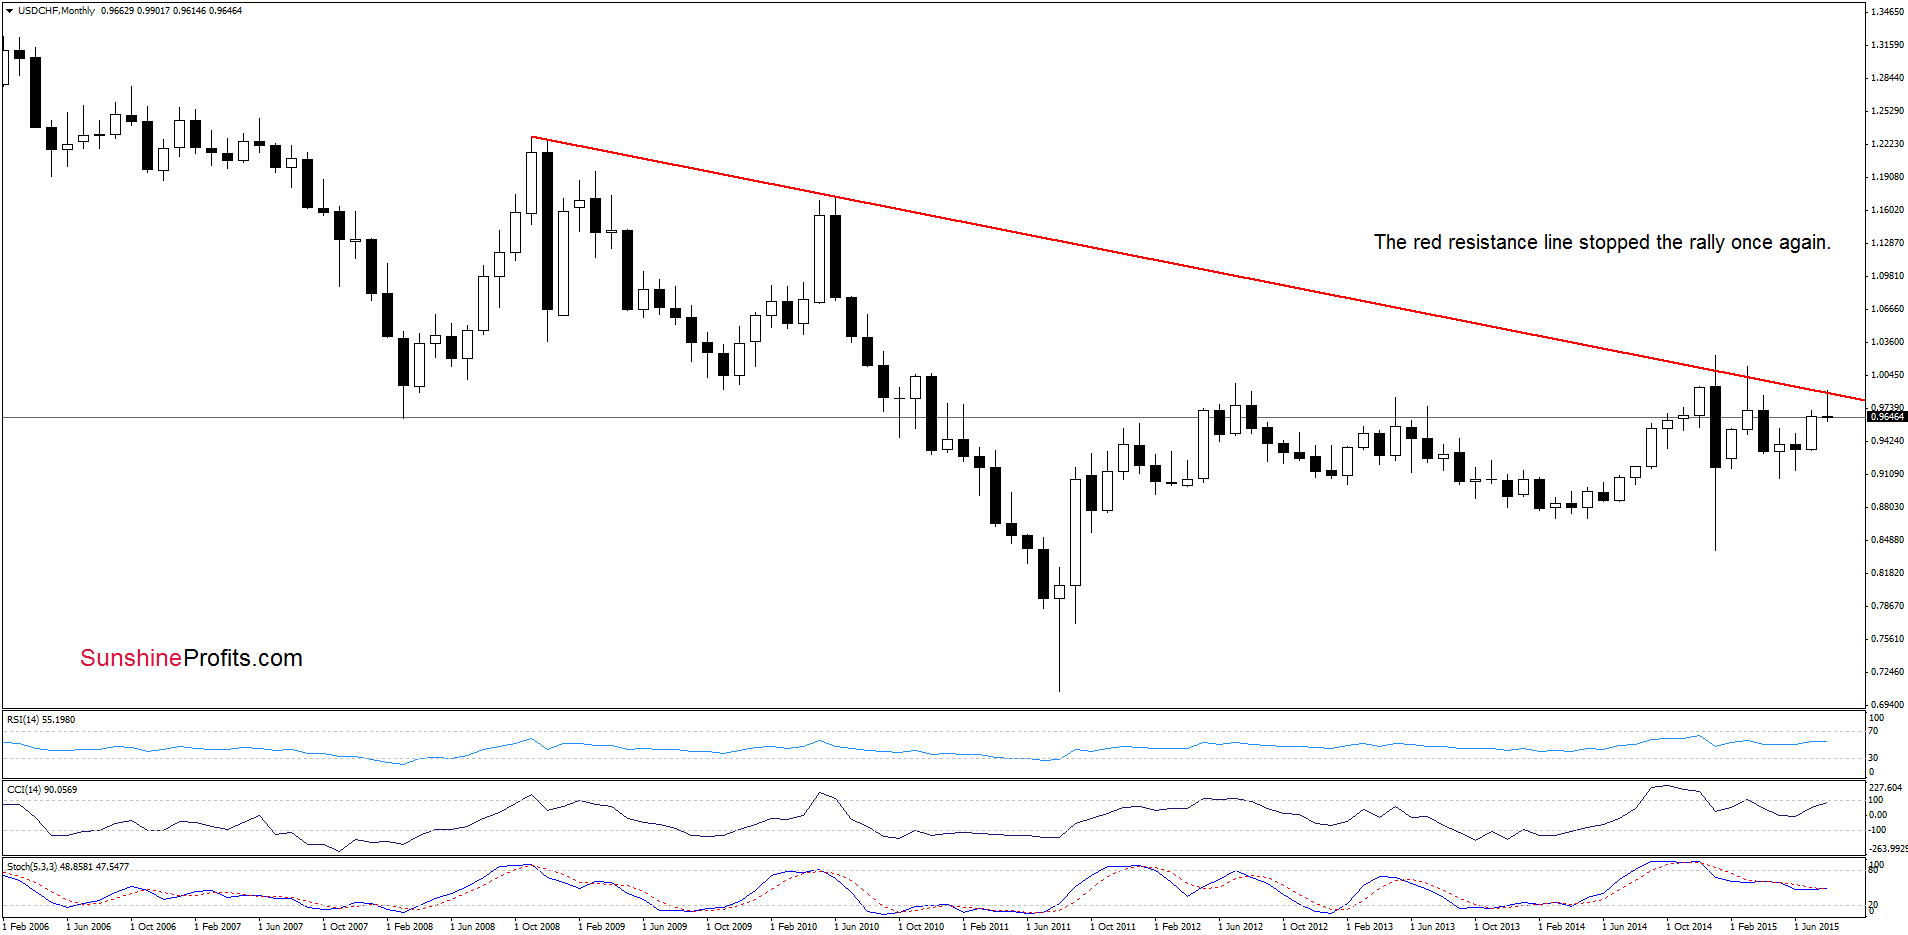
Looking at the long-term chart we see that the red declining resistance line stopped the rally once again, triggering a pullback. What impact did it have on the medium-term picture? Let’s check.
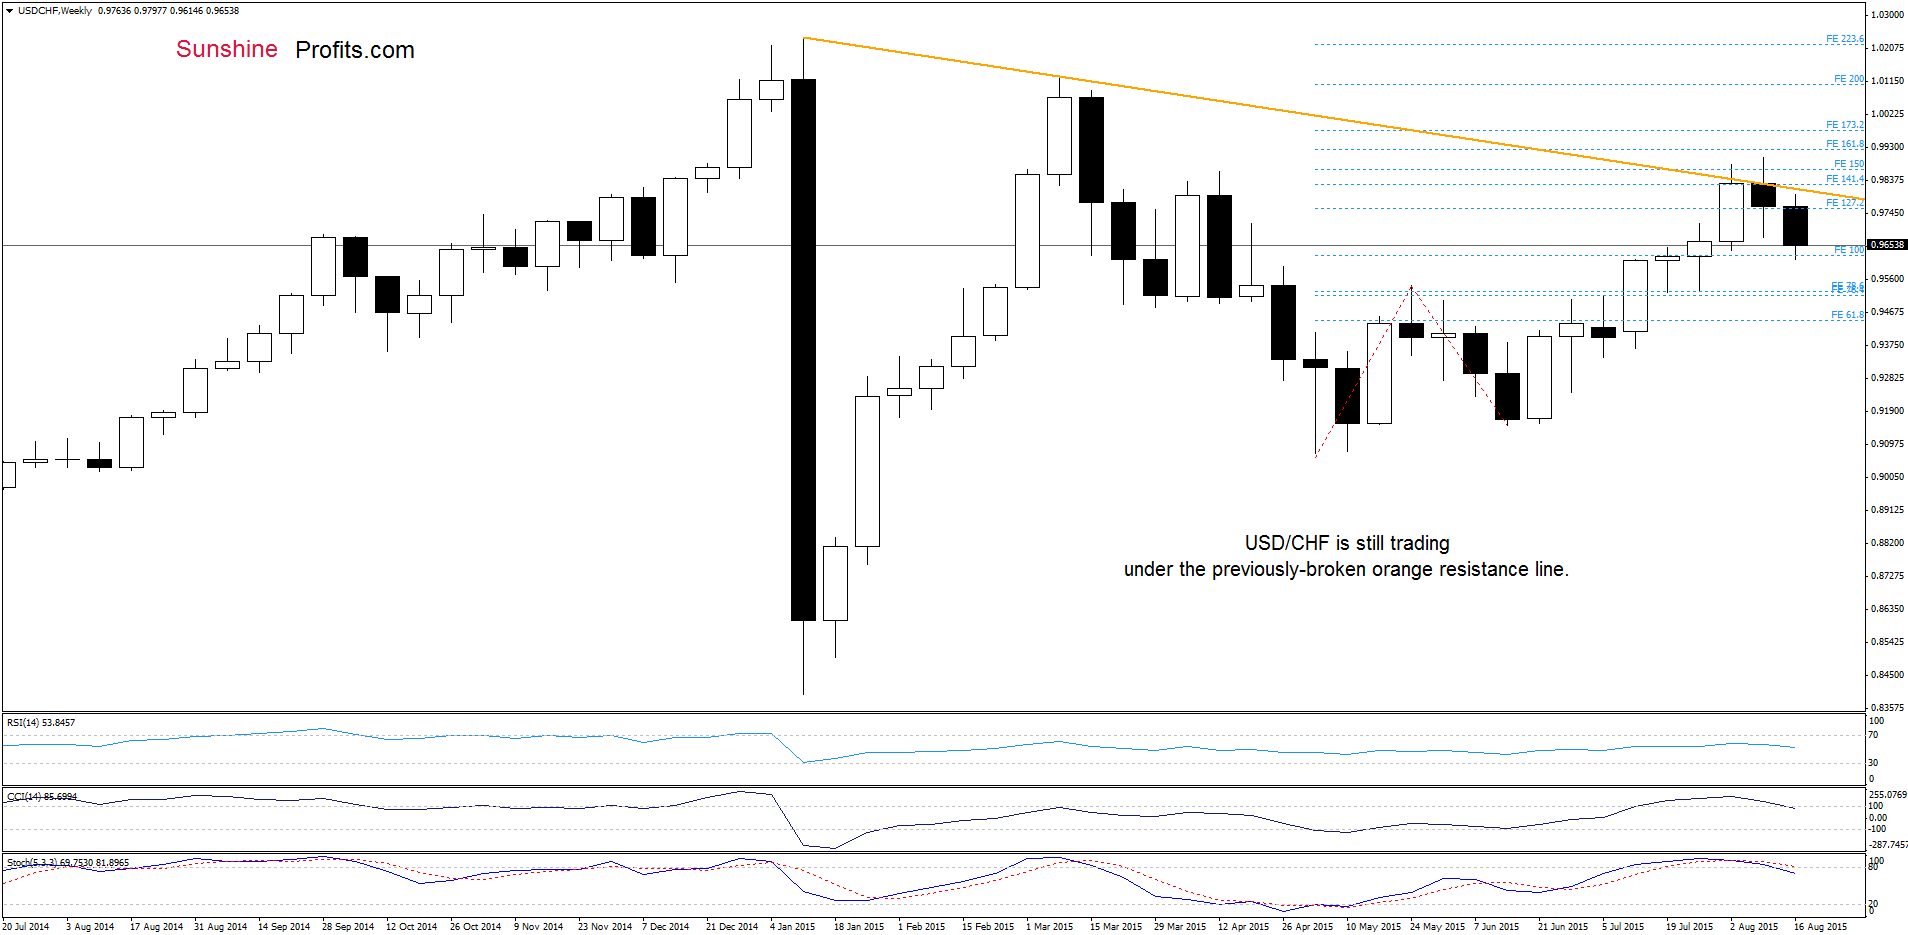
On the weekly chart, we see that USD/CHF is still trading under the previously-broken orange resistance line, which means that an invalidation of the breakout above it and its negative impact on the exchange rate is still in effect, suggesting another attempt to move lower.
How low could the pair go? Let’s examine the daily chart and find out.
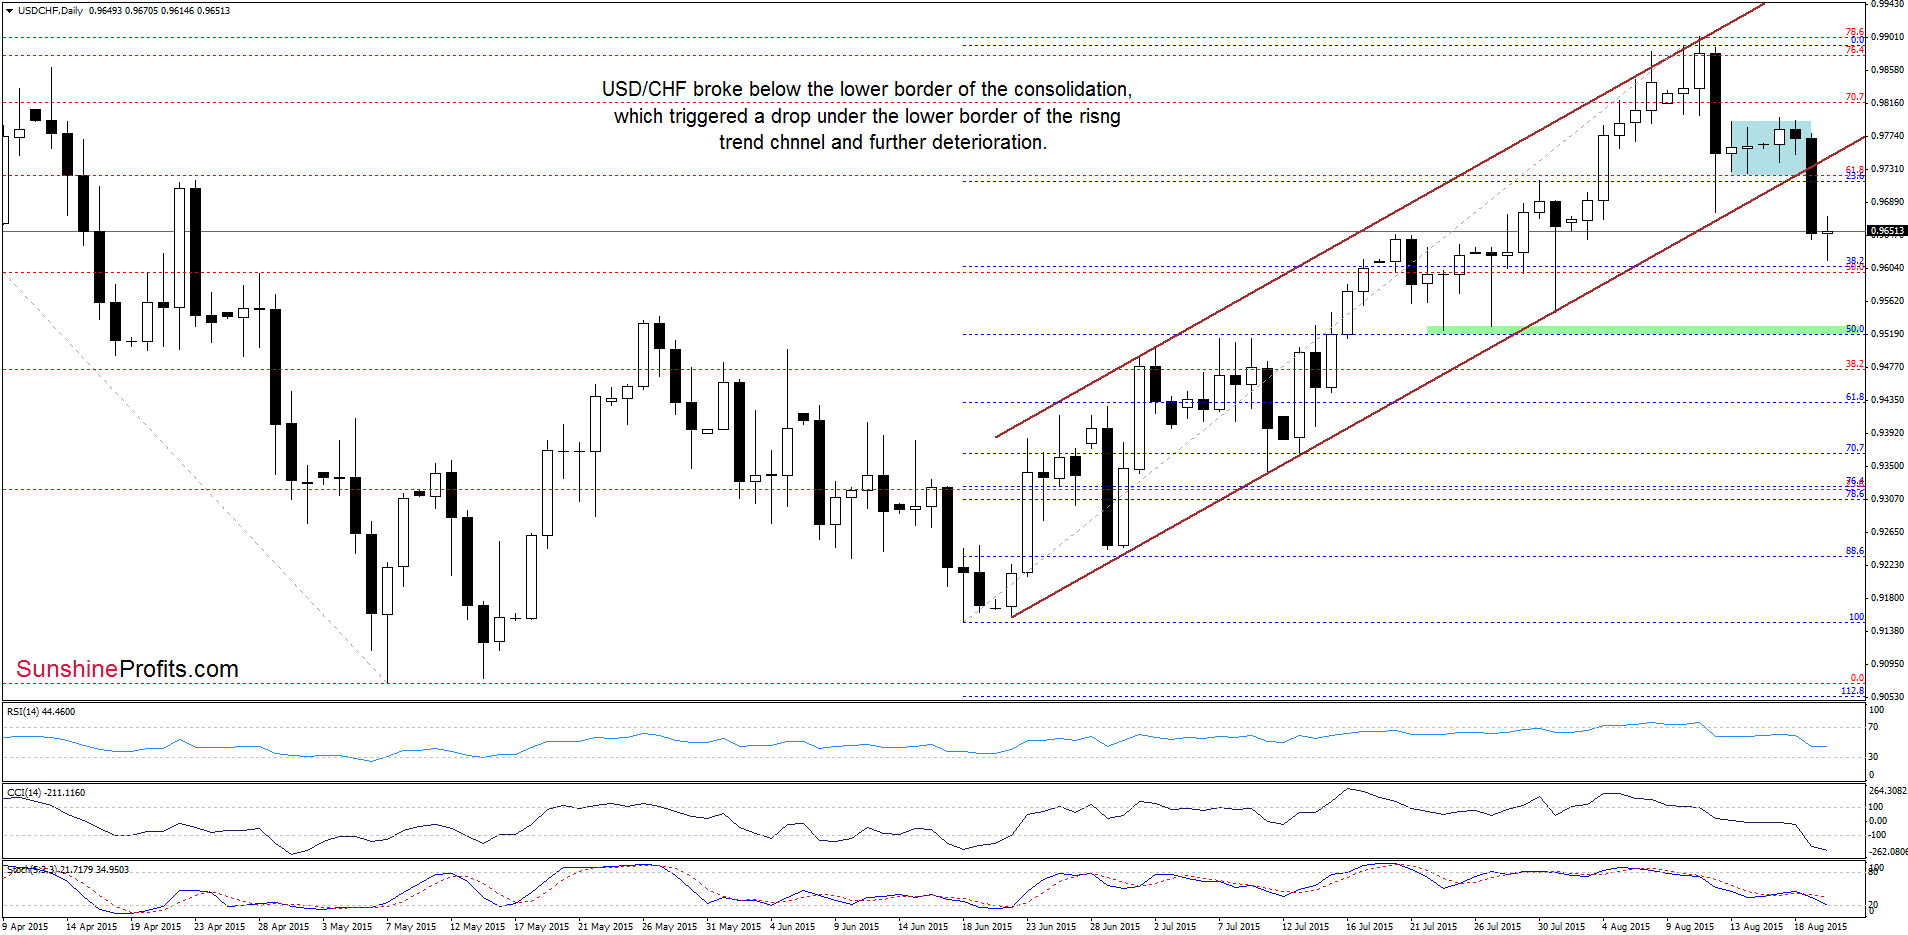
From today’s point of view we see that USD/CHF broke below the lower border of the blue consolidation and the lower line of the rising trend channel, which triggered a sharp decline. Earlier today, the pair extended losses, approaching the 38.2% Fibonacci retracement. Although this support could encourage currency bulls to act, it seems to us that the long- and medium-term pictures in combination with sell signals generated by the daily indicators will trigger further deterioration. If this is the case, and USD/CHF drops under the Fibonacci support, we’ll likely see a decline to around 0.9524-0.9530, where the Jul 23, Jul 27 lows and the 50% Fibonacci retracement are.
Very short-term outlook: bearish
Short-term outlook: mixed
MT outlook: mixed
LT outlook: mixed
Trading position (short-term; our opinion): No positions are justified from the risk/reward perspective at the moment. We will keep you informed should anything change, or should we see a confirmation/invalidation of the above.
Thank you.
Nadia Simmons
Forex & Oil Trading Strategist
Przemyslaw Radomski, CFA
Founder, Editor-in-chief
Gold & Silver Trading Alerts
Forex Trading Alerts
Oil Investment Updates
Oil Trading Alerts

