

Yesterday’s report showed that U.S. jobless claims rose more than expected in the previous week, which in combination with today’s positive data (U.S. producer prices rose 0.2% in July, beating analysts’ expectations) supported the greenback. What impact did it have on our six currency pairs?
In our opinion the following forex trading positions are justified - summary:
EUR/USD
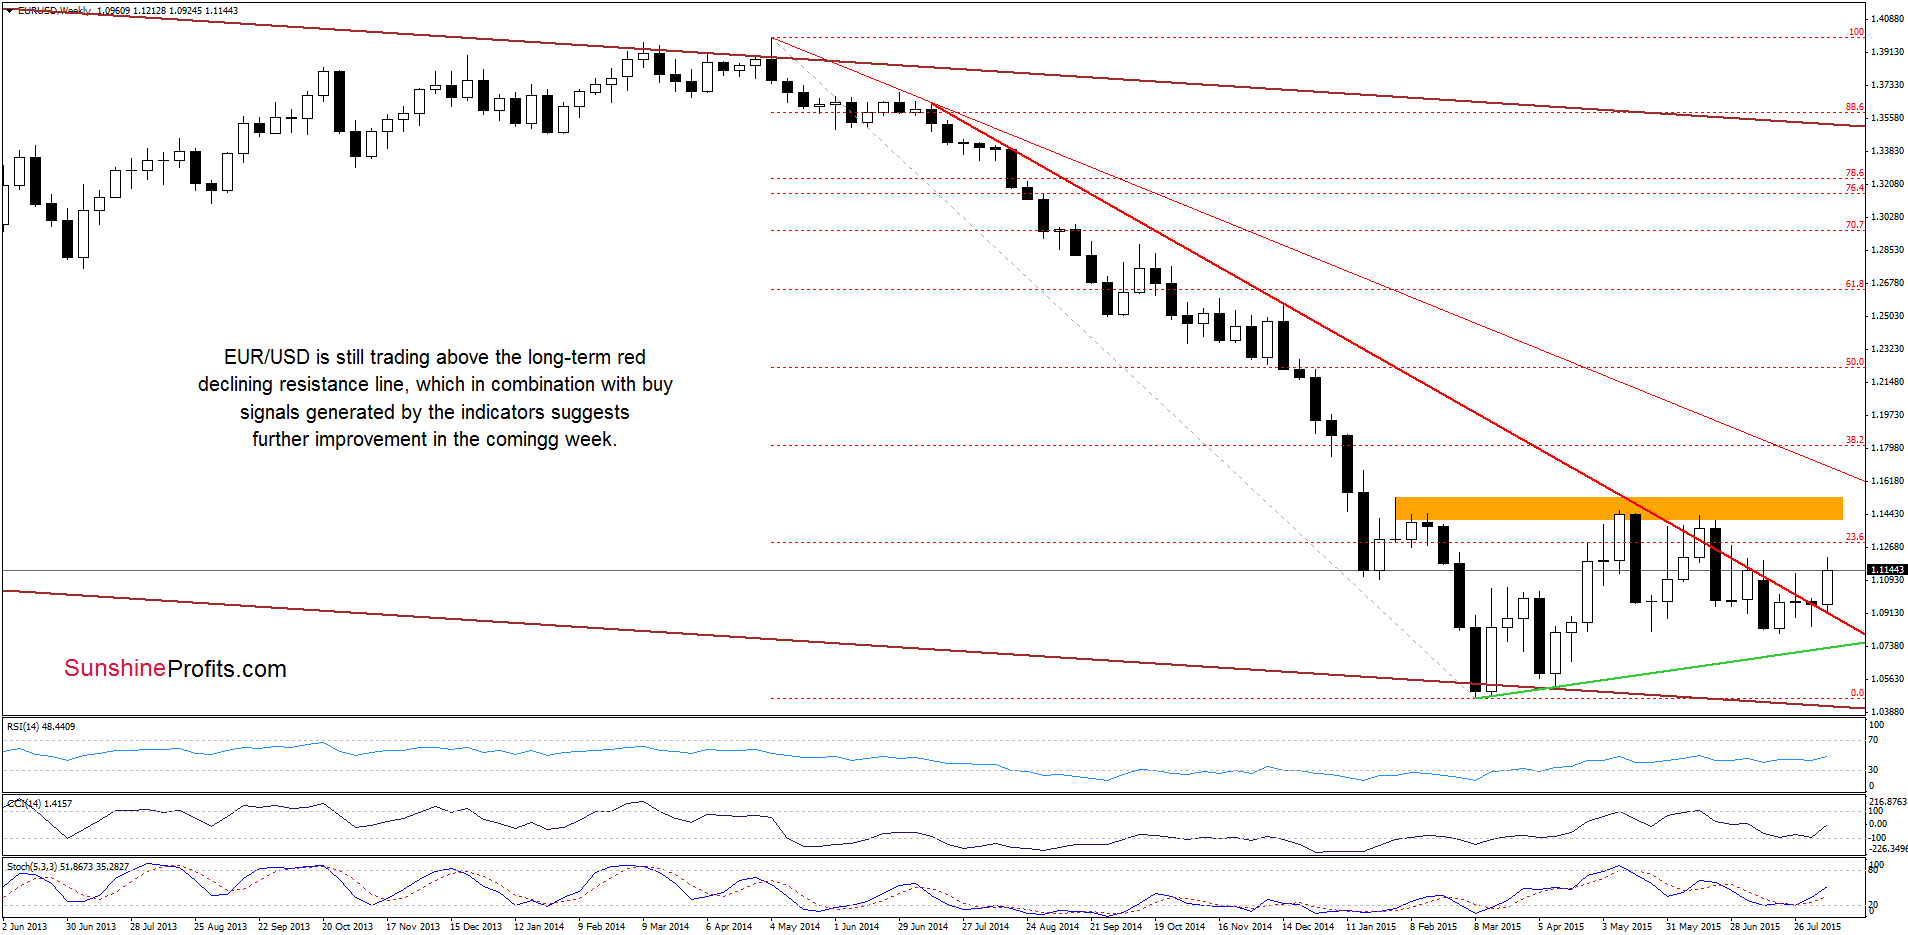
The situation in the medium term hasn’t changed much as EUR/USD is trading above the previously-broken long-term red declining resistance line, which in combination with buy signals generated by the indicators suggests further improvement.
But does the short-term chart confirm this pro growth scenario? Let’s check.
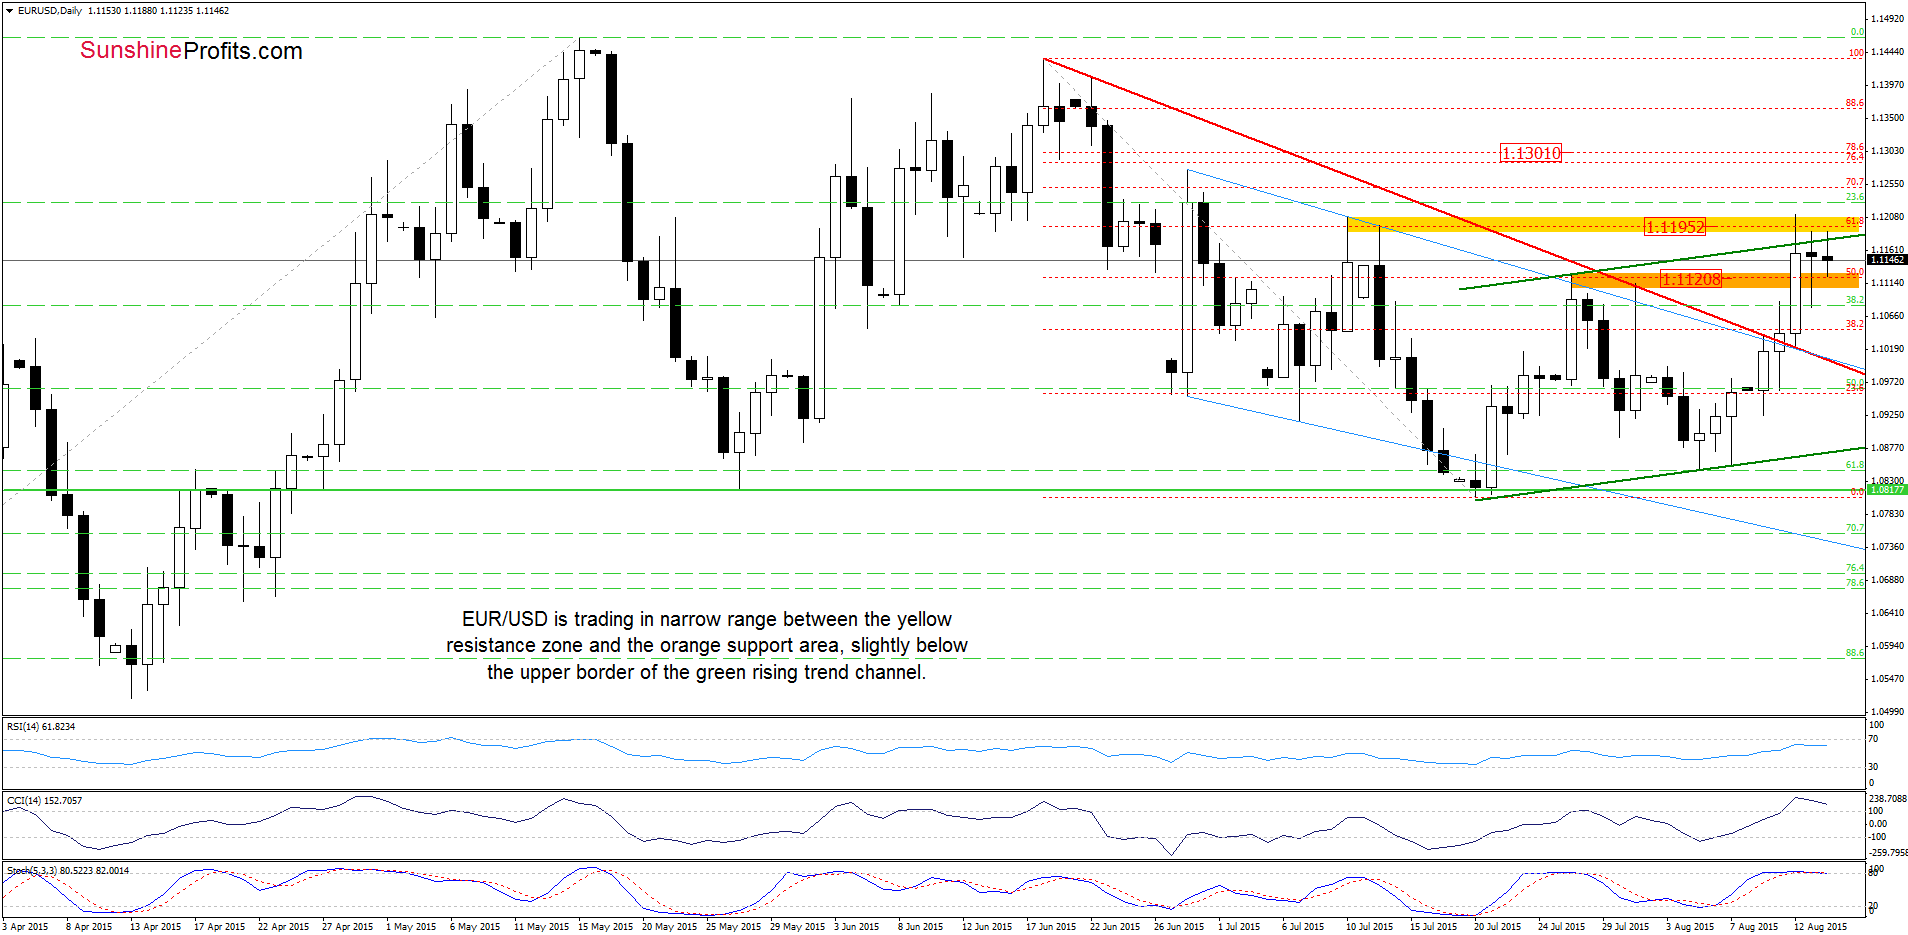
Looking at the daily chart we see that EUR/USD is trading in a narrow range between the yellow resistance zone (which is currently reinforced by the upper border of the green rising trend channel) and the orange area (it serves as the nearest support at the moment). What’s next? Taking into account the above-mentioned solid resistance and the current position of the indicators (the CCI and Stochastic Oscillator are overbought and very close to generating sell signals), we think that lower values of the exchange rate are just around the corner. If this is the case, and the pair moves lower from here, we’ll likely see a test of the previously-broken red declining line in the coming days. Nevertheless, this scenario will be more likely if EUR/USD closes today’s session under the orange zone.
Very short-term outlook: mixed with bearish bias
Short-term outlook: mixed
MT outlook: mixed
LT outlook: mixed
Trading position (short-term; our opinion): No positions are justified from the risk/reward perspective at the moment. We will keep you informed should anything change, or should we see a confirmation/invalidation of the above.
GBP/USD
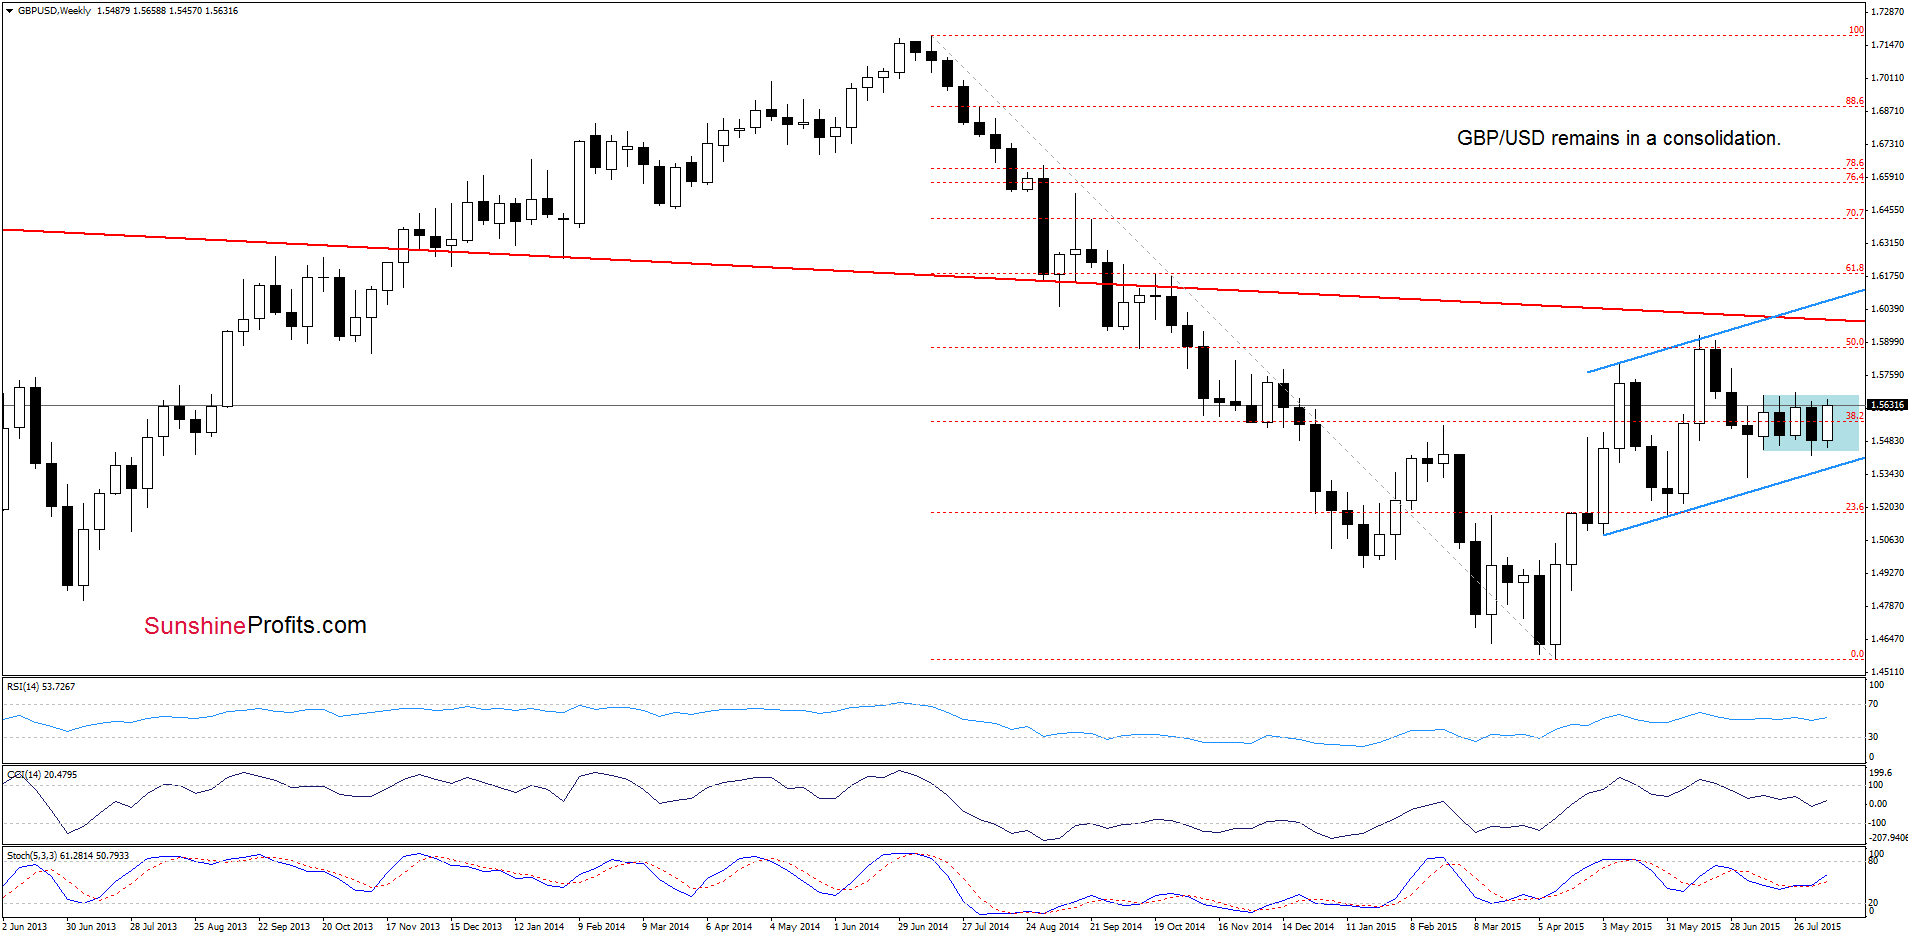
The situation in the medium term remains almost unchanged as GBP/USD is trading in the blue consolidation. Today, we’ll focus on the very short-term picture.
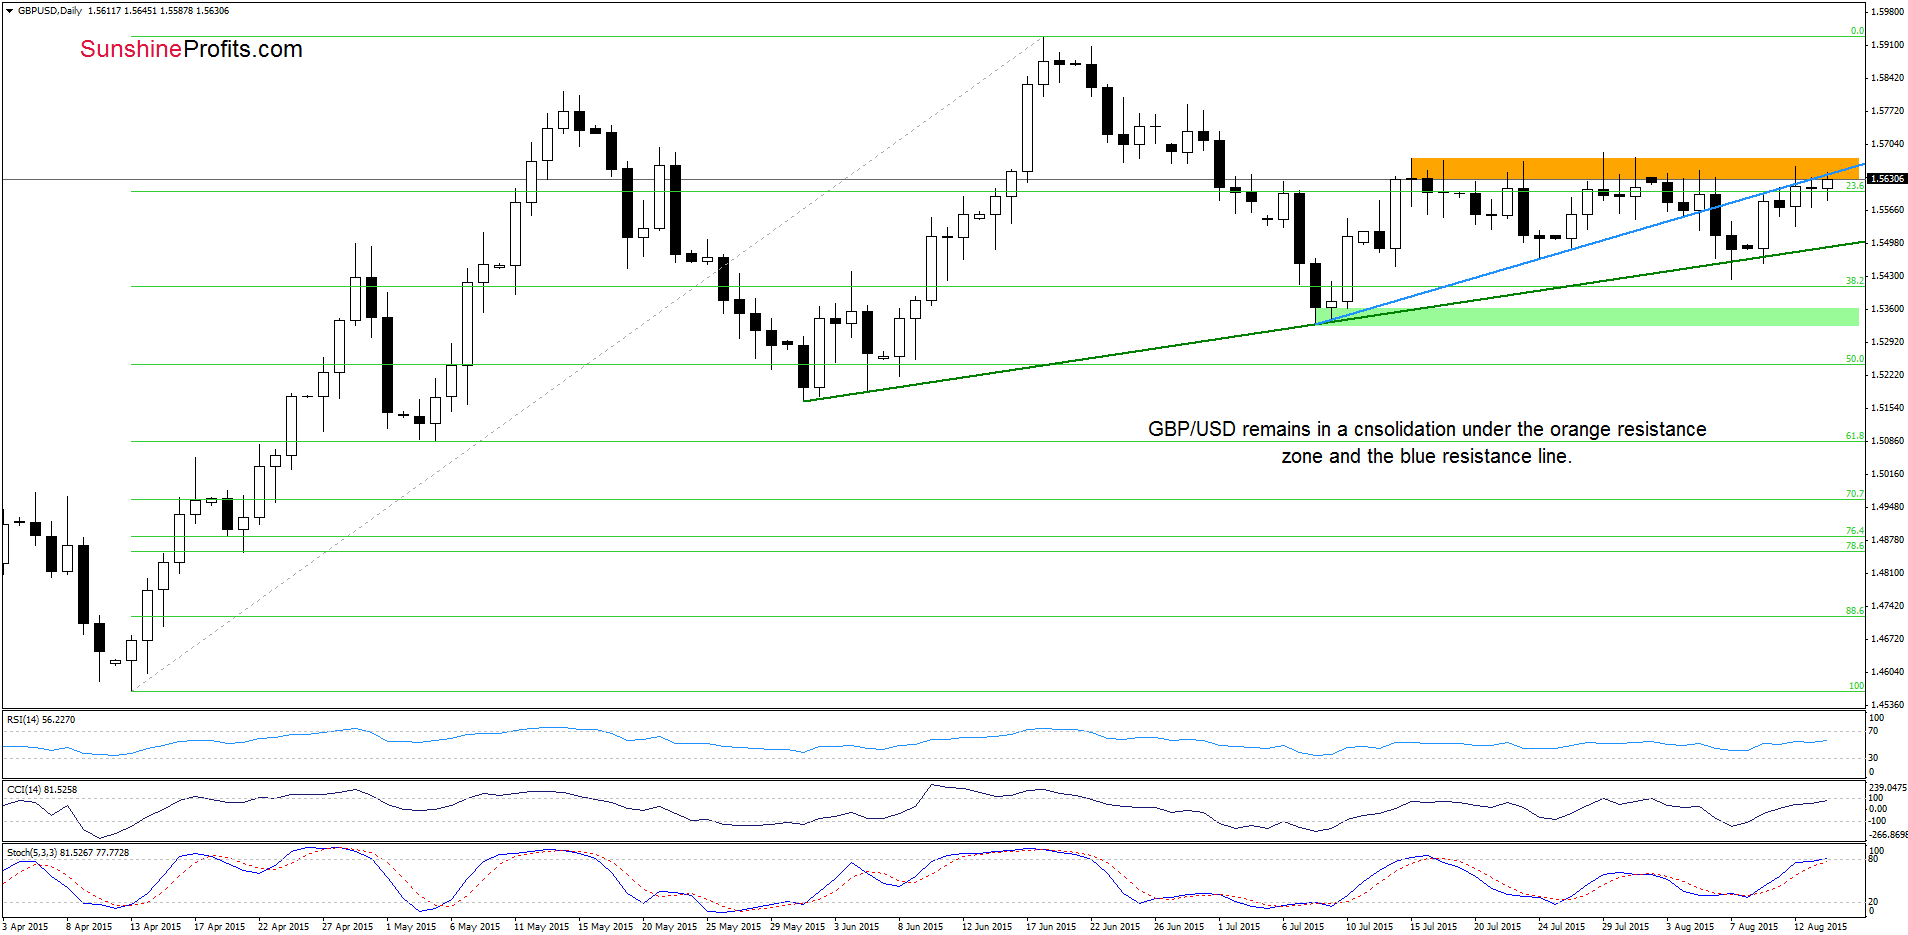
On the above chart, we see that GBP/USD is trading in a consolidation slightly below the orange resistance zone, which is currently reinforced by the previously-broken blue line. Therefore, in our opinion, as long as there is no comeback above this area all upswings are nothing more than verifications of earlier breakdown and a bigger upward move is not likely to be seen. Additionally, if the indicators generate sell signals in the coming day(s), we’ll likely see another test of the green support line.
Very short-term outlook: mixed
Short-term outlook: mixed
MT outlook: mixed
LT outlook: mixed
Trading position (short-term; our opinion): No positions are justified from the risk/reward perspective at the moment. We will keep you informed should anything change, or should we see a confirmation/invalidation of the above.
USD/JPY
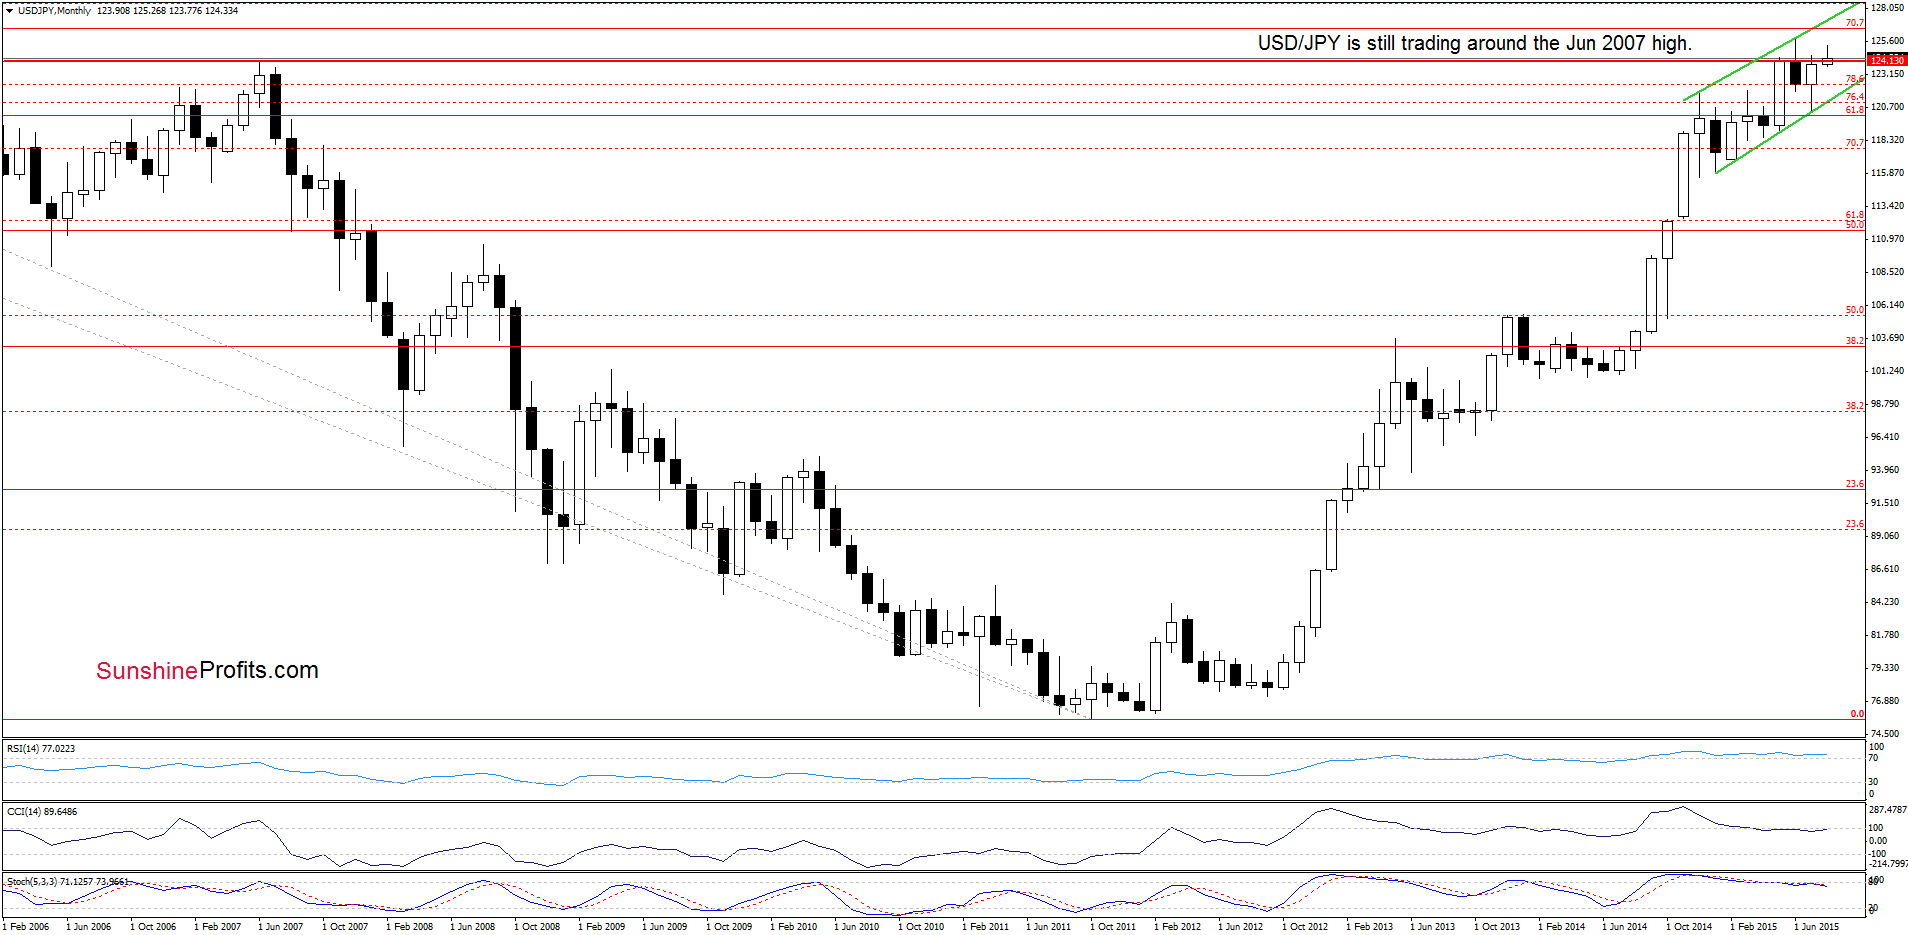
The medium-term picture hasn’t changed much as USD/JPY is still trading around the June 2007, which makes the situation a bit unclear.
Will the very short-term chart give us more clues about future moves? Let’s check.
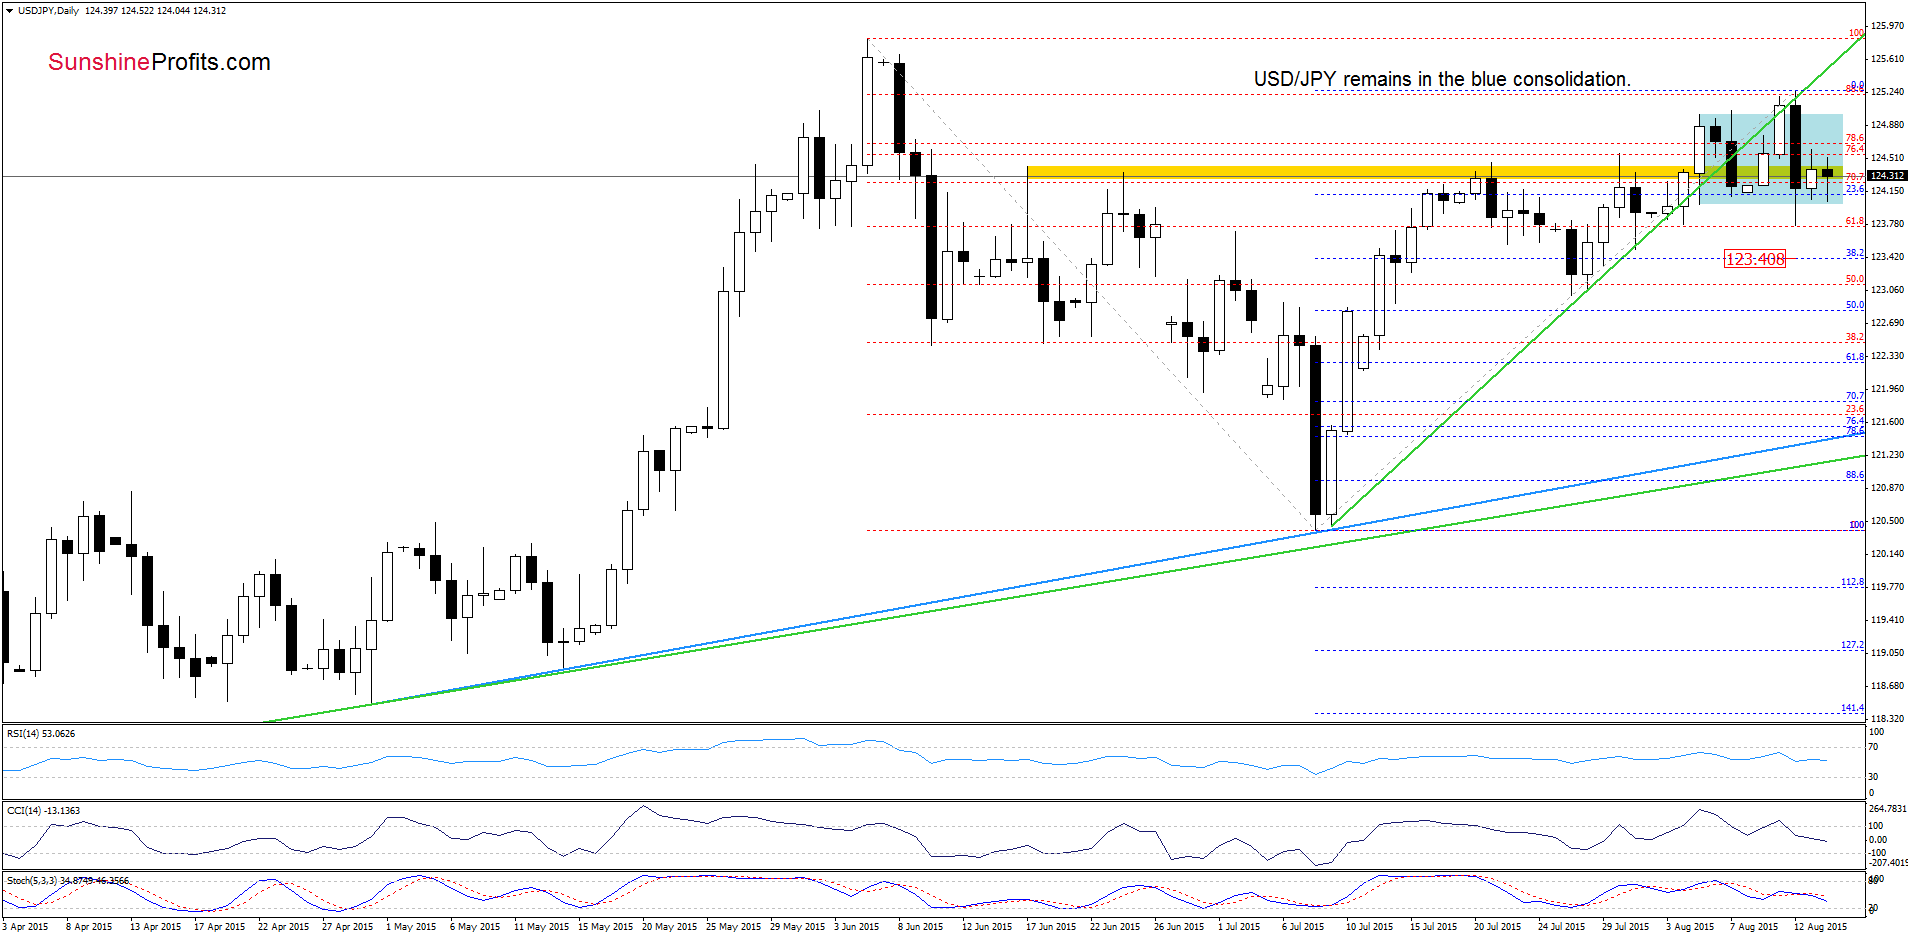
From today’s point of view, we see that although USD/JPY declined sharply, currency bulls didn’t give up and managed to trigger a rebound, which took the pair to the consolidation. Despite this move, sell signals generated by the indicators remain in place, suggesting another attempt to move lower. Nevertheless, further declines will be more likely if we see a daily close below the lower border of the consolidation and the June 2007 high (124-124.13). In this case, the initial downside target would be around 123.41, where the 38.2% Fibonacci retracement (based on the Jul-Aug rally) is.
Very short-term outlook: mixed with bearish bias
Short-term outlook: mixed with bearish bias
MT outlook: mixed
LT outlook: mixed
Trading position (short-term; our opinion): No positions are justified from the risk/reward perspective at the moment. We will keep you informed should anything change, or should we see a confirmation/invalidation of the above.
USD/CAD
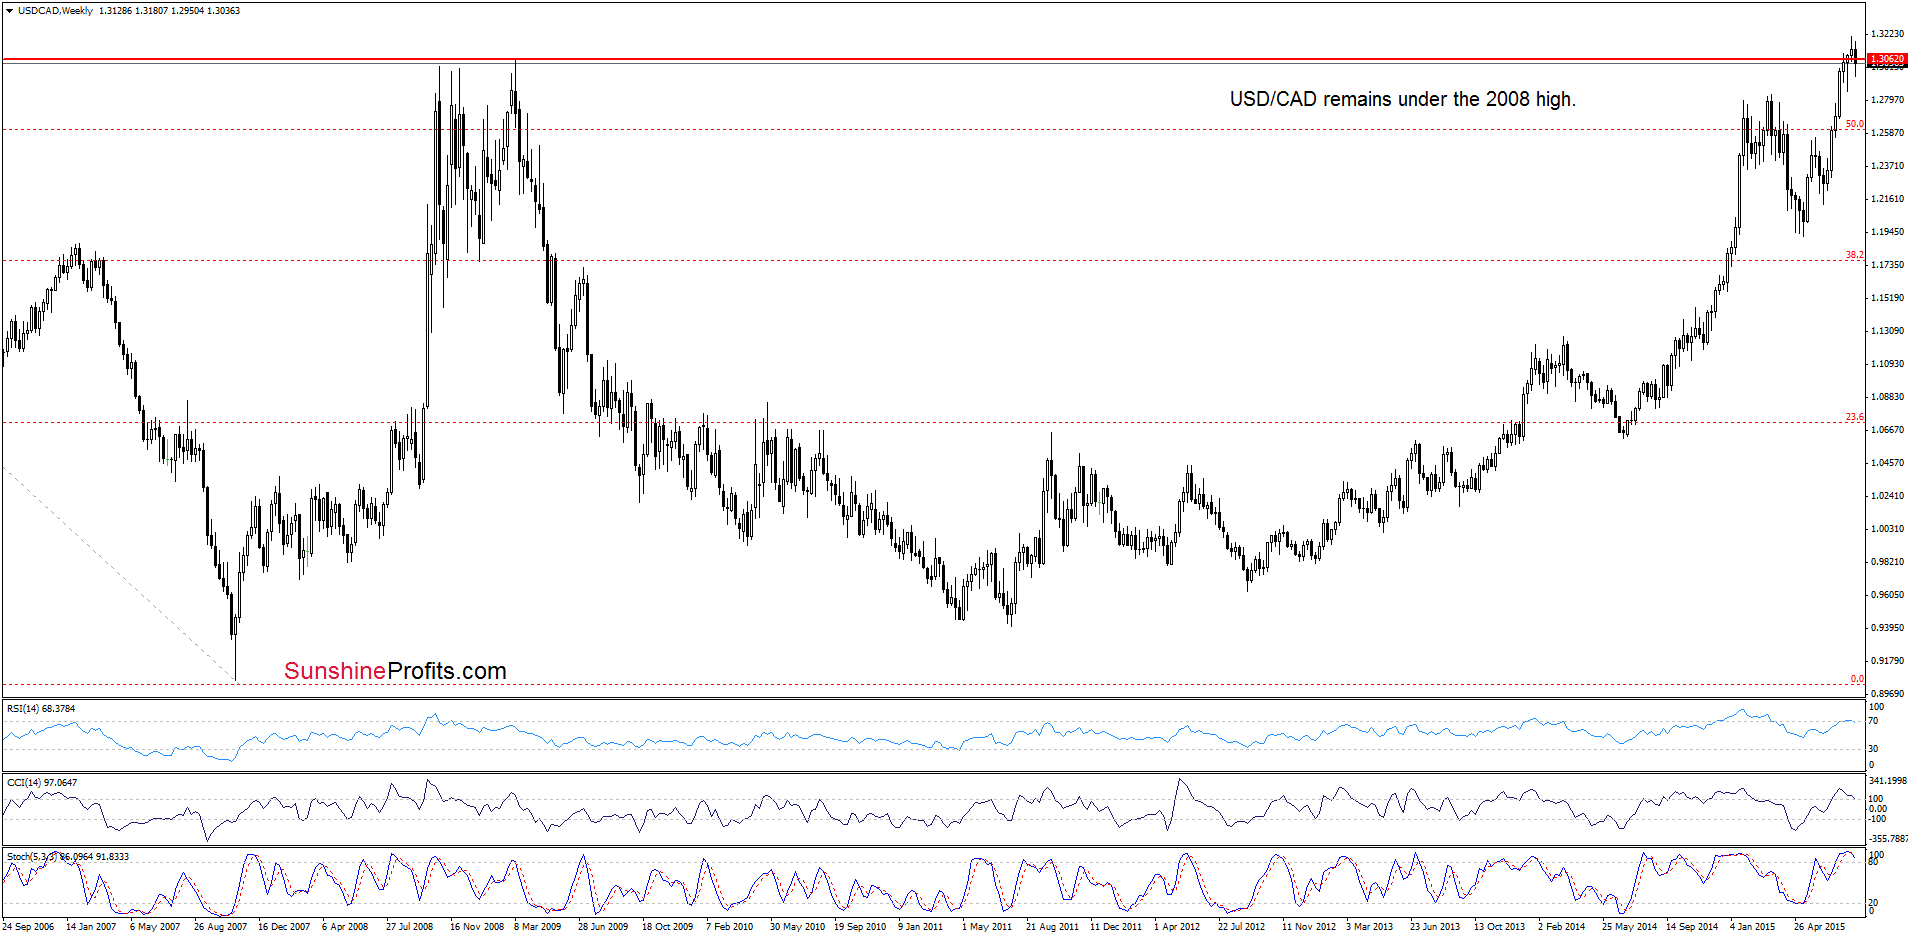
As you see on the weekly chart, USD/CAD remains under the 2008 high, which suggests further deterioration. Nevertheless, such price action will be more likely if we see a weekly close under this resistance.
Having said that, let’s focus on the daily chart.
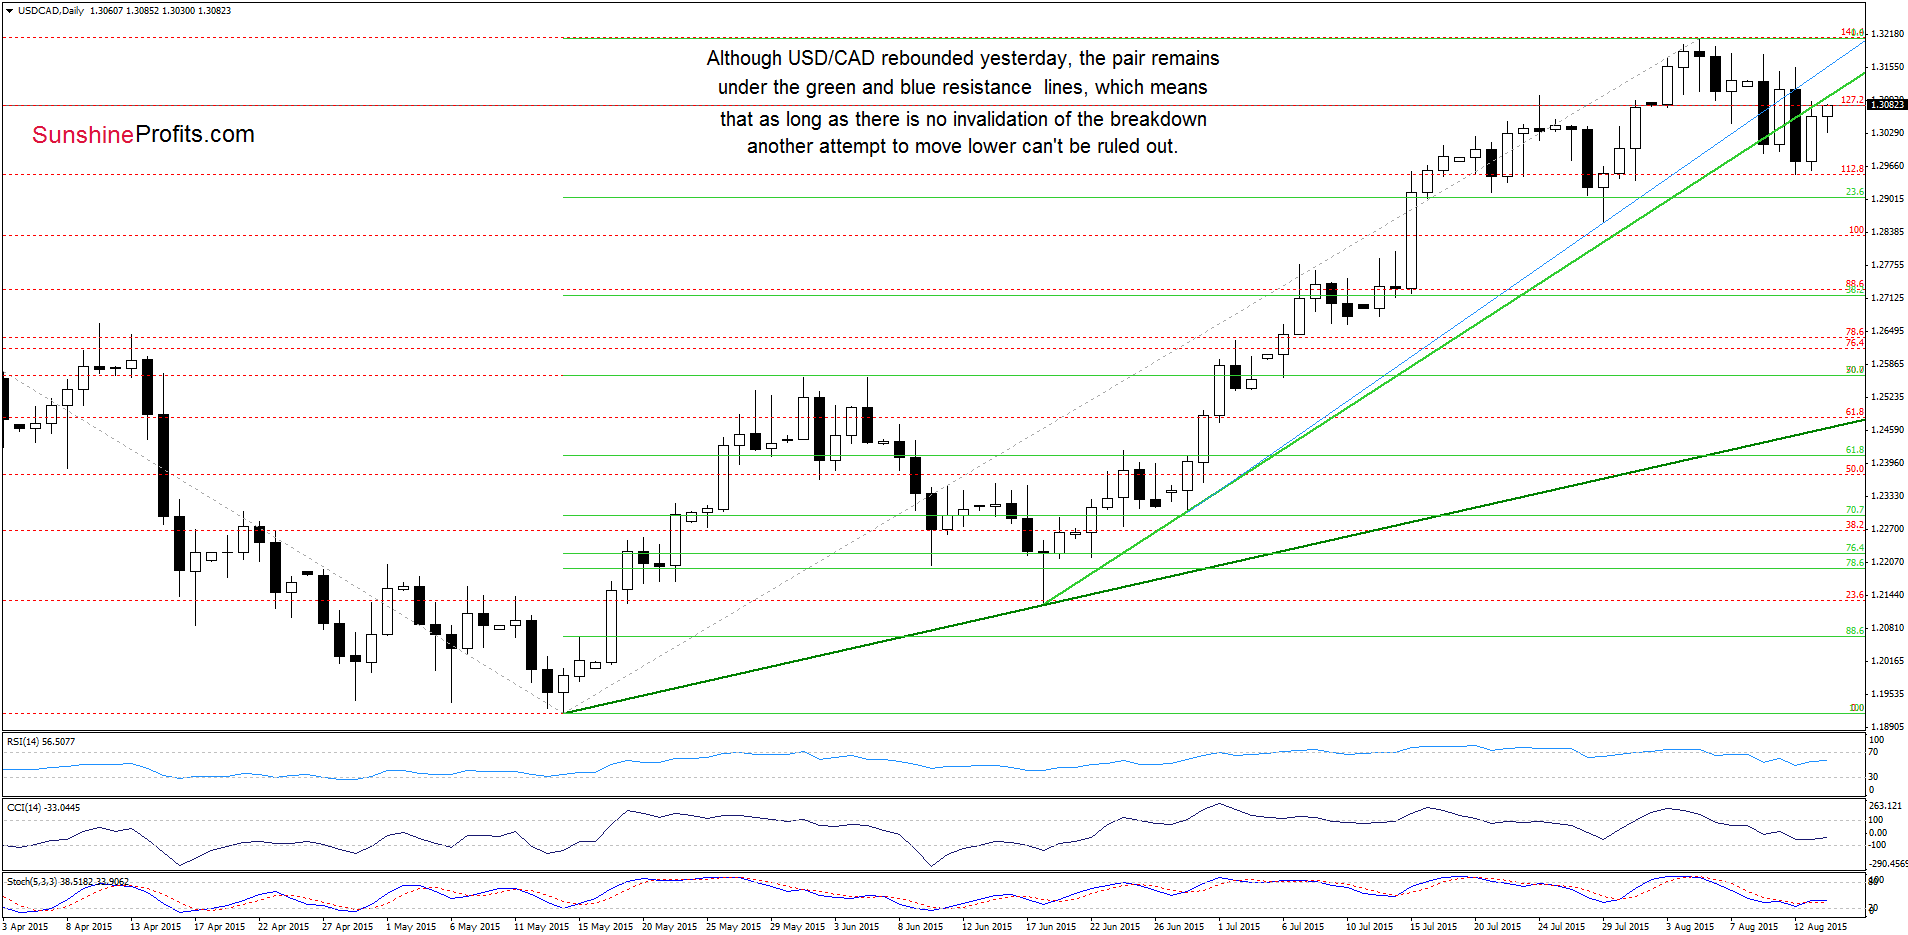
Quoting our last commentary on this currency pair:
(…) the current position of the Stochastic Oscillator (very close to generating a buy signal) suggests that currency bulls will likely try to push the pair higher – similarly to what we saw on Tuesday.
As you see on the daily chart the situation developed in line with the above scenario and USD/CAD climbed to the previously-broken green line (which serves as the nearest resistance at the moment). Despite this improvement, currency bulls didn’t manage to invalidate earlier breakdown, which suggests that this upward move could be just a verification of the breakdown. If this is the case, the exchange rate will decline from here and test the recent lows in the coming day(s).
Very short-term outlook: mixed
Short-term outlook: mixed
MT outlook: mixed
LT outlook: mixed
Trading position (short-term; our opinion): No positions are justified from the risk/reward perspective at the moment. We will keep you informed should anything change, or should we see a confirmation/invalidation of the above.
USD/CHF
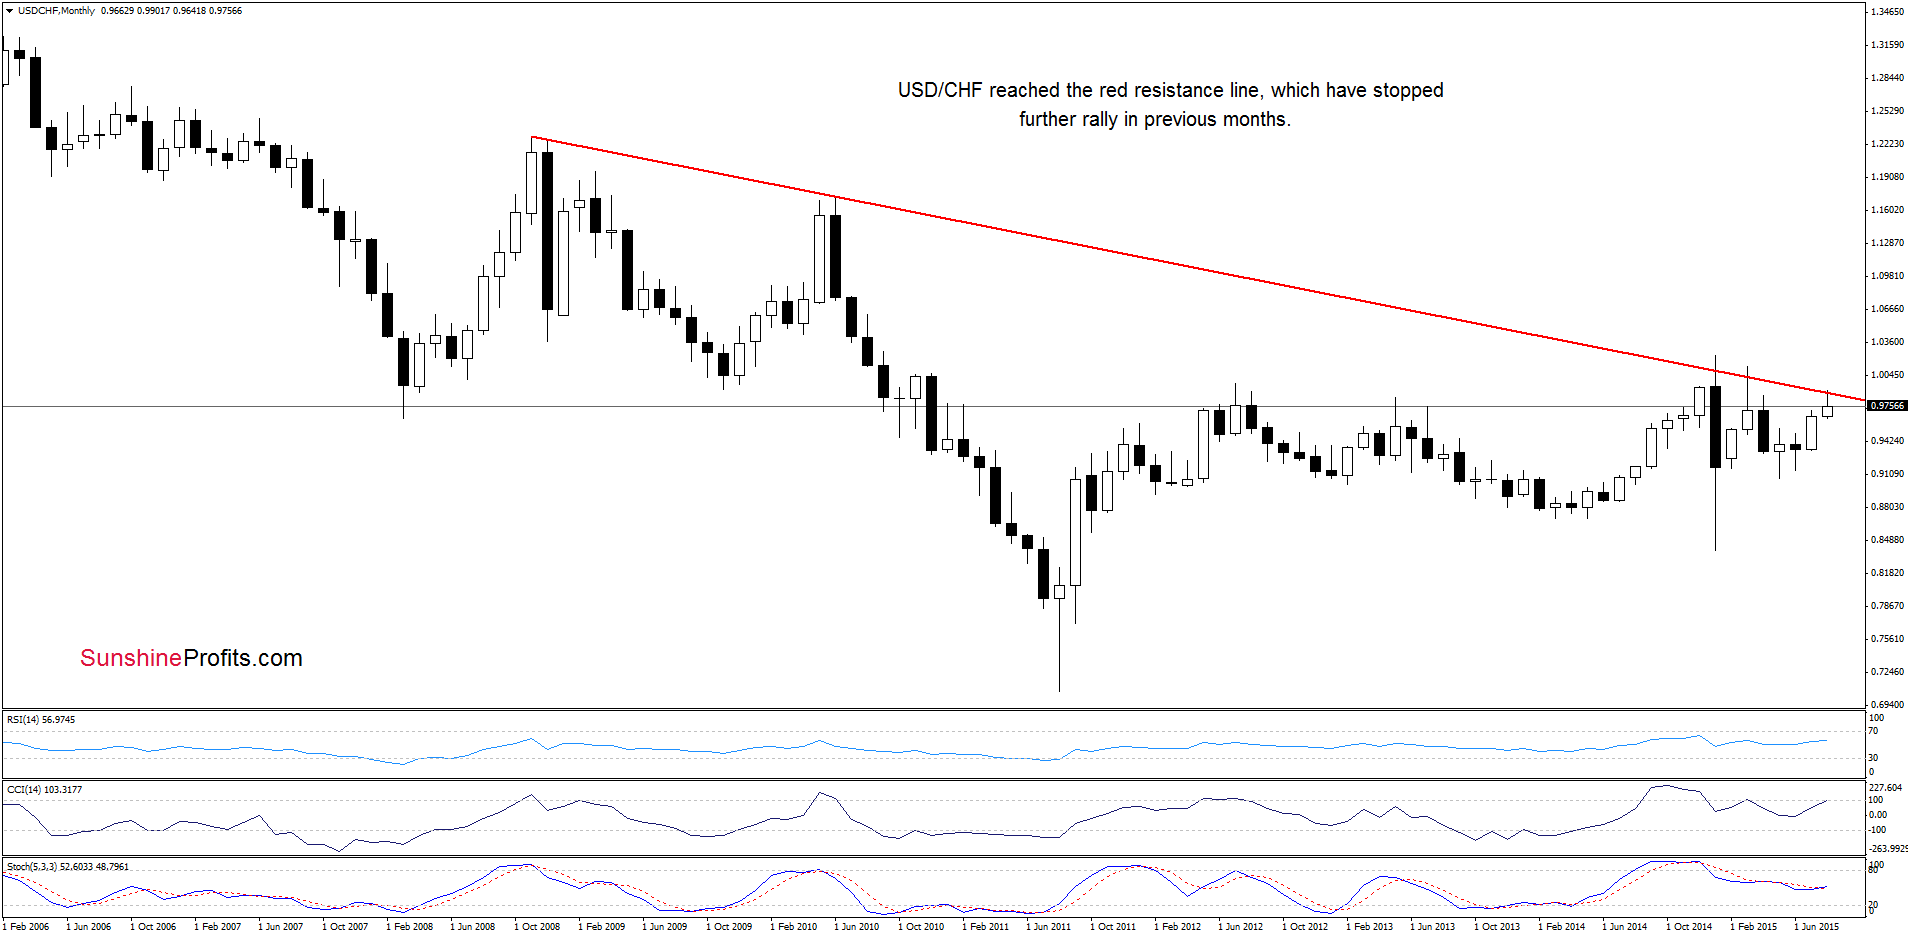
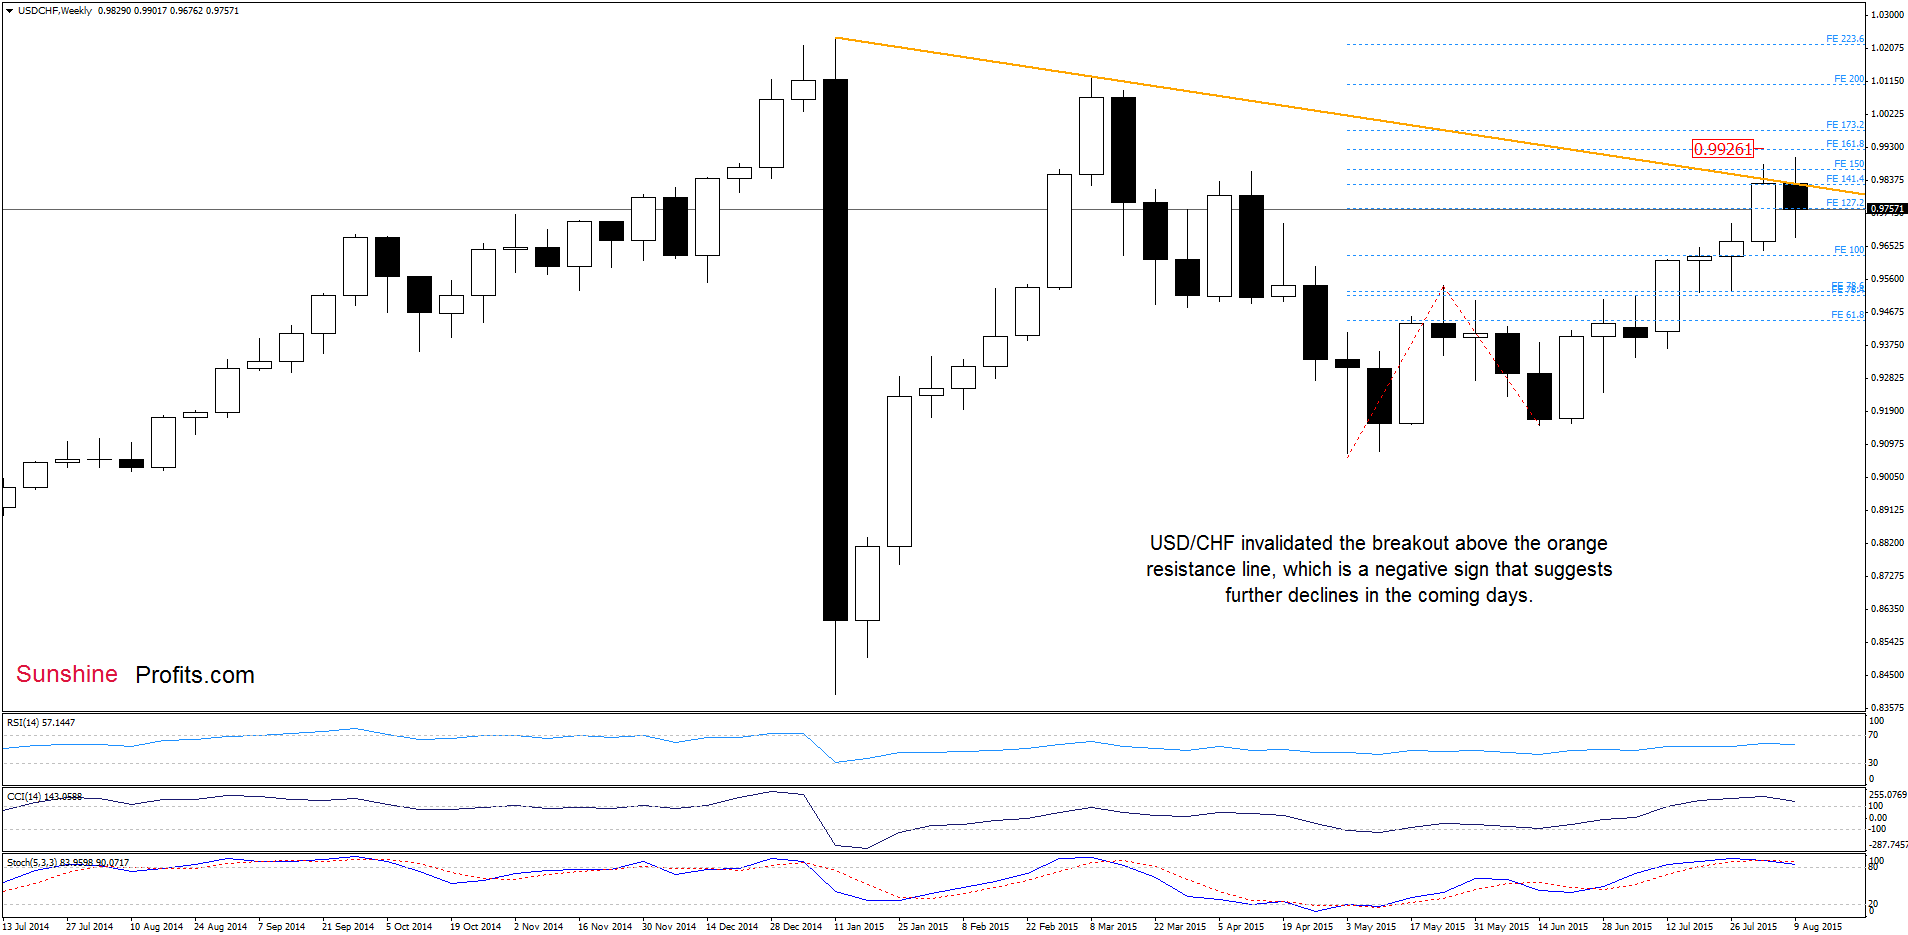
On the above charts, we see that USD/CHF is trading below the red and orange resistance lines, which means that an invalidation of the breakout above the orange line and its negative impact on the exchange rate is still in effect, suggesting further deterioration in the coming week.
Can we infer something more from the very short-term chart? Let’s check.
In our Forex Trading Alert posted on Wednesday, we wrote:
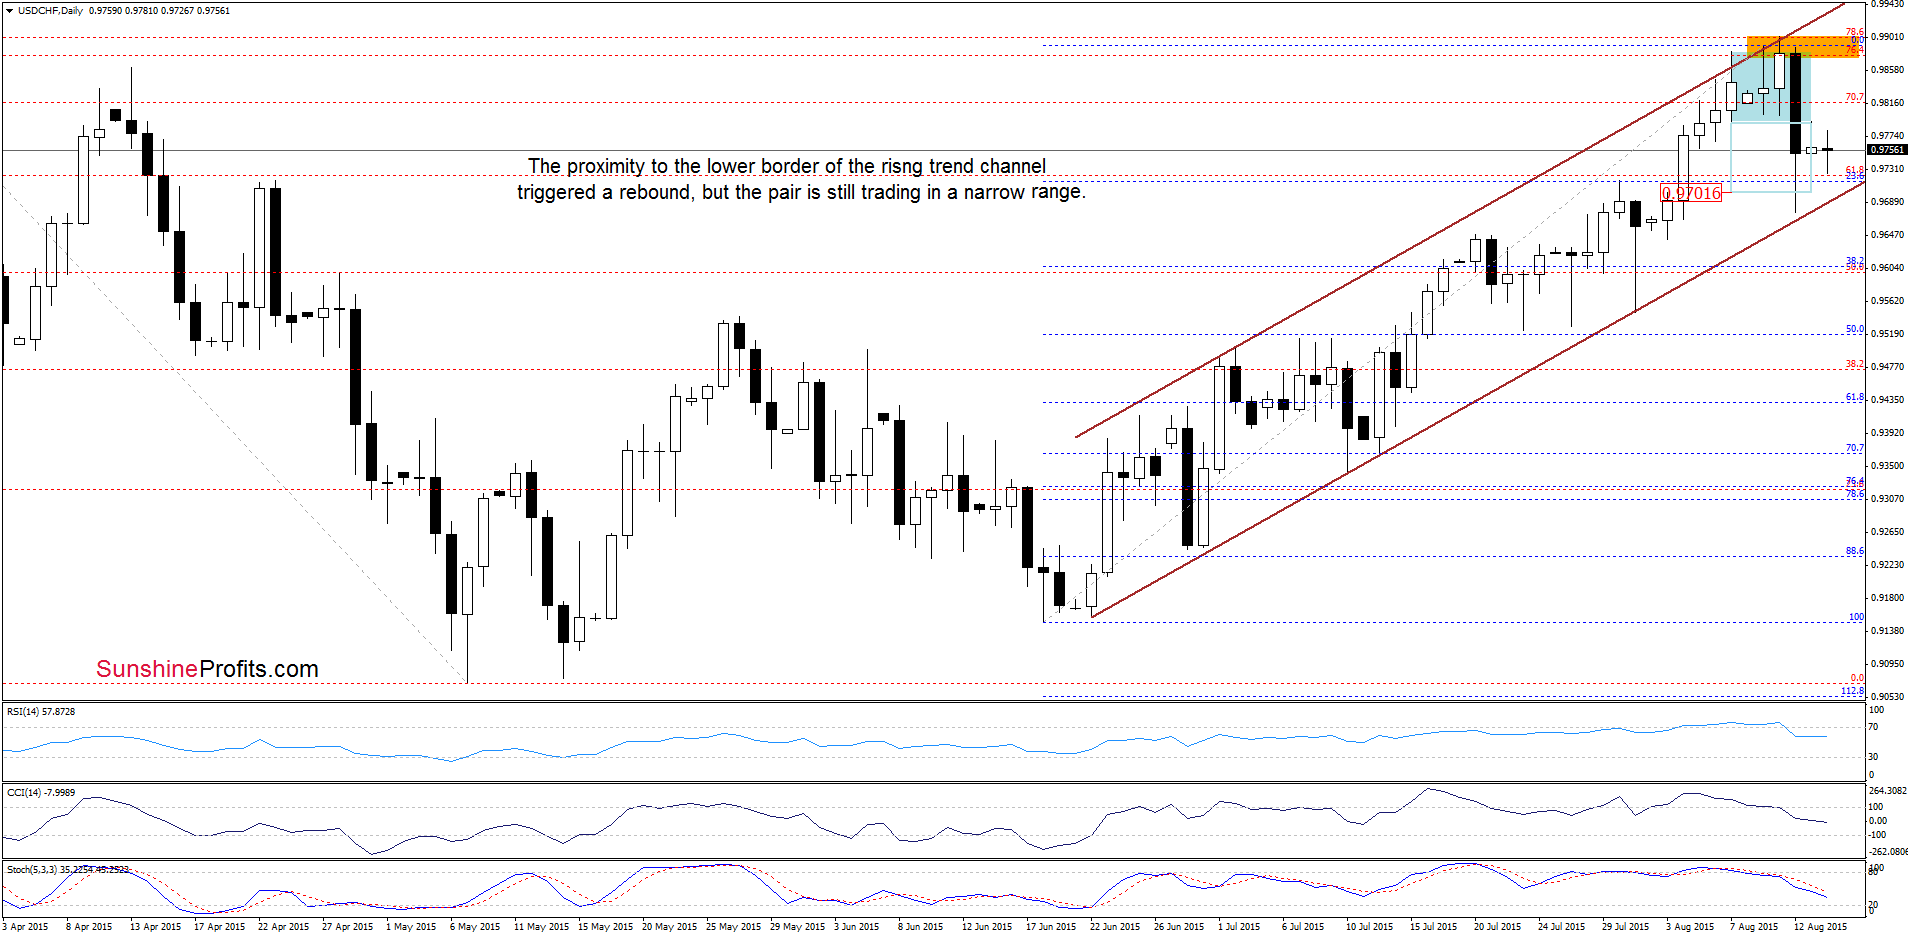
(…) the exchange rate remains below the lower border of the consolidation, which suggests that we may see a drop to 0.9701, where the size of the downward move will correspond to the height of the formation. If this area is broken, the next downside target would be around 0.9664, where the lower border of the brown rising trend channel is.
Looking at the daily chart we see that currency bears pushed USD/CHF lower as we had expected. With this downswing, the pair approached the lower border of the brown rising trend channel, which triggered a rebound yesterday. Despite this move, the previously-broken lower border of the consolidation stopped further improvement and USD/CHF erase some of earlier rebound. Taking this fact into account, and combining it with sell signals generated by the indicators, it seems that we’ll see another test of the brown support line in the coming days.
Very short-term outlook: mixed with bearish bias
Short-term outlook: mixed with bearish bias
MT outlook: mixed
LT outlook: mixed
Trading position (short-term; our opinion): No positions are justified from the risk/reward perspective at the moment. We will keep you informed should anything change, or should we see a confirmation/invalidation of the above.
AUD/USD
The situation in the medium term hasn’t changed much as AUD/USD remains between the 70.7% Fibonacci retracement (which serves as resistance) and the green support zone (based on the 76.4% and 78.6% Fibonacci retracement levels).
Will the very short-term chart give us more clues about future moves? Let’s check.
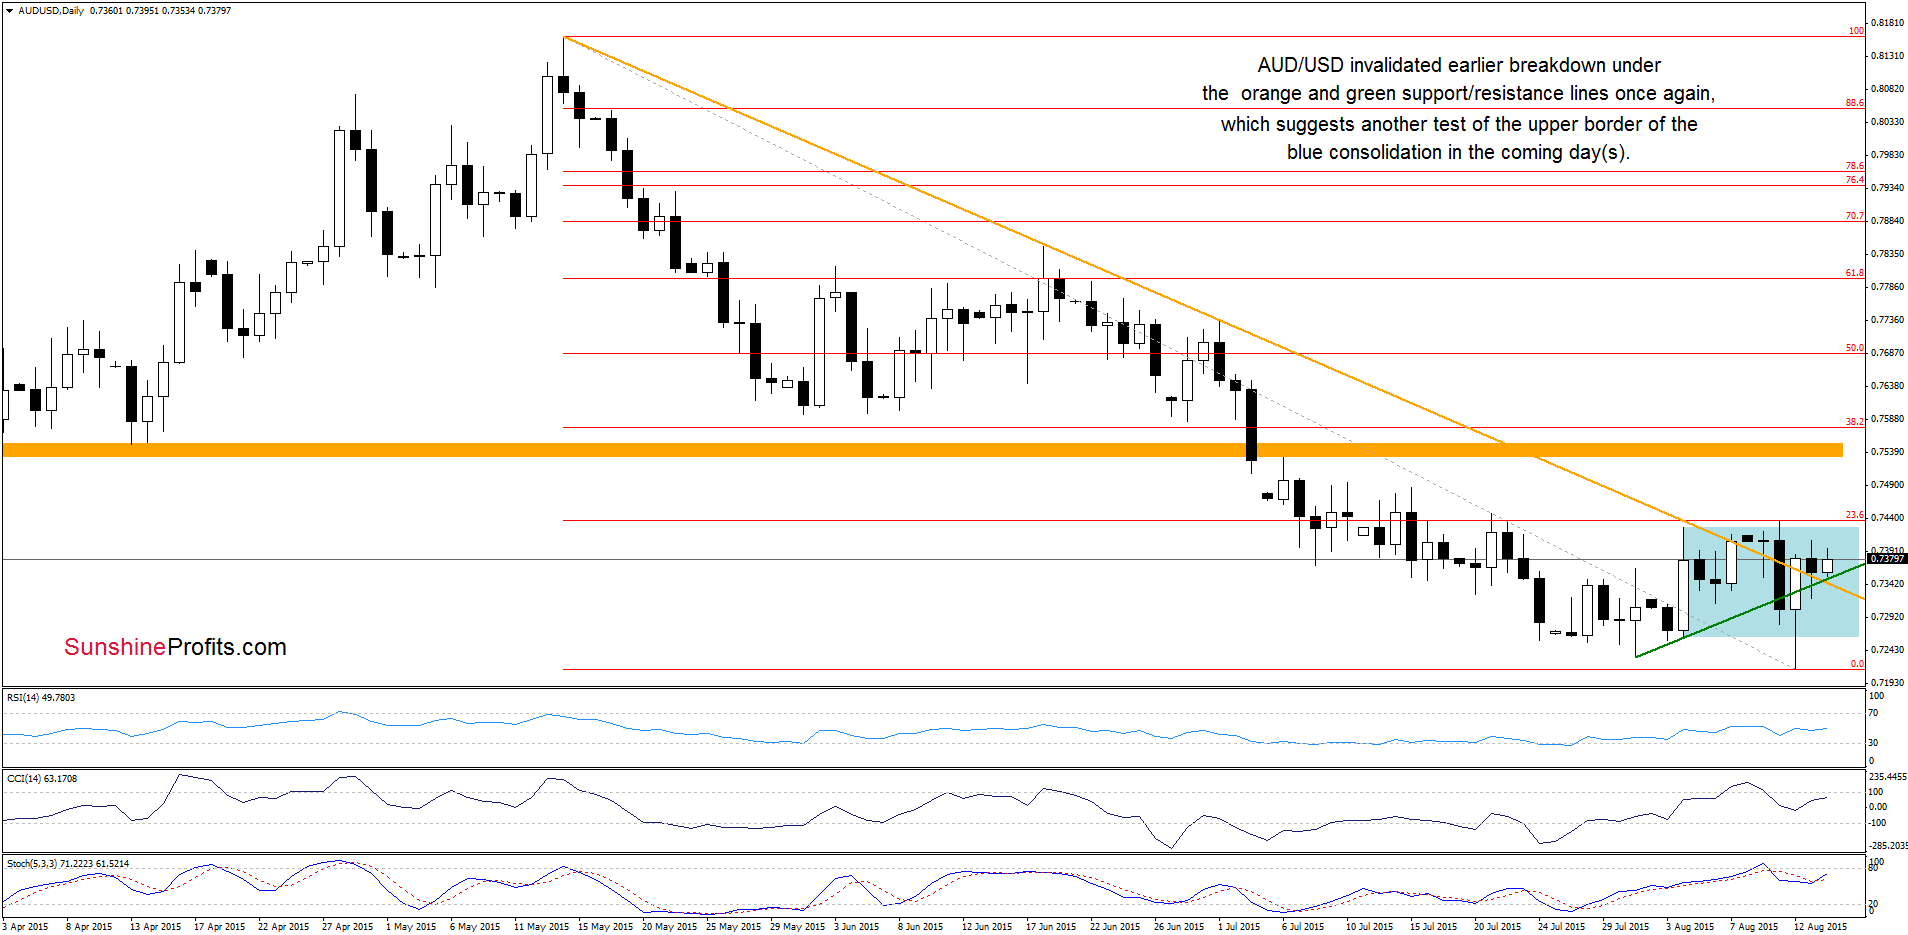
From today’s point of view we see that AUD/USD invalidated earlier breakdown under the orange and green support/resistance lines once again, which suggests that we’ll see another test of the upper border of the blue consolidation in the coming days. If it is broken, the next upside target would be the orange resistance zone (around 0.7531-0.7551).
Very short-term outlook: mixed with bullish bias
Short-term outlook: mixed
MT outlook: mixed
LT outlook: mixed
Trading position (short-term; our opinion): No positions are justified from the risk/reward perspective at the moment. We will keep you informed should anything change, or should we see a confirmation/invalidation of the above.
Thank you.
Nadia Simmons
Forex & Oil Trading Strategist
Przemyslaw Radomski, CFA
Founder, Editor-in-chief
Gold & Silver Trading Alerts
Forex Trading Alerts
Oil Investment Updates
Oil Trading Alerts

