

In our opinion, the following forex trading positions are justified - summary:
EUR/USD: none
GBP/USD: none
USD/JPY: none
USD/CAD: none
USD/CHF: none
AUD/USD: none
All of the currency pairs that we cover in our Forex Trading Alerts have one thing in common – all of them involve the US Dollar. In today’s issue we will focus on this particular currency by analyzing the USD Index from long- and short-term perspectives. This will put the most recent price swings in a bigger picture and should help to differentiate between important and rather random moves. Let’s start with the long-term chart (charts courtesy of http://stockcharts.com).
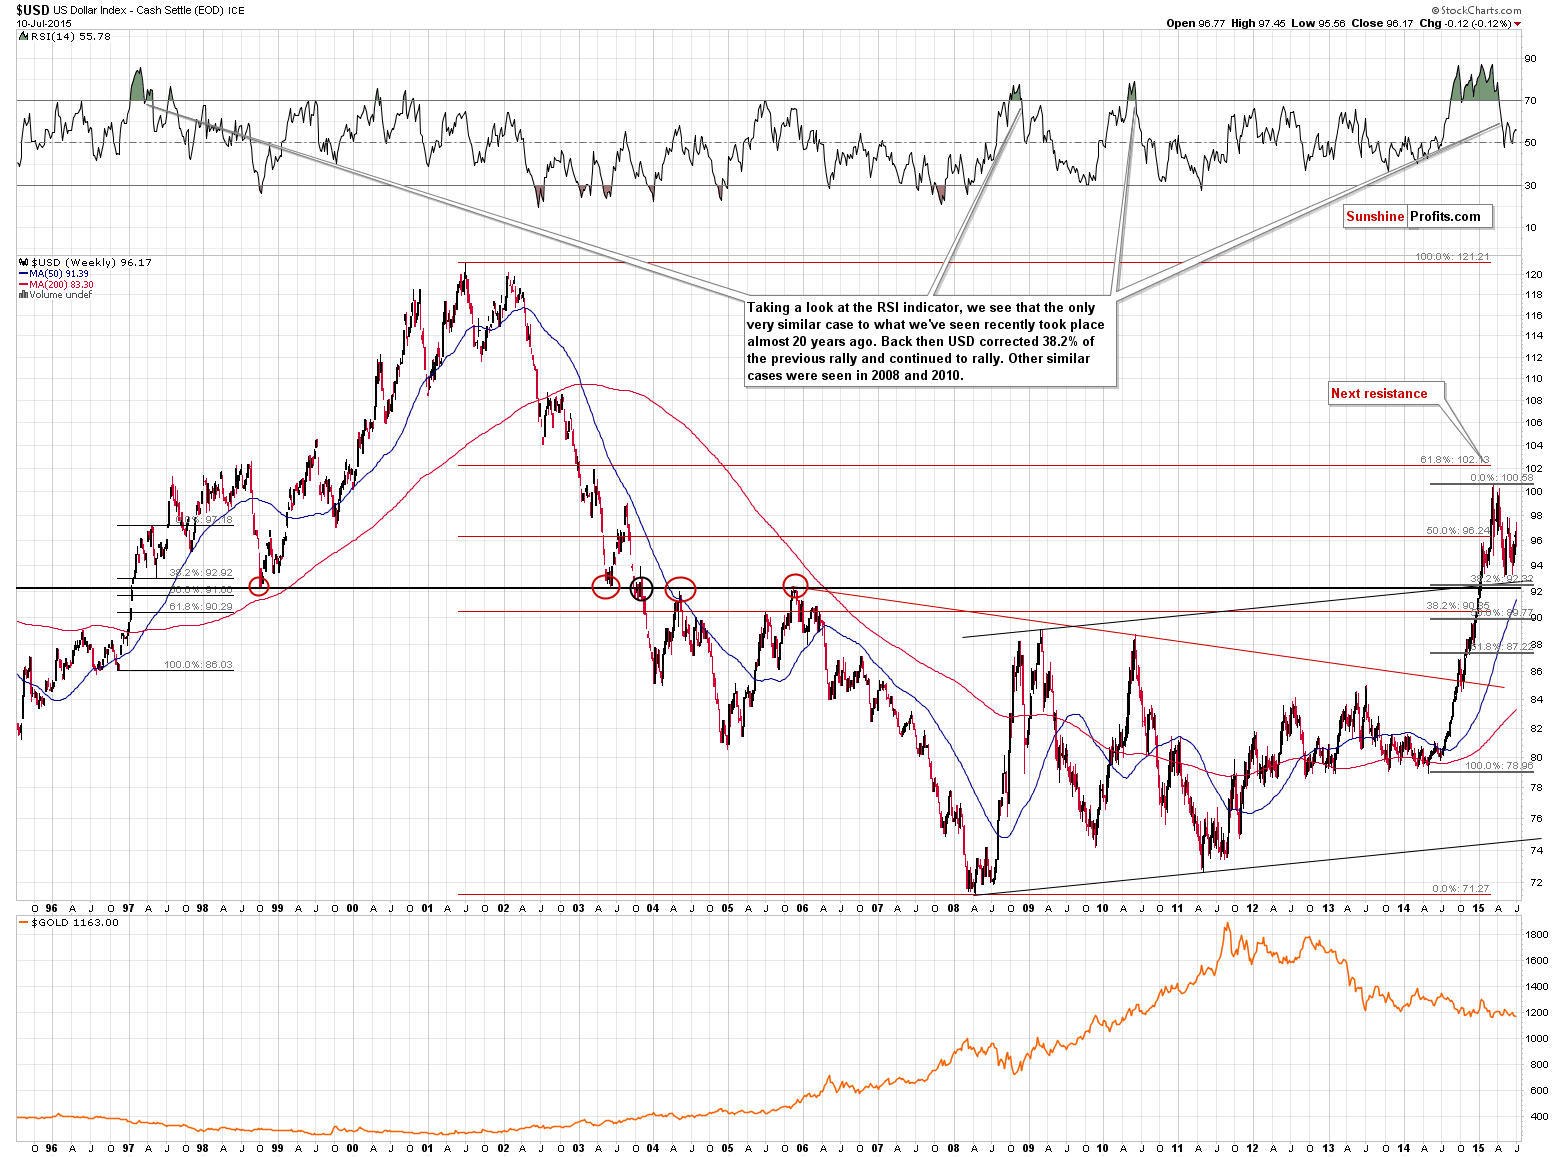
The above chart shows that (based on the RSI Indicator) there were 3 cases that were similar to what we’ve seen in the last several months. The most similar one was seen about 20 years ago and the less similar ones were seen in 2008 and 2010. In these cases, USD Index rallied sharply and significantly higher causing the RSI to move well above the 70 level. Since no market can move in one direction without periodical corrections, in all cases USD corrected. The same thing is the case right now.
The key question, however, is if the move lower is just a correction within a rally (like it was the case about 20 years ago) or the beginning of a bigger move lower (like in 2008 and 2010). If there was something that happened differently 20 years ago and in 2008 and 2010 cases, then perhaps we can better estimate what we should expect this time. The kind of move lower that is more similar to the current decline is likely to be the kind of move that will continue to be seen in the following weeks.
The things that we saw in 1997 and that we didn’t see in 2008 and 2010 were the double-bottom formation at / above the 38.2% Fibonacci retracement and the subsequent strength. In 2008 and 2010, there was no meaningful breakout above the short-term consolidation, while in 1997 we could see a move higher after the second bottom (and before the USD really took off).
What are we seeing now?
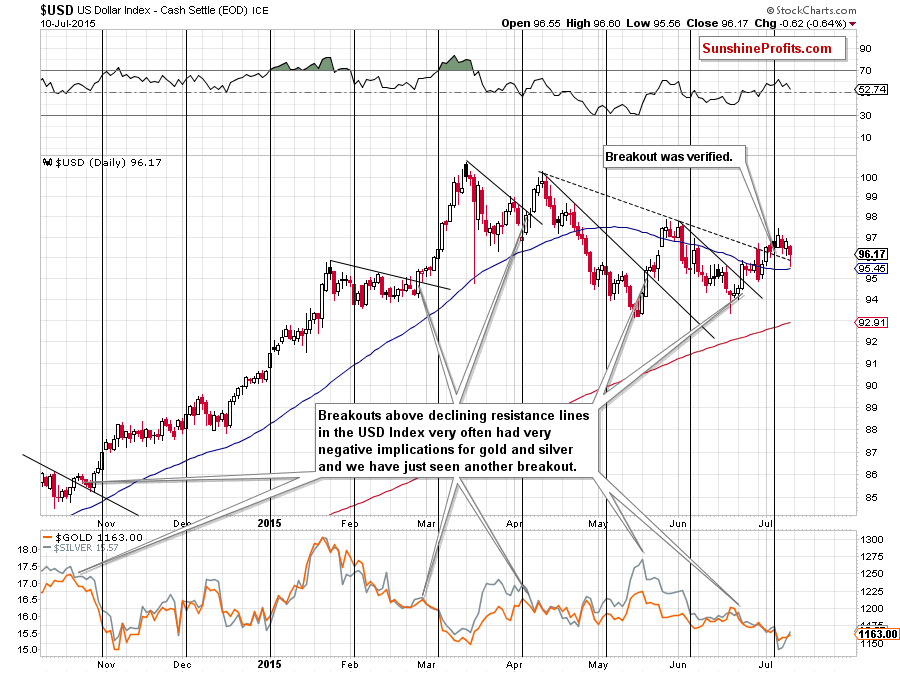
USD Index formed a double bottom (May and June bottoms) recently and it now confirmed the breakout above the declining resistance line. The post-major-rally consolidation is therefore much more similar to what we saw in 1997 than what we saw in 2008 and 2010. The implications are very bullish as back in 1997 a sharp rally was seen relatively shortly after the double bottom.
Is the above very likely to result in much higher USD values shortly? It’s likely, but not extremely likely. The USD Index is once again showing strength today, but we would like to see the beginning of another rally more clearly before saying that a much more profound move is underway.
Summing up, it seems that we are quite close to another significant trading opportunity (just like what we have in crude oil and precious metals) on the currency market, but not yet at it. We’ll keep you informed.
Thank you.
Nadia Simmons
Forex & Oil Trading Strategist
Forex Trading Alerts
Oil Investment Updates
Oil Trading Alerts

