

Yesterday’s referendum showed that Greeks rejected conditions for a bailout package, which added to worries over county’s future in the euro zone. As a result, the common currency moved sharply lower against the greenback, reaching the last week’s lows. Will we EUR/USD below 1.0950 in the coming days?
In our opinion the following forex trading positions are justified - summary:
EUR/USD
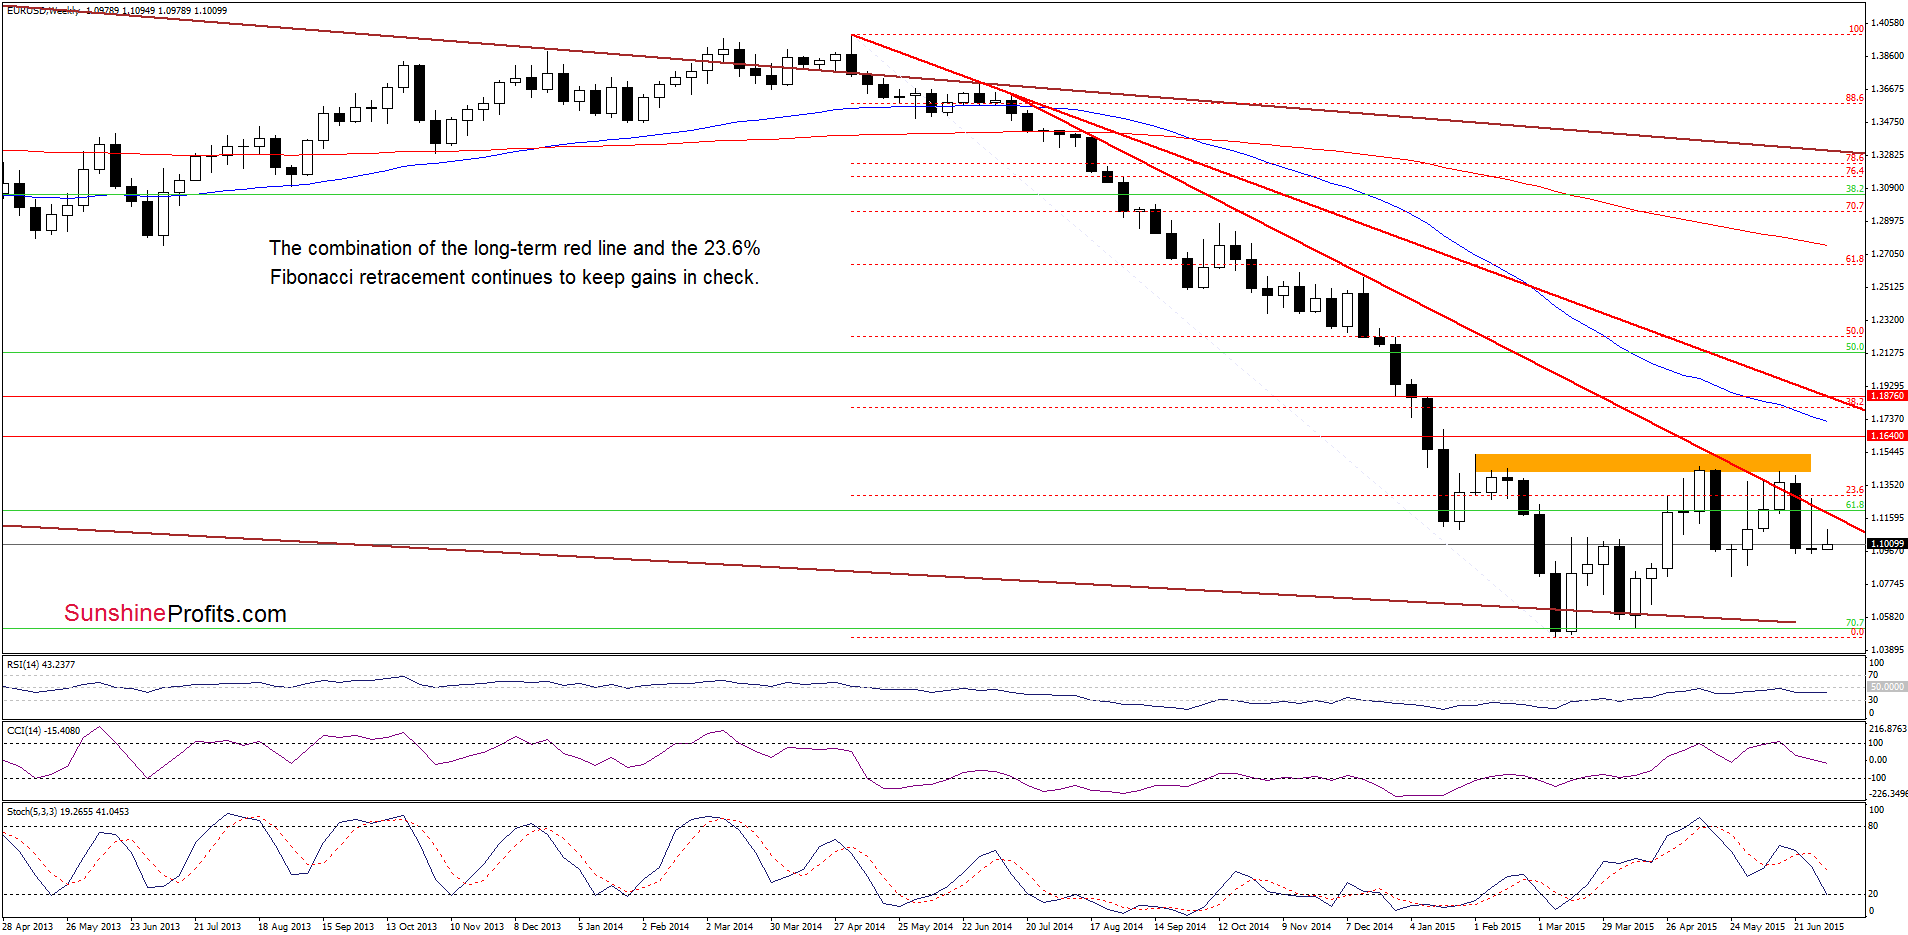
The situation in the medium term hasn’t changed much as EUR/USD is trading in a narrow range under the previously-broken long-term red declining line and the 23.6% Fibonacci retracement, which together continue to keep gains in check.
Having said that, let’s take a closer look at the daily chart.
Quoting our previous alert:
(…)If (…) the exchange rate declines from there, it would be a negative signal, which will suggest that (…) upswing is nothing more than a verification of the breakdown. In this case, we’ll see another pullback and the initial downside target would be (…) the green support zone.
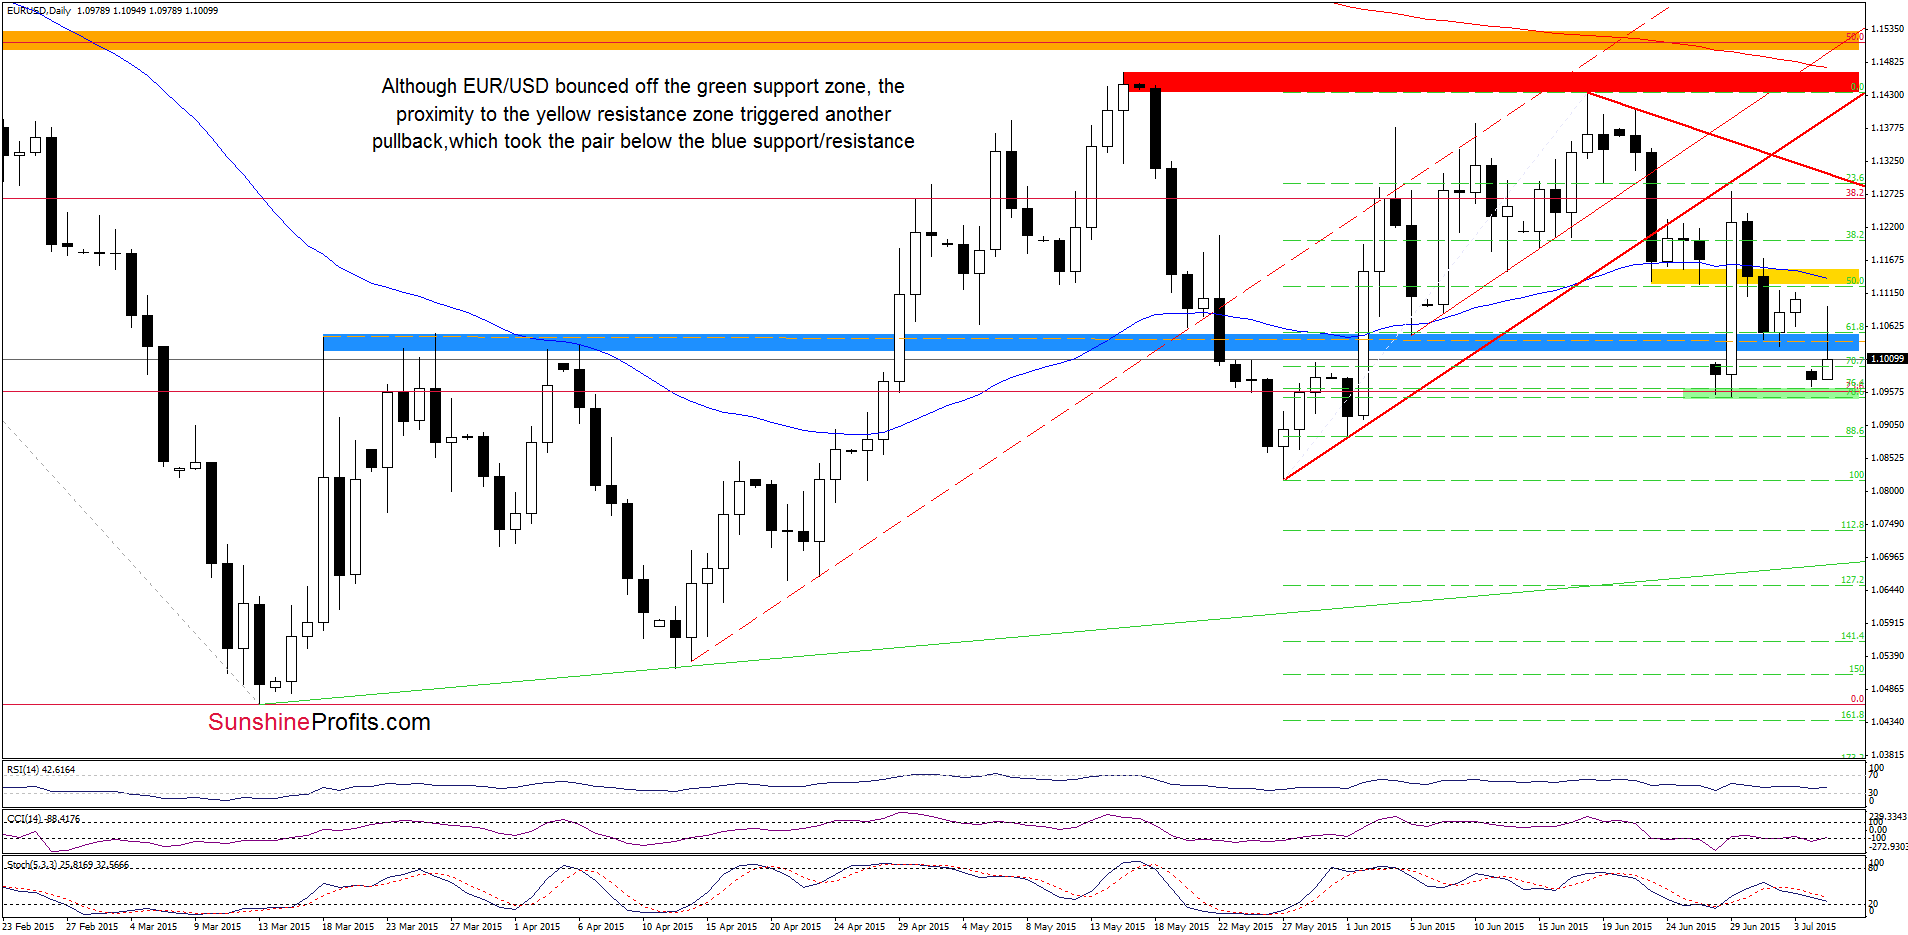
From this perspective, we see that currency bears pushed EUR/USD lower and the pair reached our downside target. Despite this drop, the green support zone encouraged currency bulls to act, which resulted in a sharp rebound earlier today. Although the pair climbed above the blue support/resistance line, invalidating earlier breakdown, the proximity to the yellow resistance zone triggered a pullback, which erased most of today’s rally. Taking this fact into account, we think that another test of the green support zone is just around the corner. Nevertheless, in our opinion, as long as there is no breakdown below it further declines are questionable and one more rebound should not surprise us.
Very short-term outlook: mixed
Short-term outlook: mixed
MT outlook: mixed
LT outlook: mixed
Trading position (short-term; our opinion): No positions are justified from the risk/reward perspective at the moment. We will keep you informed should anything change, or should we see a confirmation/invalidation of the above.
USD/CAD
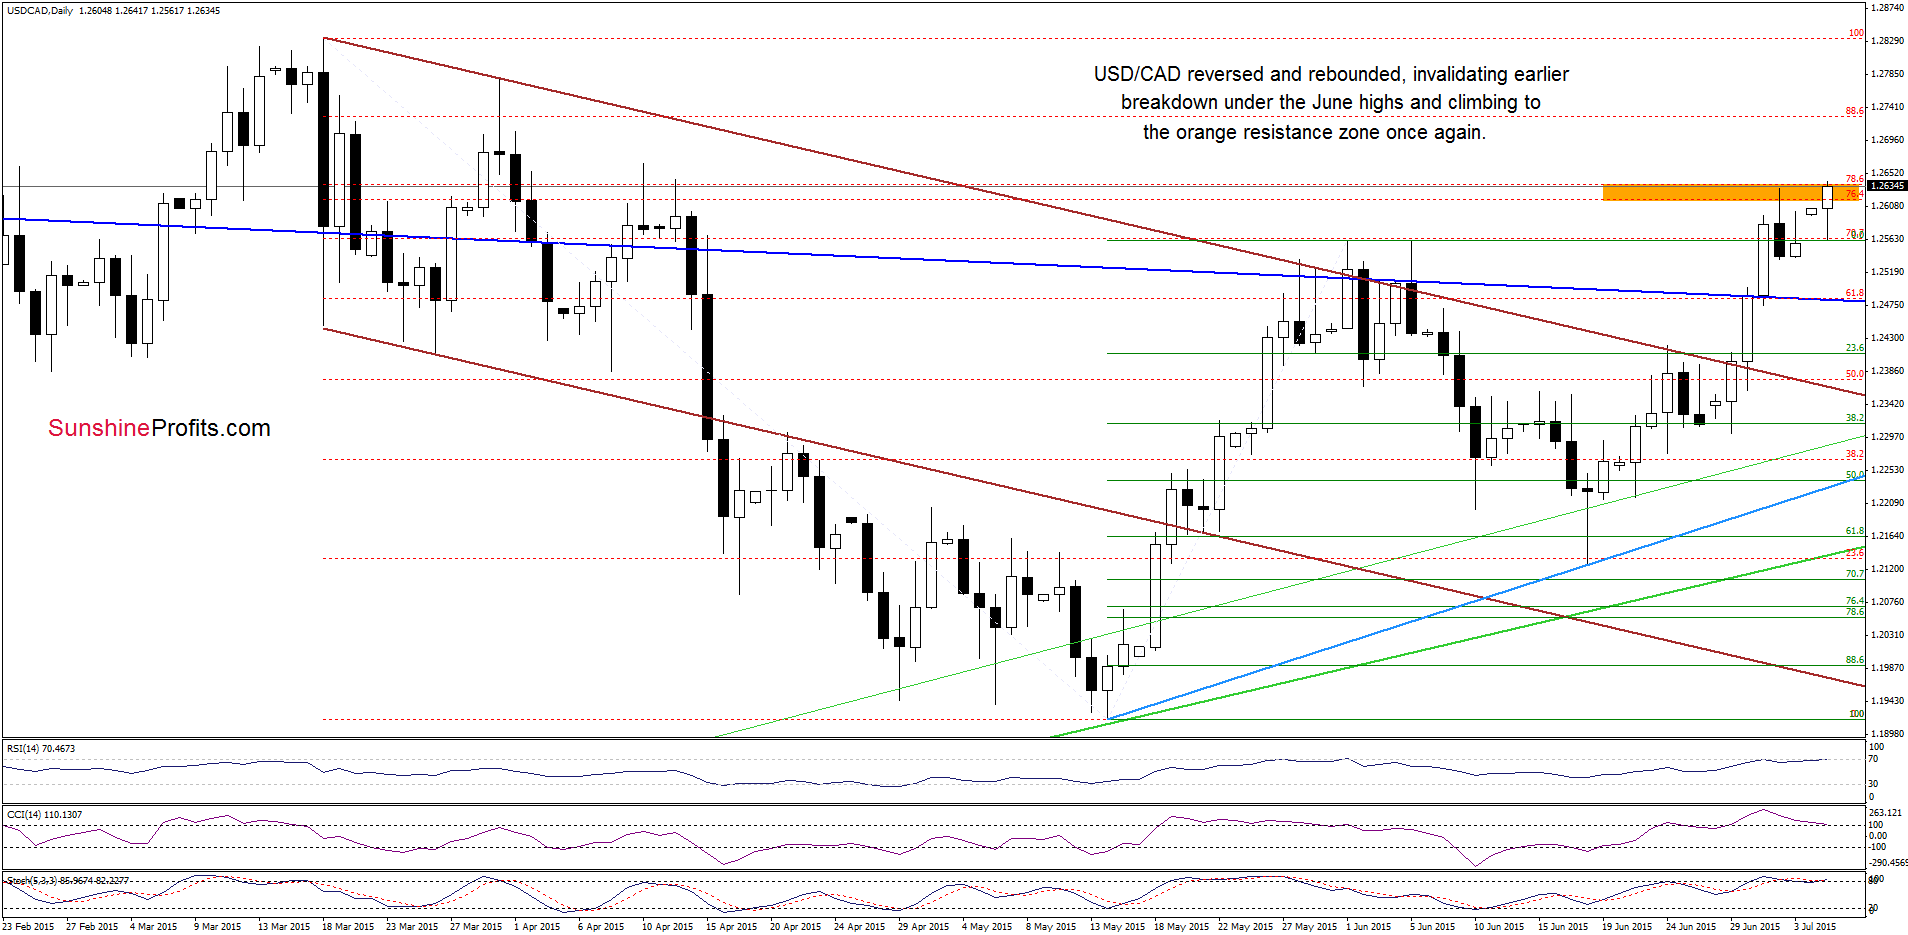
Looking at the daily chart, we see that although USD/CAD closed Friday’s session below the June highs, the pair rebounded once again. With this upswing, the exchange rate climbed to the upper border of the orange zone (created by the 76.4% and 78.6% Fibonacci retracement levels), which suggests that a potential breakout above this resistance will likely trigger further improvement. Will we see such price action in the coming week? Taking into account the current position of the indicators (the CCI and Stochastic Oscillator are overbought, while the RSI reached the level of 70), we think that even if USD/CAD moves higher from here, the space for gains is limited and correction is just around the corner.
Are there any other factors that could encourage currency bears to act? Let’s examine the weekly chart and find out.
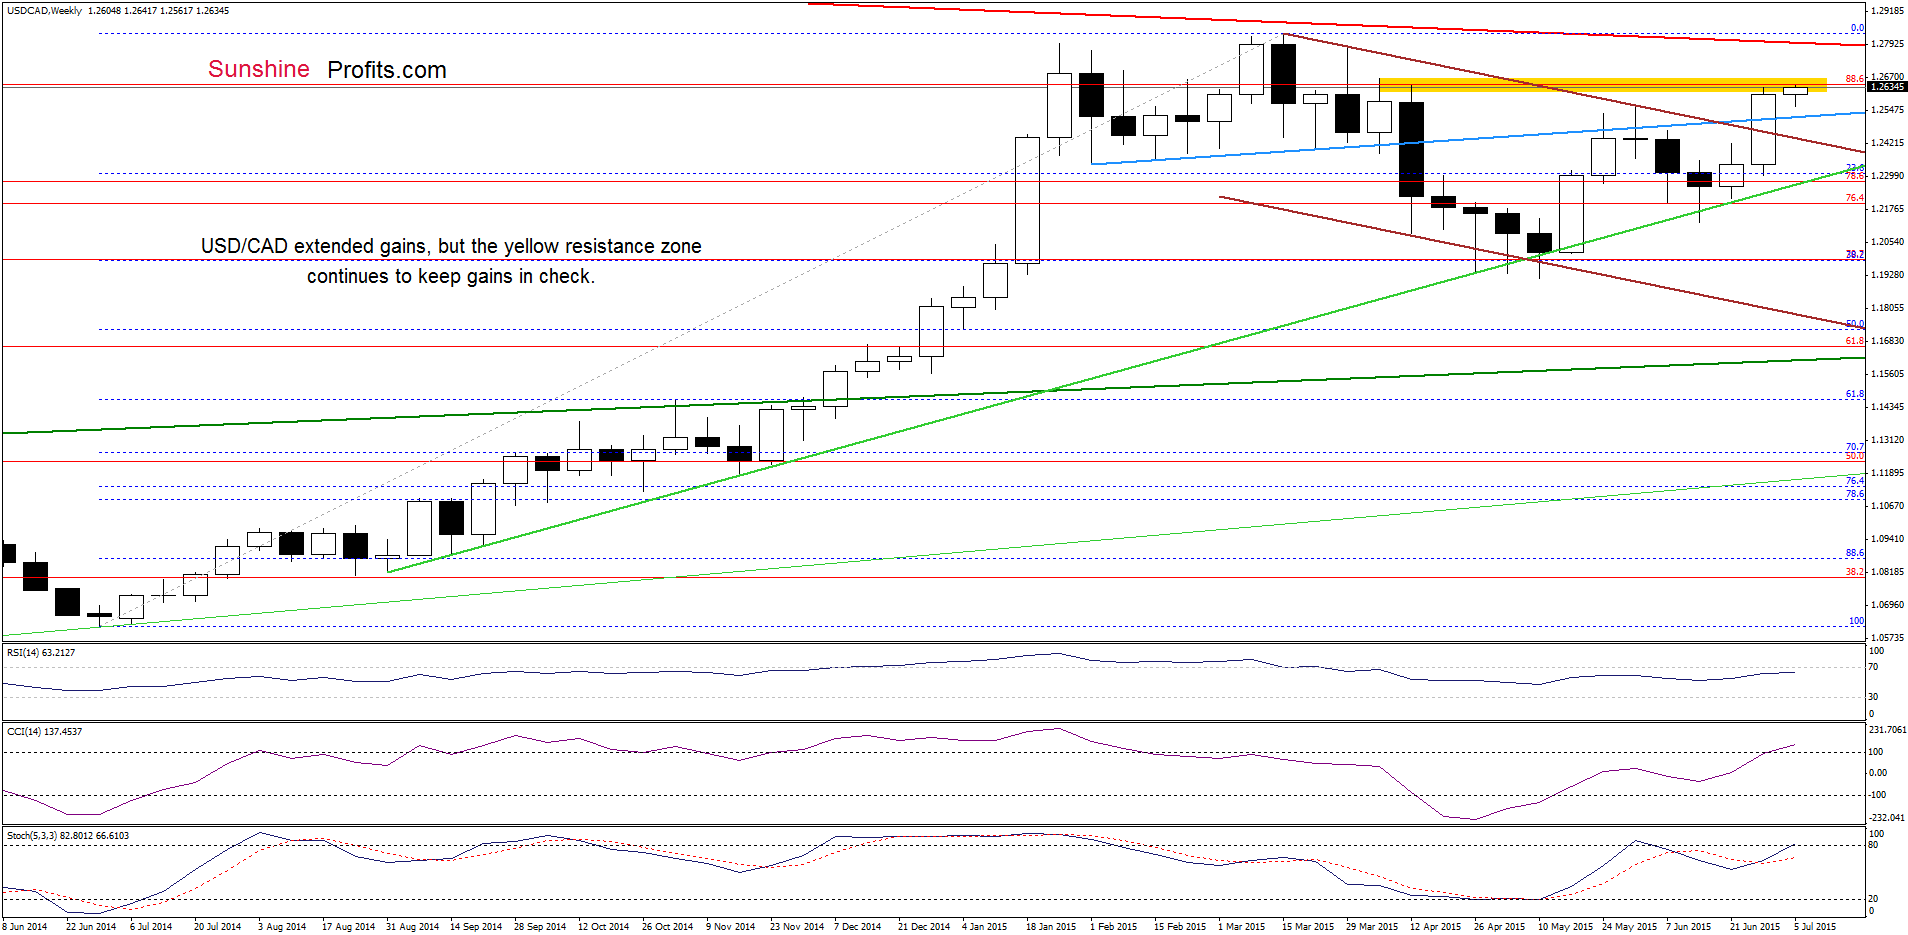
From this perspective, we see that although USD/CAD extended gains, the yellow resistance zone (created by the Apr highs and the 88.6% Fibonacci retracement) continues to keep gains in check, which suggests that as long as there is no breakout above this area further rally is questionable and another pullback is likely. If this is the case, and the pair moves lower from here, the initial downside target would be the previously-broken blue line.
Very short-term outlook: mixed
Short-term outlook: mixed
MT outlook: mixed
LT outlook: mixed
Trading position (short-term; our opinion): No positions are justified from the risk/reward perspective at the moment. We will keep you informed should anything change, or should we see a confirmation/invalidation of the above.
AUD/USD
In our Friday’s Forex Trading Alert we wrote the following:
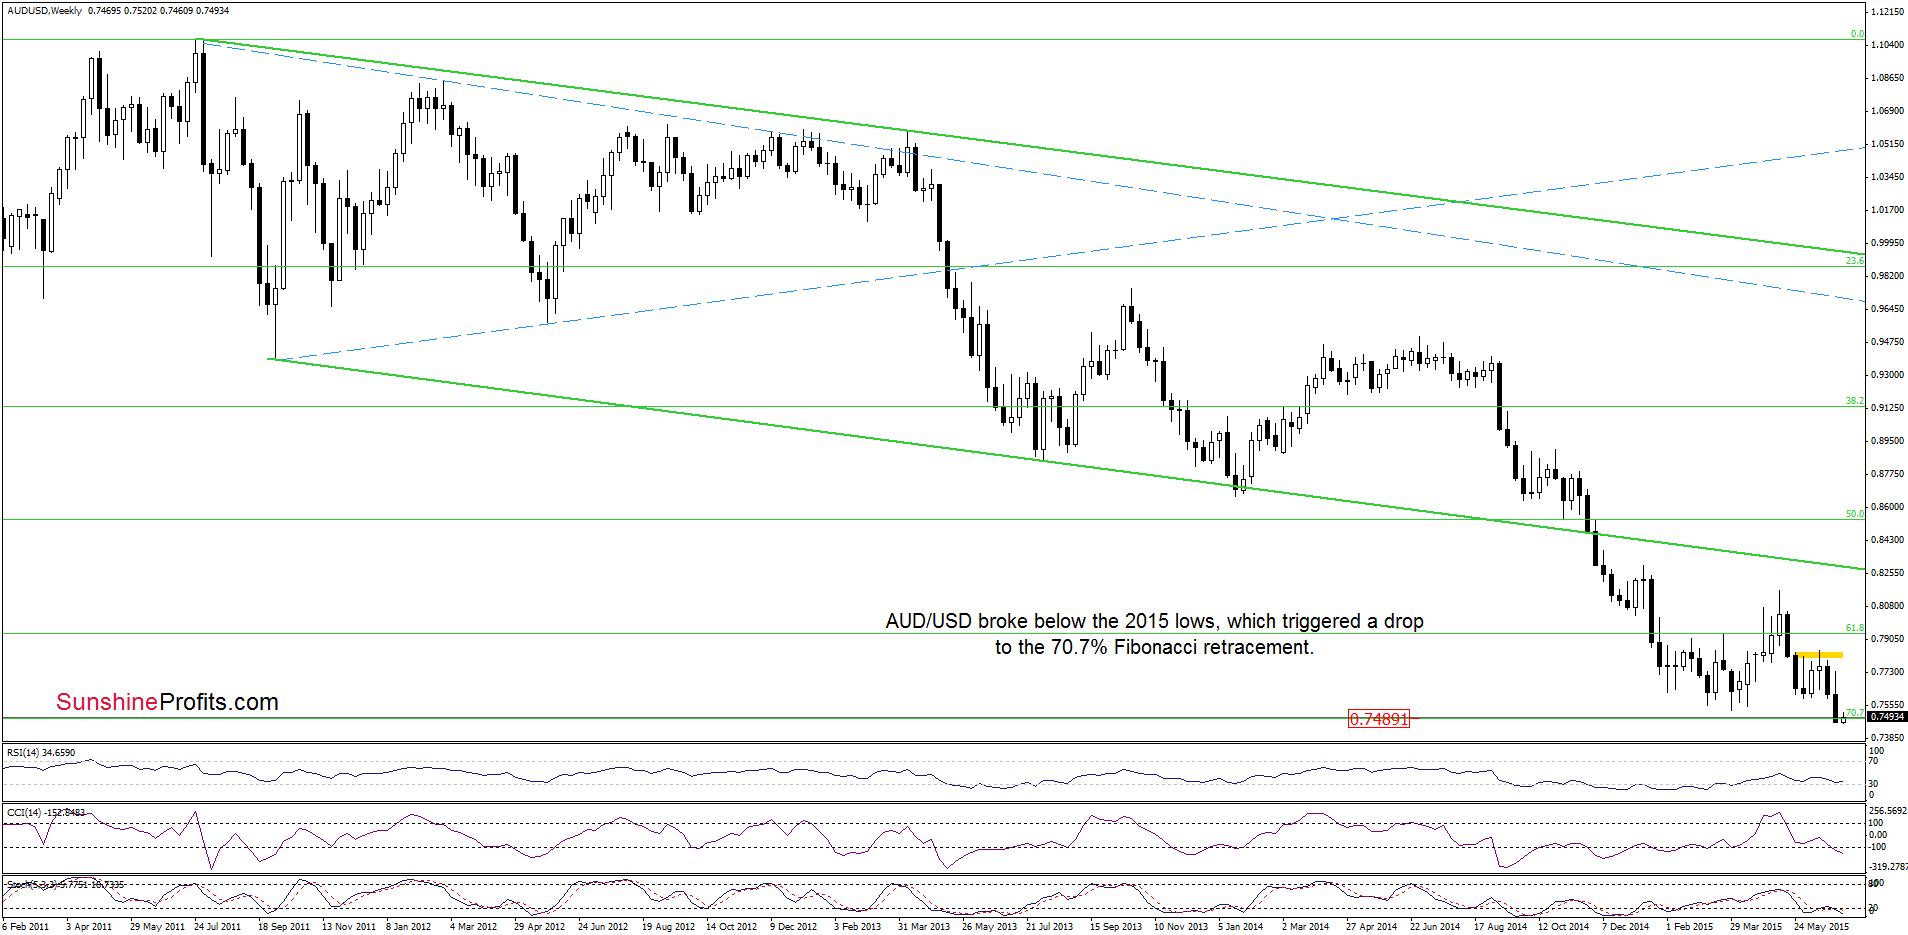
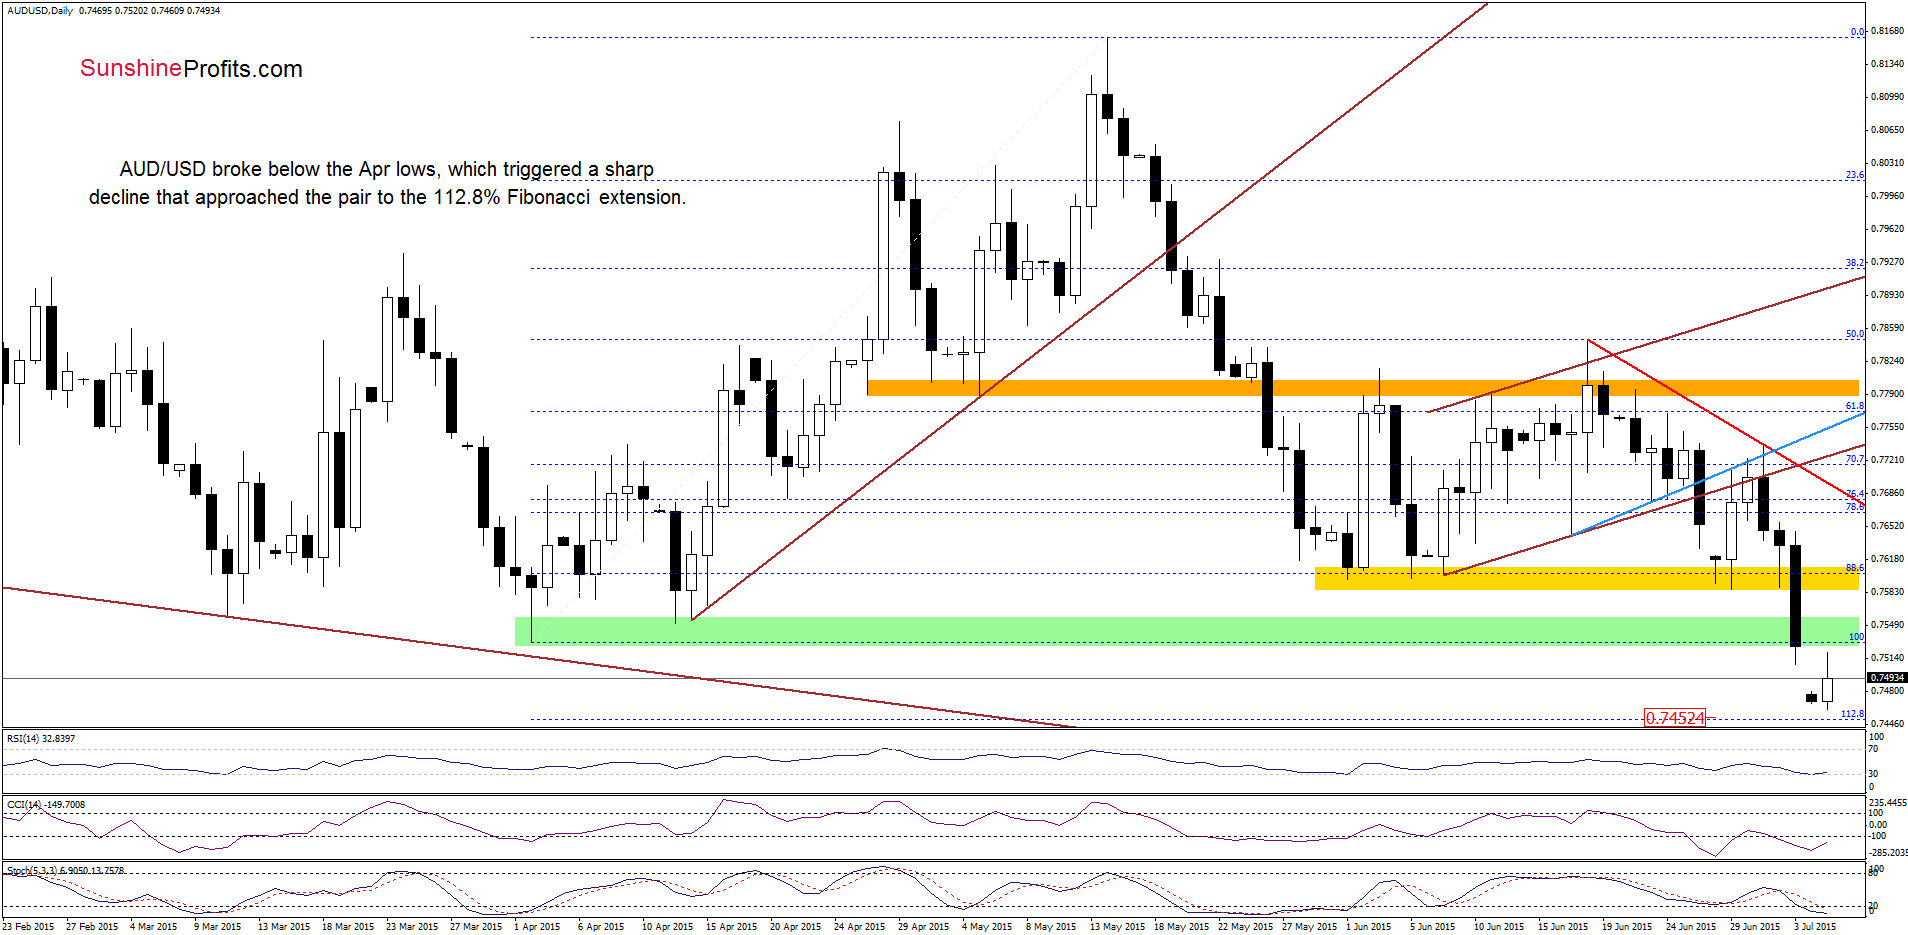
(…) currency bears (…) took AUD/USD (…) below Apr lows (…), which suggests further deterioration (especially if the exchange rate closes today’s session below the green zone). How low could the pair go? In our opinion, the initial downside target would be around 0.7489, where the 70.7% Fibonacci retracement (marked on the weekly chart) is. If this support is broken, we may see a decline to around 0.7452 (the 112.8% Fibonacci extension based on the Apr-May rally marked on the daily chart).
As you see on the charts, the situation developed in line with the above scenario and AUD/USD declined below the 70.7% Fibonacci retracement, approaching the 112.8% Fibonacci extension. Although the exchange rate rebounded earlier today, invalidating earlier breakdown under Fibonacci retracement (which is a positive signal that suggests further improvement), the pair remains under the previously-broken green zone, which serves as the nearest resistance at the moment. Therefore, in our opinion, as long as there is no comeback above it, higher values of AUD/USD are not likely to be seen and another downswing should not surprise us. Please note that if the support level based on the 112.8% Fibonacci extension is broken, the next target for currency bears would be around 0.7345-0.7360, where the 127.2% extension and the long-term brown support line are.
Very short-term outlook: mixed with bearish bias
Short-term outlook: mixed
MT outlook: mixed
LT outlook: mixed
Trading position (short-term; our opinion): No positions are justified from the risk/reward perspective at the moment. We will keep you informed should anything change, or should we see a confirmation/invalidation of the above.
Thank you.
Nadia Simmons
Forex & Oil Trading Strategist
Forex Trading Alerts
Oil Investment Updates
Oil Trading Alerts

