

Yesterday, the International Monetary Fund confirmed that the Greek government failed to make a scheduled €1.6 billion loan repayment, which supported the greenback and pushed the USD Index to an intraday high of 95.89. Earlier today, news that Greece is ready to accept most conditions from its international creditors triggered further improvement in the index and took it above 96. What impact did this rally have on EUR/USD, USD/CAD and USD/CHF?
In our opinion the following forex trading positions are justified - summary:
EUR/USD
Quoting our previous Forex Trading Alert:
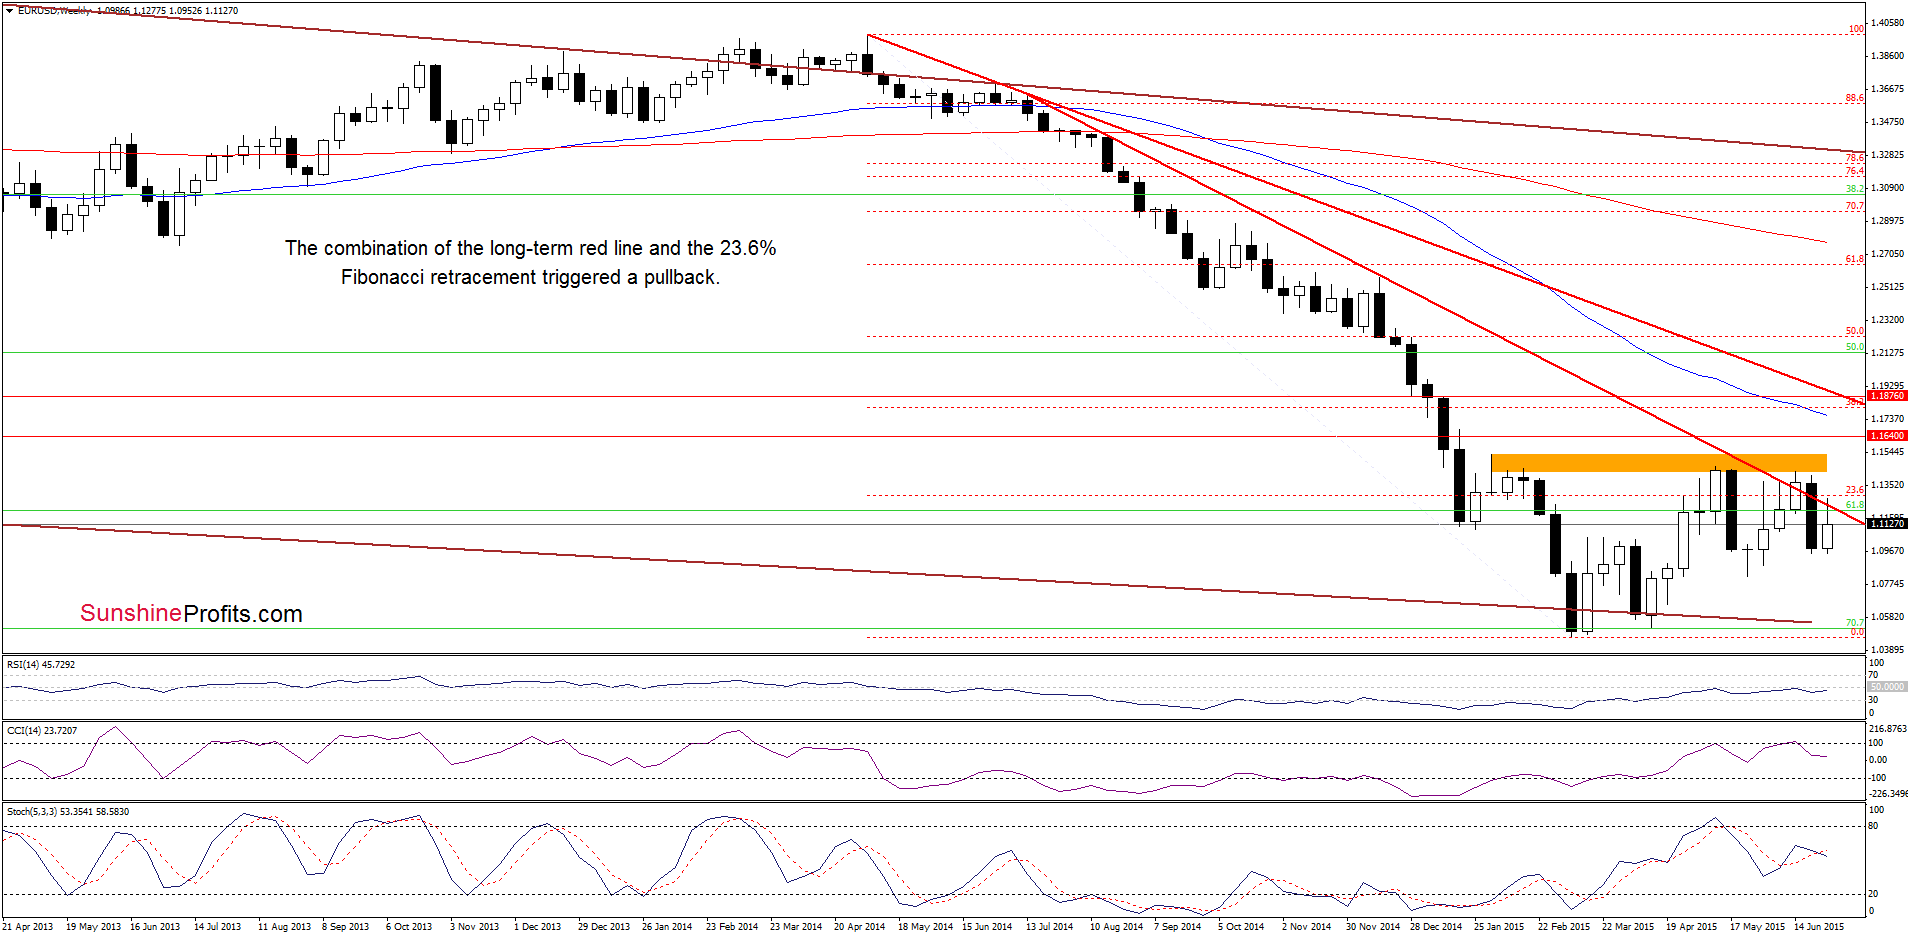
(…) although EUR/USD extended gains, the pair remains under the long-term red declining line and the 23.6% Fibonacci retracement. Yesterday, this resistance area stopped the rally, which suggests that as long as there is no comeback above it we won’t see a test of the orange resistance zone and a pullback from here should not surprise us.
Looking at the weekly chart, we see that the situation developed in line with the above scenario and currency bears pushed EUR/USD lower.
What impact did this move have on the very short-term picture? Let’s examine the daily chart and find out.
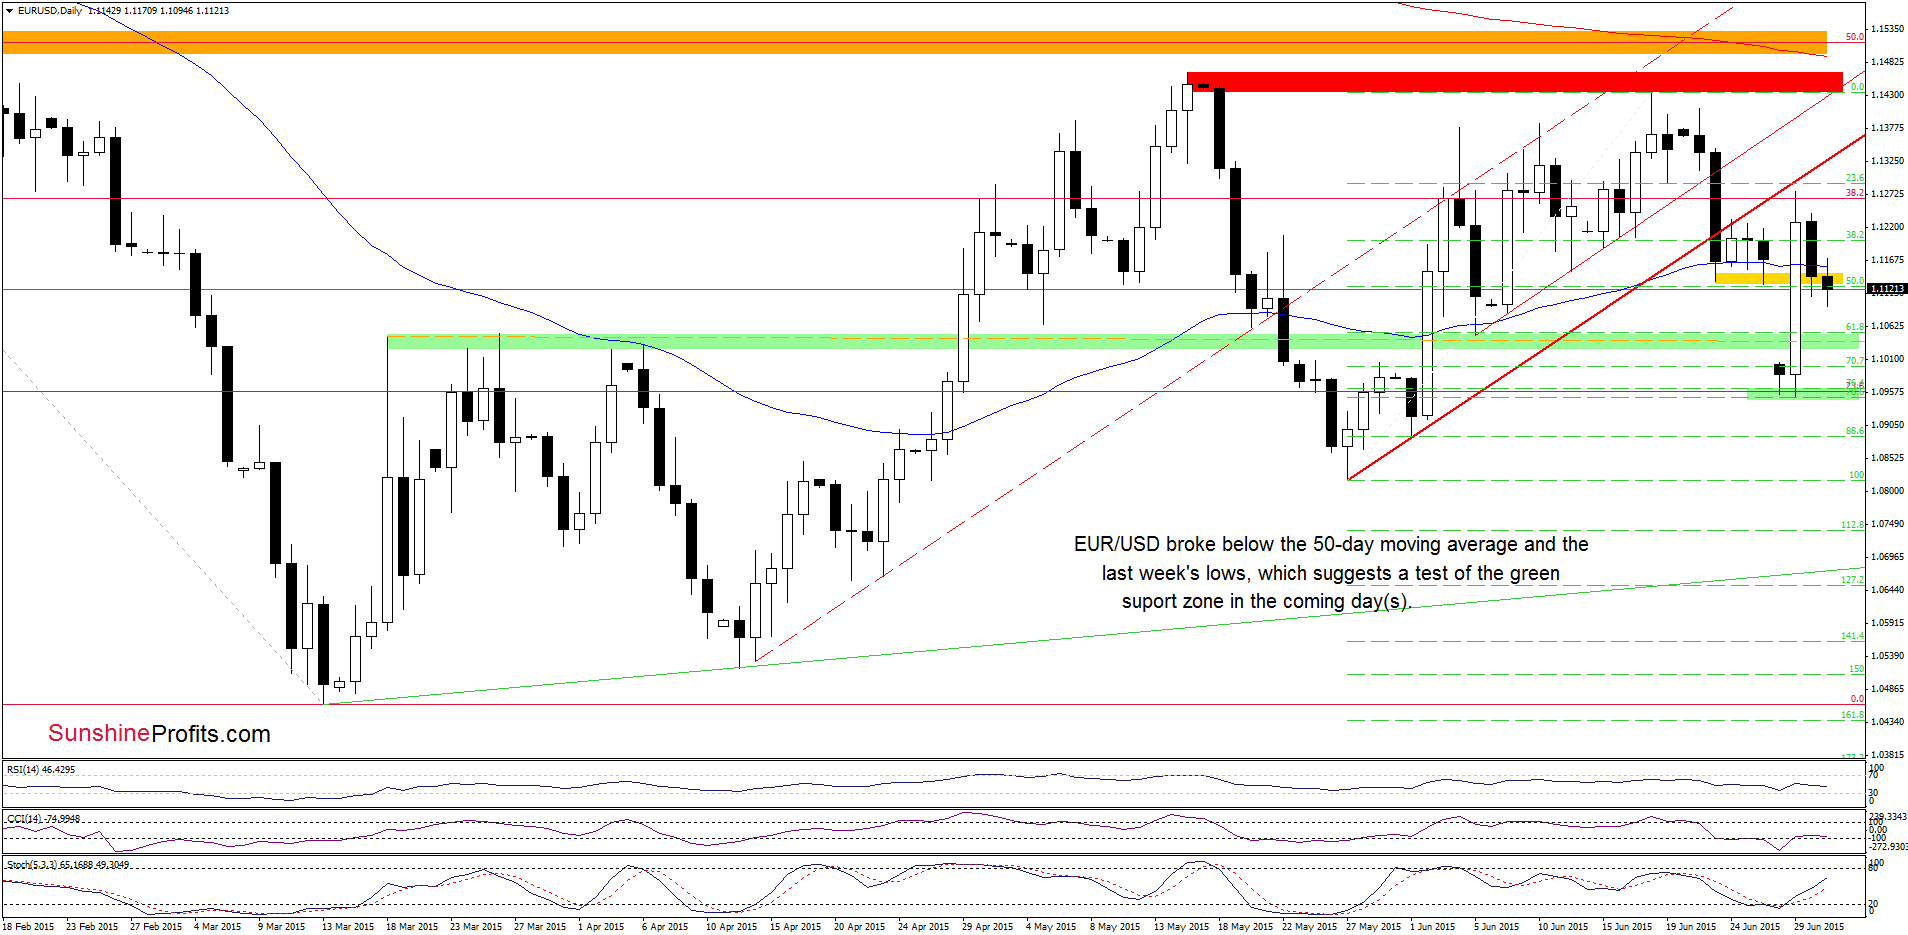
Yesterday, EUR/USD declined and closed the day under the 50-day moving average (only slightly above the last week’s lows). Although currency bulls tried to push the pair above this resistance, they failed, which resulted in a drop under the yellow support zone earlier today. This is a negative signal, which suggests further deterioration and a test of the green support zone in the coming day(s).
Very short-term outlook: mixed with bearish bias
Short-term outlook: mixed
MT outlook: mixed
LT outlook: mixed
Trading position (short-term; our opinion): No positions are justified from the risk/reward perspective at the moment. We will keep you informed should anything change, or should we see a confirmation/invalidation of the above.
USD/CAD
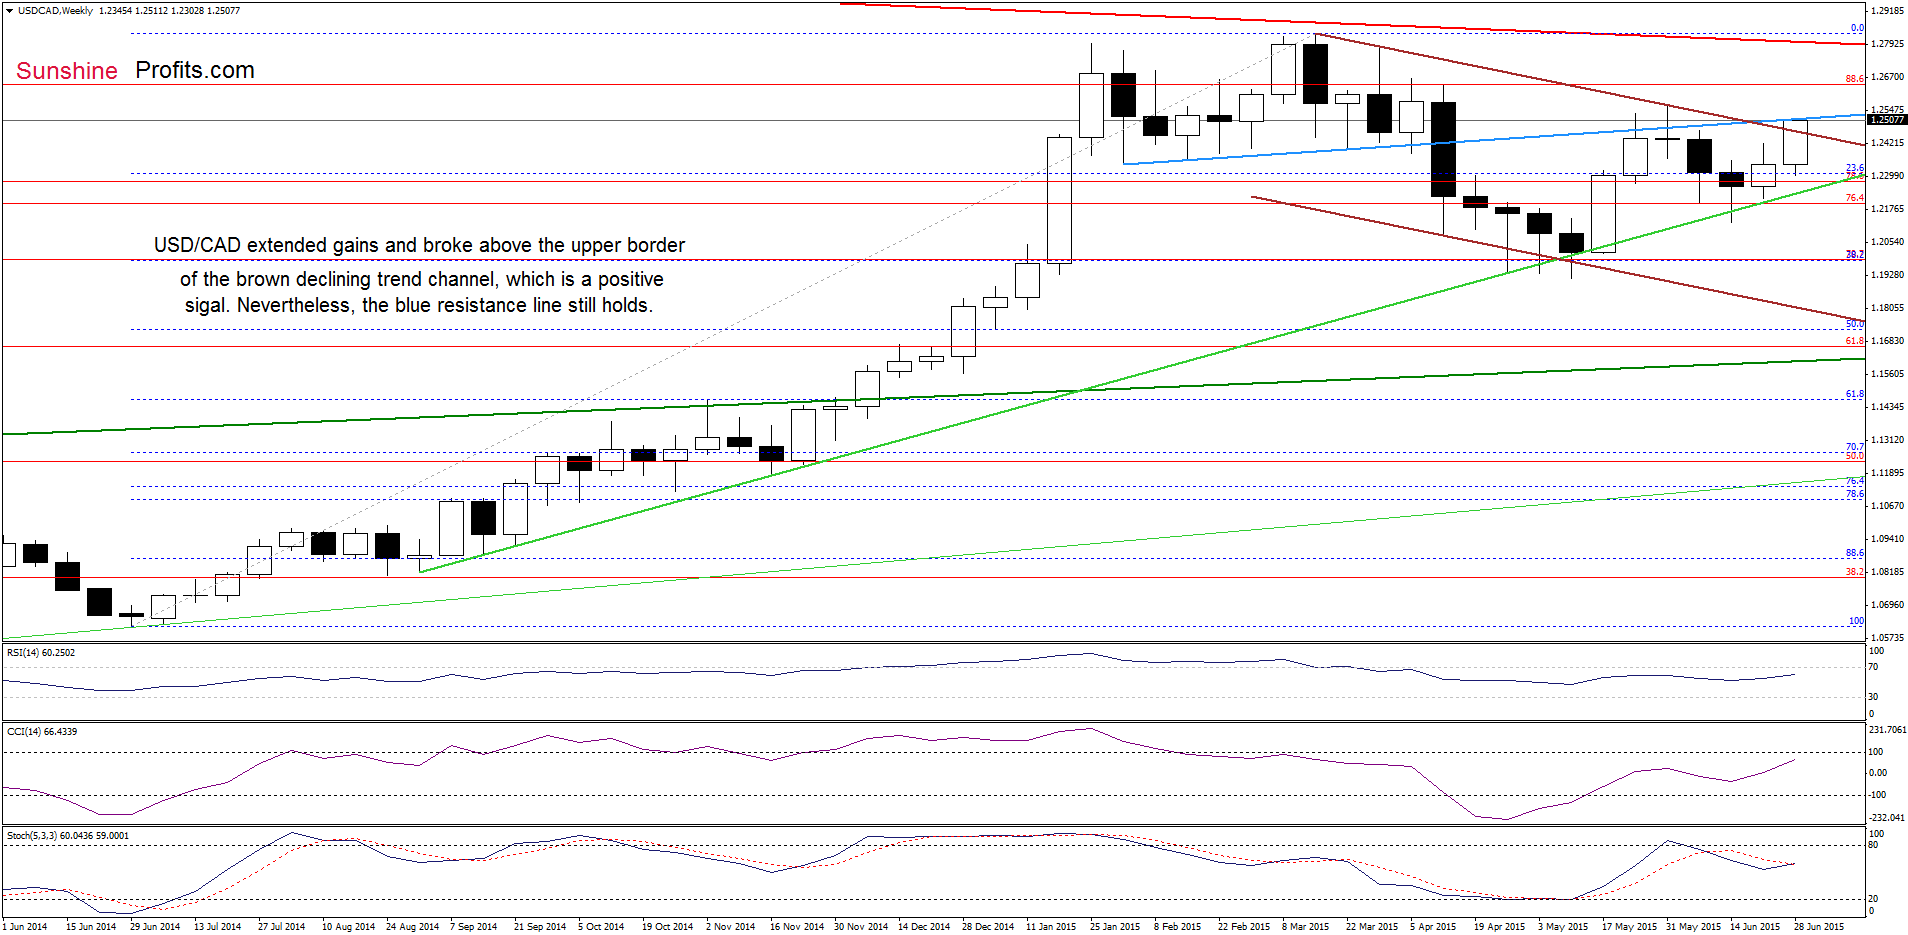
From today’s point of view we see that the situation in the medium term has improved as USD/CAD extended gains and broke above the upper border of the brown declining trend channel. Although this is a positive signal, which suggests further improvement, the blue resistance line keeps gains in check. Therefore, another upswing will be more likely if we see a breakout above it.
Will we see such price action? Let’s take a closer look at the daily chart and find out.
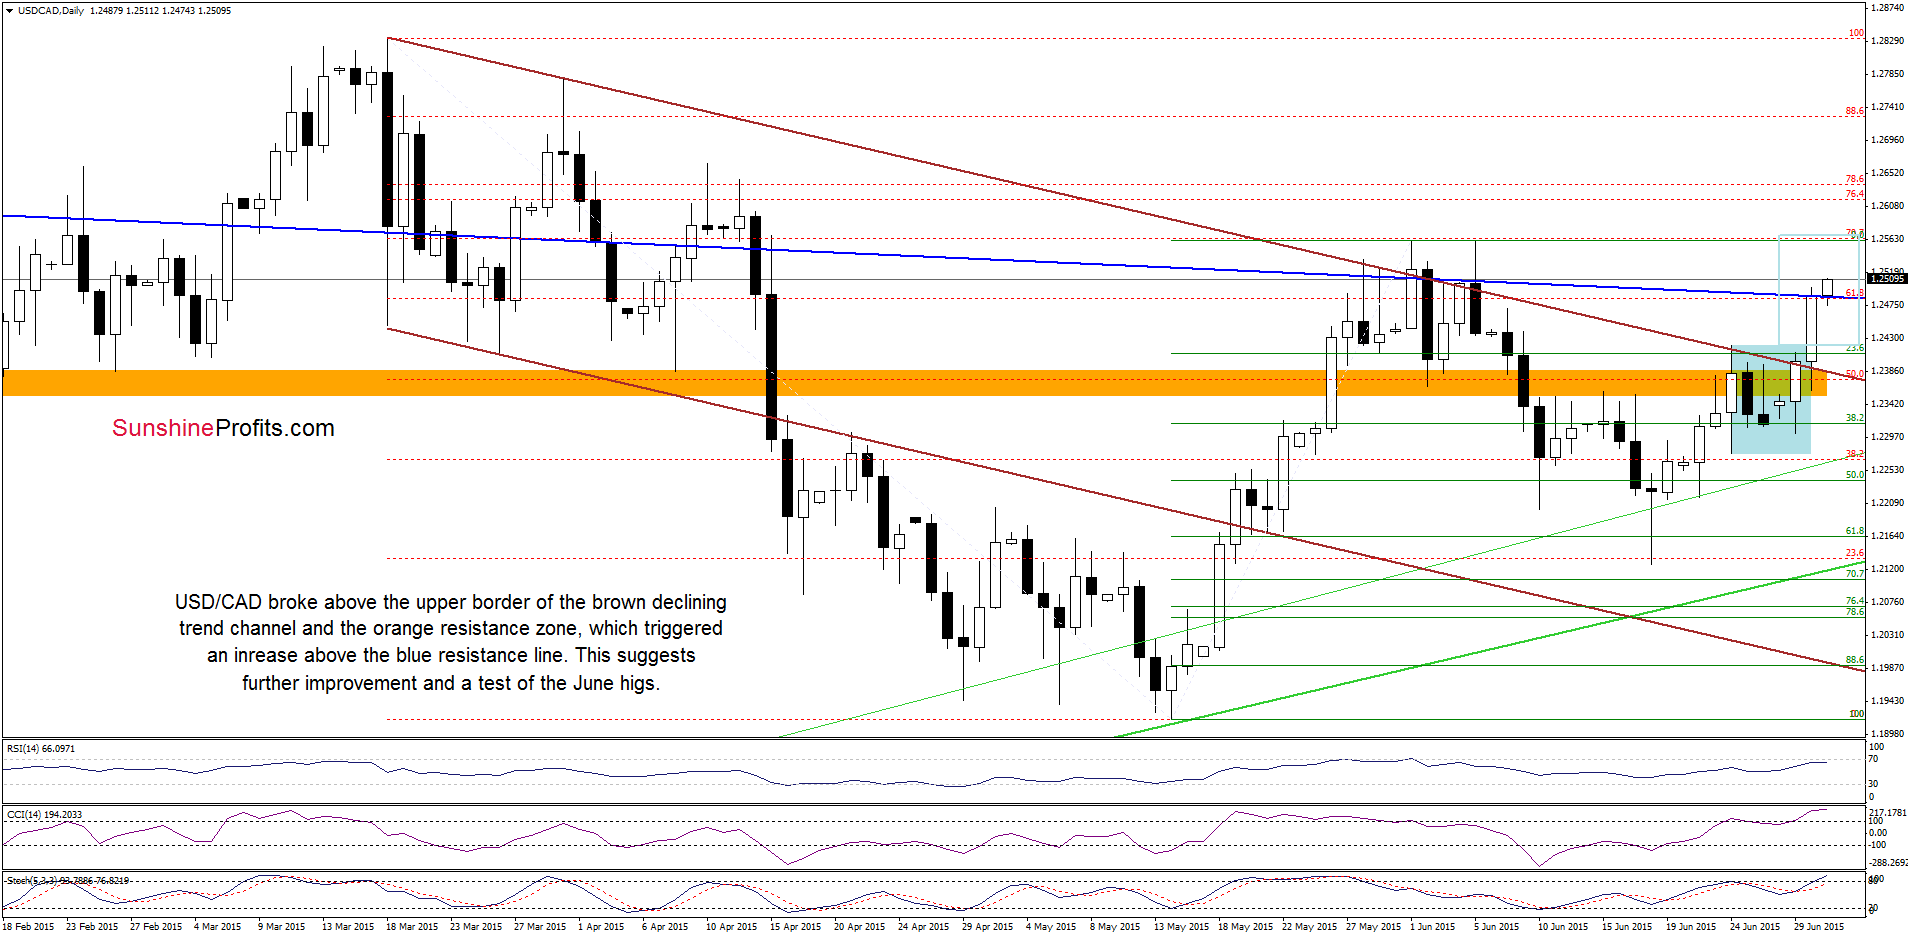
Yesterday, USD/CAD moved sharply higher and broke above the orange resistance zone and the upper border of the brown declining trend channel. This positive signal encouraged currency bulls to act, which resulted in a rally to the long-term blue resistance line. Earlier today, the exchange rate climbed above it, which suggests further improvement in the coming day(s). How high could USD/CAD go? Yesterday’s upswing took the pair above the upper line of the consolidation (marked with blue), which suggests a rally to the June highs, where the size of the upward move will correspond to the height of the formation. At this point, it is worth noting that the CCI and Stochastic Oscillator are overbought, while the RSI approached the level 70, which in combination with the above-mentioned resistance could stop further improvement and trigger a correction later this week.
Very short-term outlook: mixed with bullish bias
Short-term outlook: mixed
MT outlook: mixed
LT outlook: mixed
Trading position (short-term; our opinion): No positions are justified from the risk/reward perspective at the moment. We will keep you informed should anything change, or should we see a confirmation/invalidation of the above.
USD/CHF
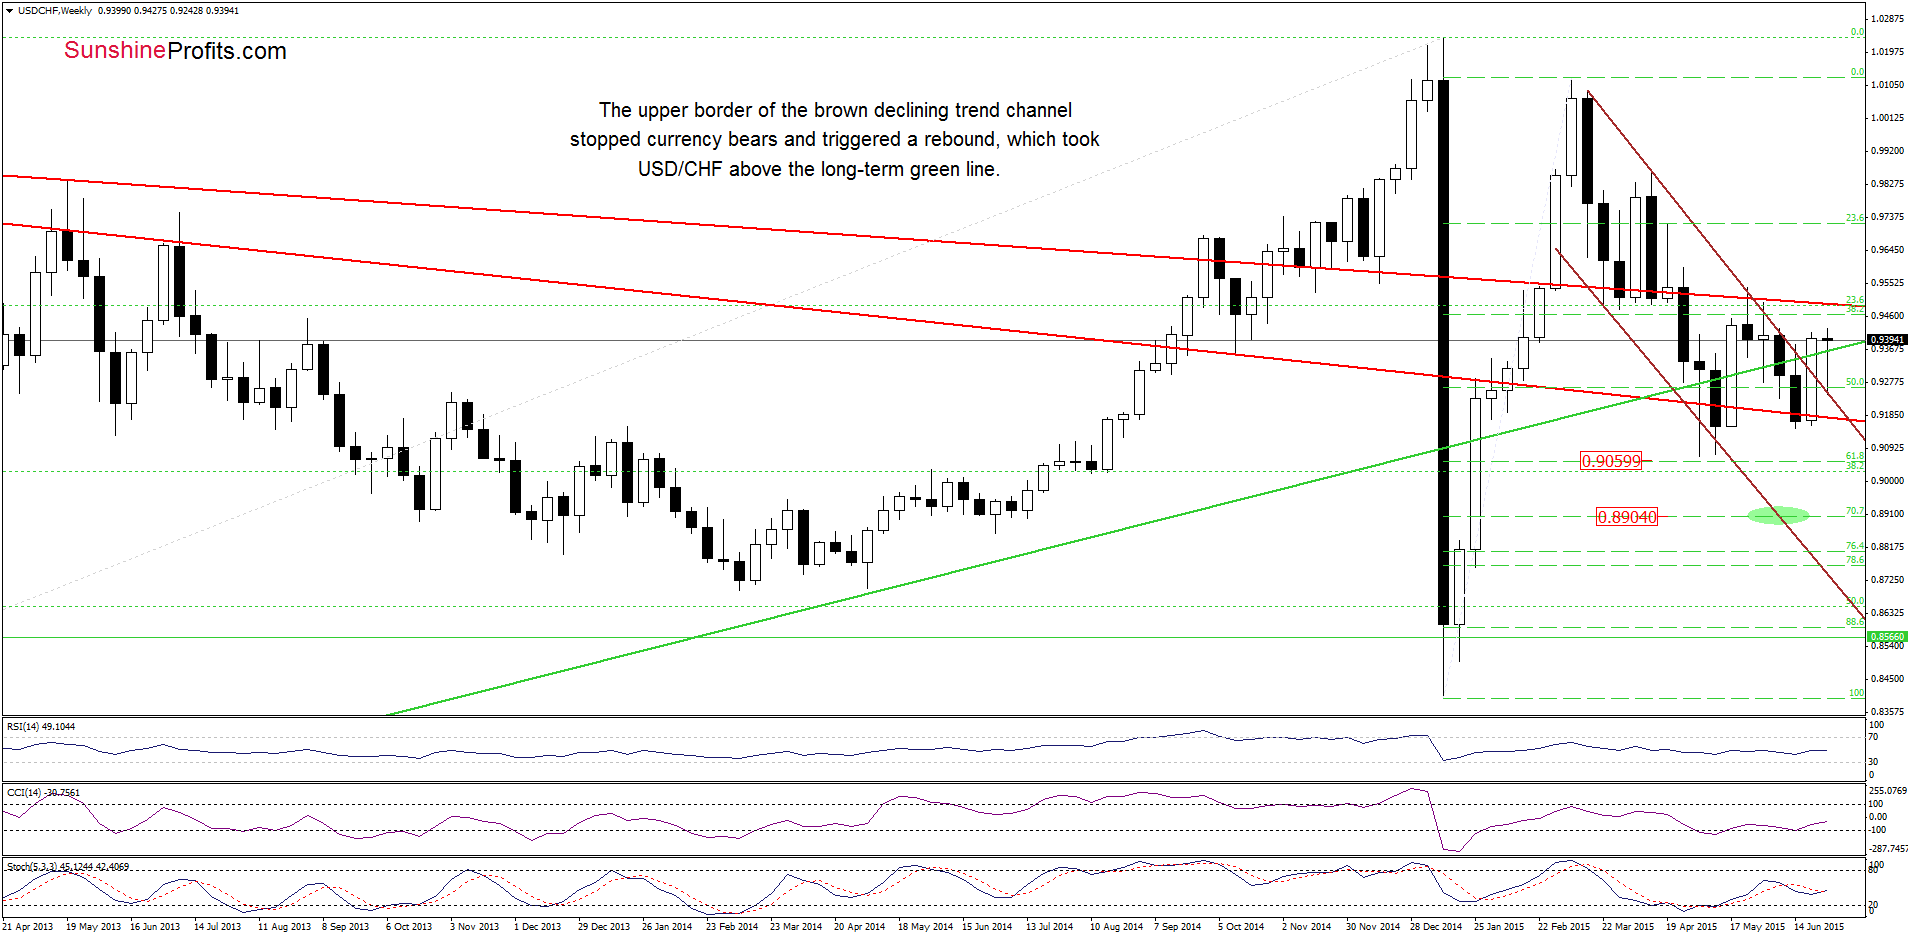
As you see on the weekly chart, the upper border of the brown declining trend channel stopped currency bears and triggered a sharp rebound, which took USD/CHF above the previously-broken long-term green line. In this way, the exchange rate invalidated earlier breakout, which is a positive signal that suggests further improvement and an increase to the long-term red resistance line.
How did this rebound affect the very short-term picture? Let’s check.
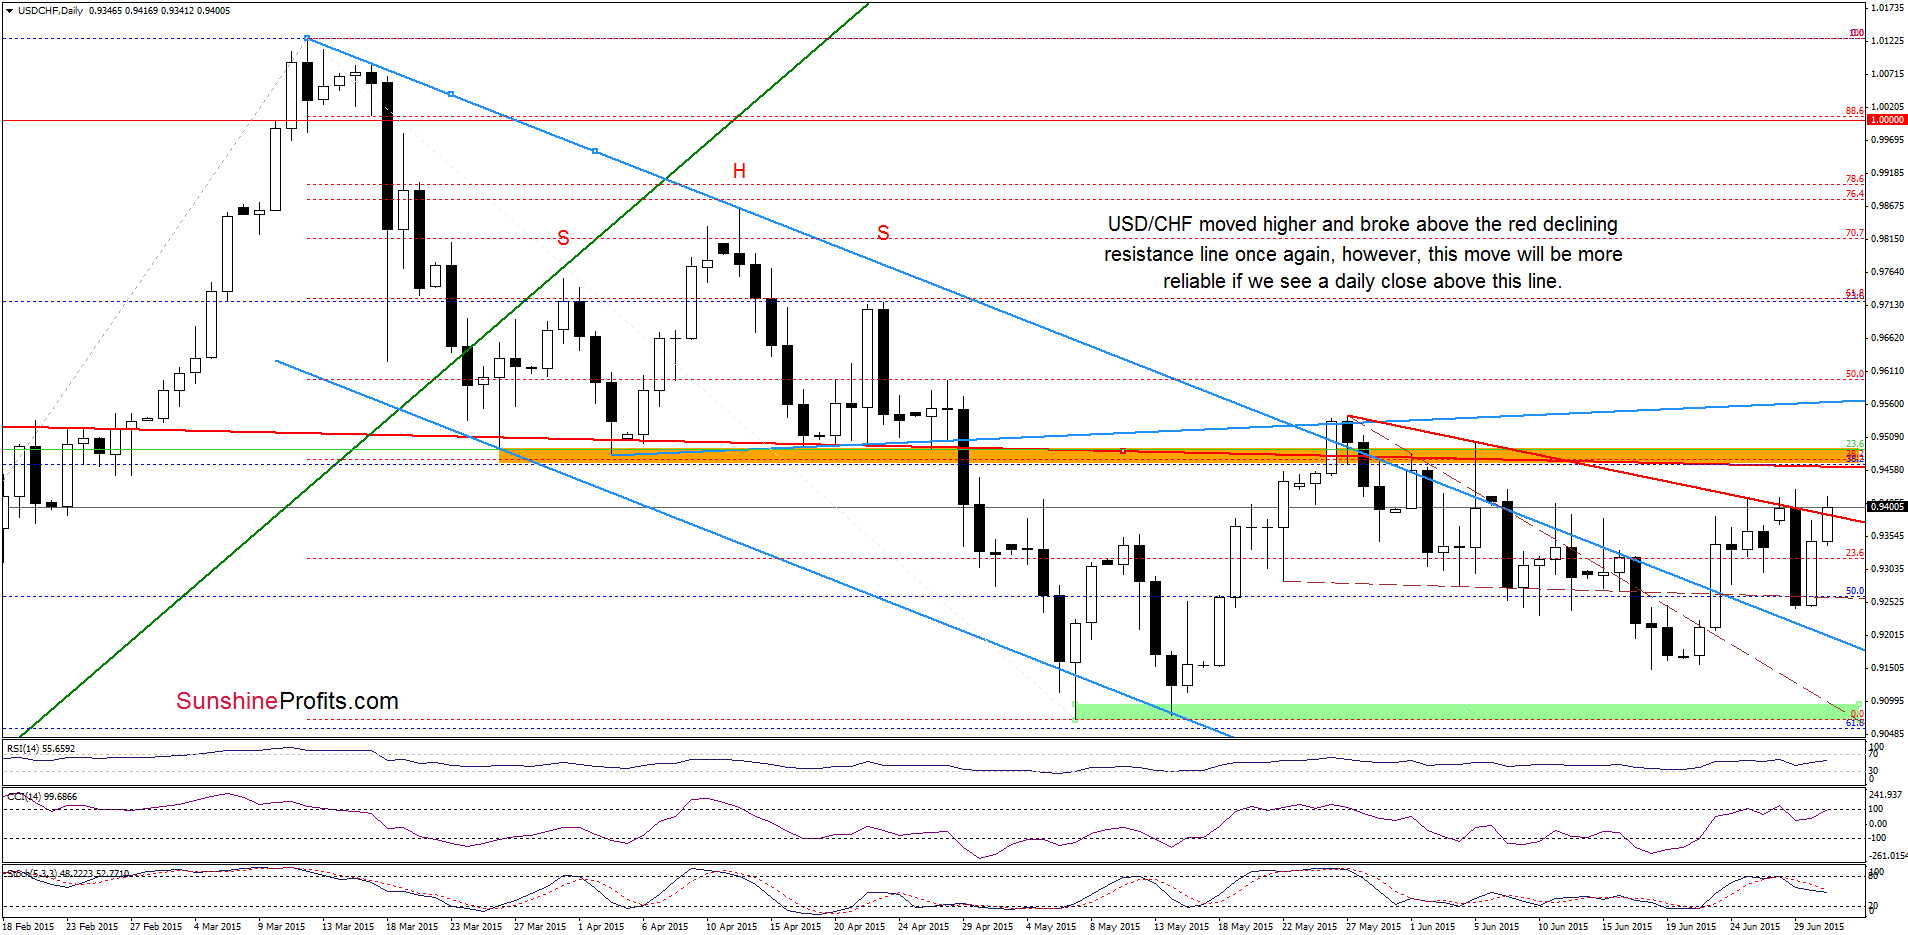
From today’s point of view we see that USD/CHF reversed and increased yesterday. Earlier today, the pair extended gains and broke above the key resistance – the red declining line based on the May 27 and June5 highs. This is a positive signal, which suggests higher values of the exchange rate in the coming days. Nevertheless, we should keep in mind that we saw similar price action on Monday. Back then, such improvement was only temporary and the pair reversed, erasing over 60% f earlier upward move. Therefore, we think that today’s move will be more reliable if we see a daily close above the red line. If currency bulls succeed, the initial upside target would be the orange resistance zone (around 0.9460-09500).
Very short-term outlook: mixed with bullish bias
Short-term outlook: mixed
MT outlook: mixed
LT outlook: mixed
Trading position (short-term; our opinion): No positions are justified from the risk/reward perspective at the moment. We will keep you informed should anything change, or should we see a confirmation/invalidation of the above.
Thank you.
Nadia Simmons
Forex & Oil Trading Strategist
Przemyslaw Radomski, CFA
Founder, Editor-in-chief
Gold & Silver Trading Alerts
Forex Trading Alerts
Oil Investment Updates
Oil Trading Alerts

