

Yesterday’s talks between Greece and its international creditors ended without an agreement, which fuelled worries over Greece’s future in the euro zone. As a result, demand for the U.S. dollar increased, pushing the GBP/USD lower to the previously-broken medium-term support/resistance line. What’s next?
In our opinion the following forex trading positions are justified - summary:
- EUR/USD: Short positions (stop-loss order at 1.1667)
- GBP/USD: Short positions (stop-loss order at 1.5913)
- USD/JPY: none
- USD/CAD: Long positions (stop-loss order at 1.1706)
- USD/CHF: none
- AUD/USD: Short positions (stop-loss order at 0.8194)
EUR/USD
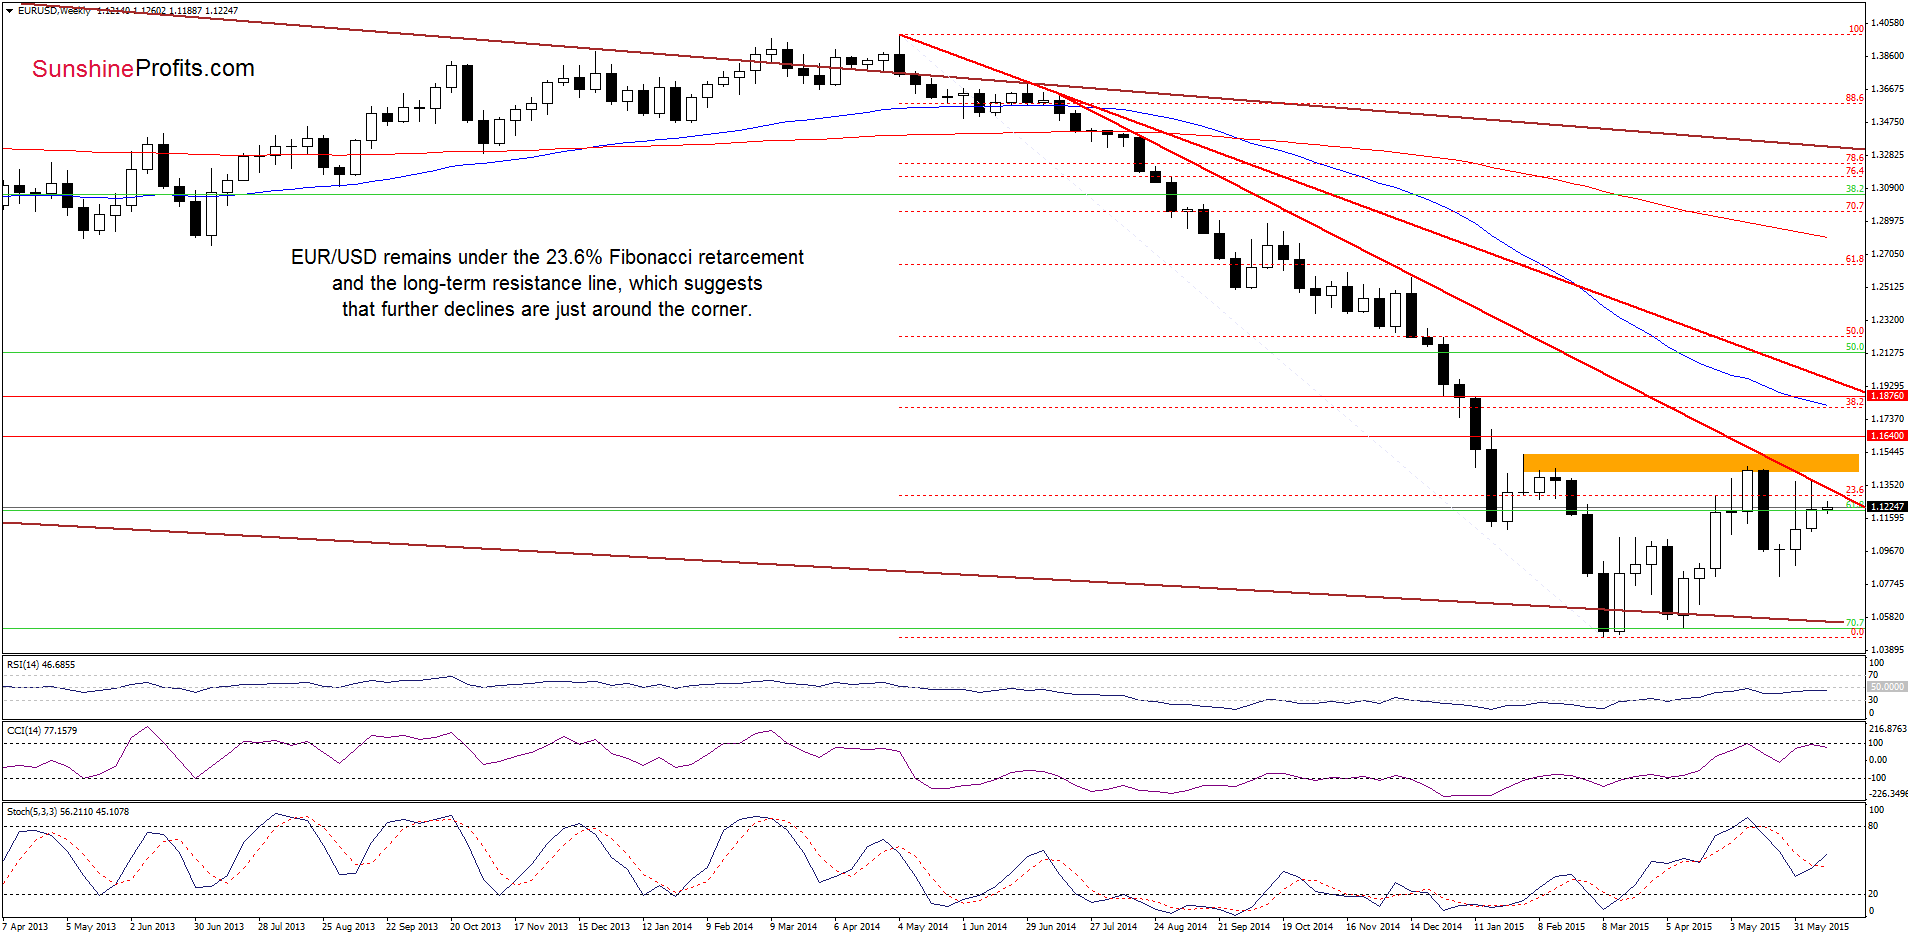
Looking at the weekly chart we see that EUR/USD is trading below the long-term red declining line and the 23.6% Fibonacci retracement, which is a negative signal that suggests further declines.
Are there any short-term factors that could encourage currency bears to act? Let’s examine the daily chart and find out.
On Friday, we wrote the following:
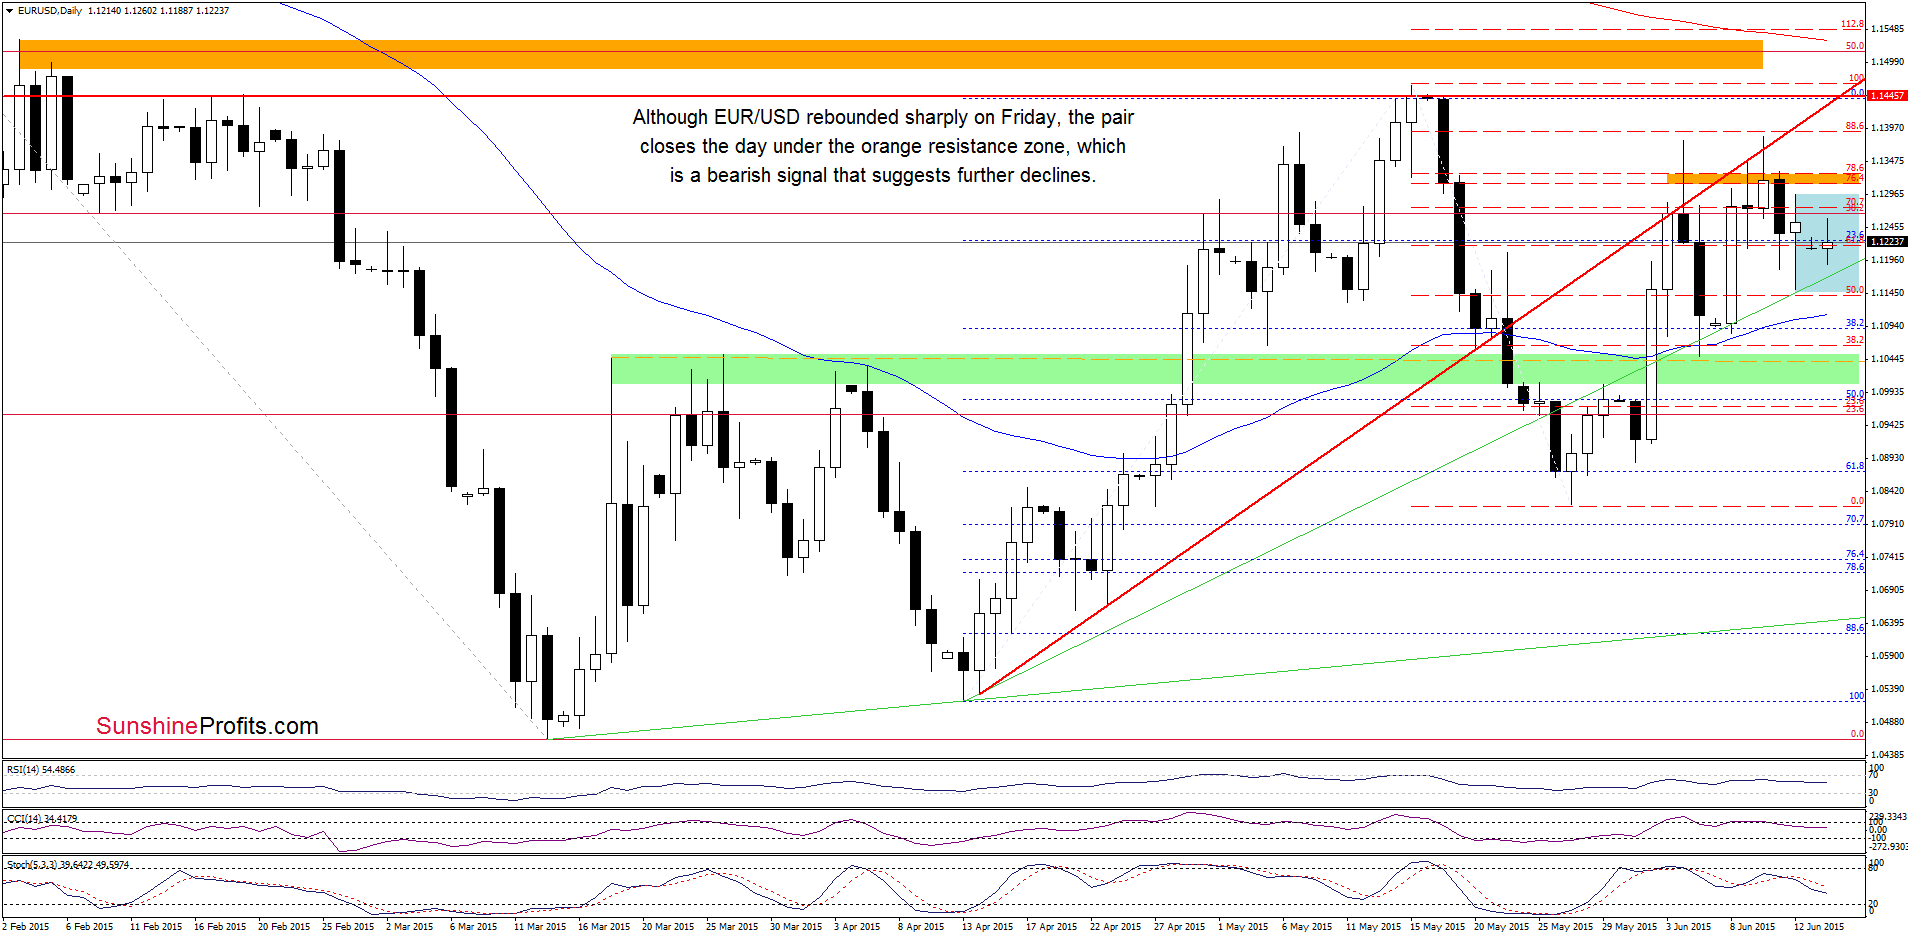
(…) If (…) pair drops from here, the initial downside target would be around 1.1144, where the green rising support line currently is.
On the above chart, we see that the proximity to the green support line triggered a sharp rebound on Friday. Despite this upswing, the exchange rate closed the day under the orange resistance zone, which suggests another pullback and a re-test of the major support line. At this point, it is worth noting that EUR/USD is trading in a consolidation (marked with blue), therefore, a breakdown under the green line will trigger a drop to the lower line of the formation. If it is broken, we’ll see a test of the 50-day moving average or even the green support zone in the coming days. Finishing today’s commentary on this currency pair, please note that the CCI and Stochastic Oscillator generated sell signals, supporting the bearish case.
Very short-term outlook: bearish
Short-term outlook: mixed with bearish bias
MT outlook: mixed
LT outlook: mixed
Trading position (short-term; our opinion): Short positions (which are profitable) with a stop-loss order at 1.1667 are justified from the risk/reward perspective at the moment. We will keep you informed should anything change, or should we see a confirmation/invalidation of the above.
GBP/USD
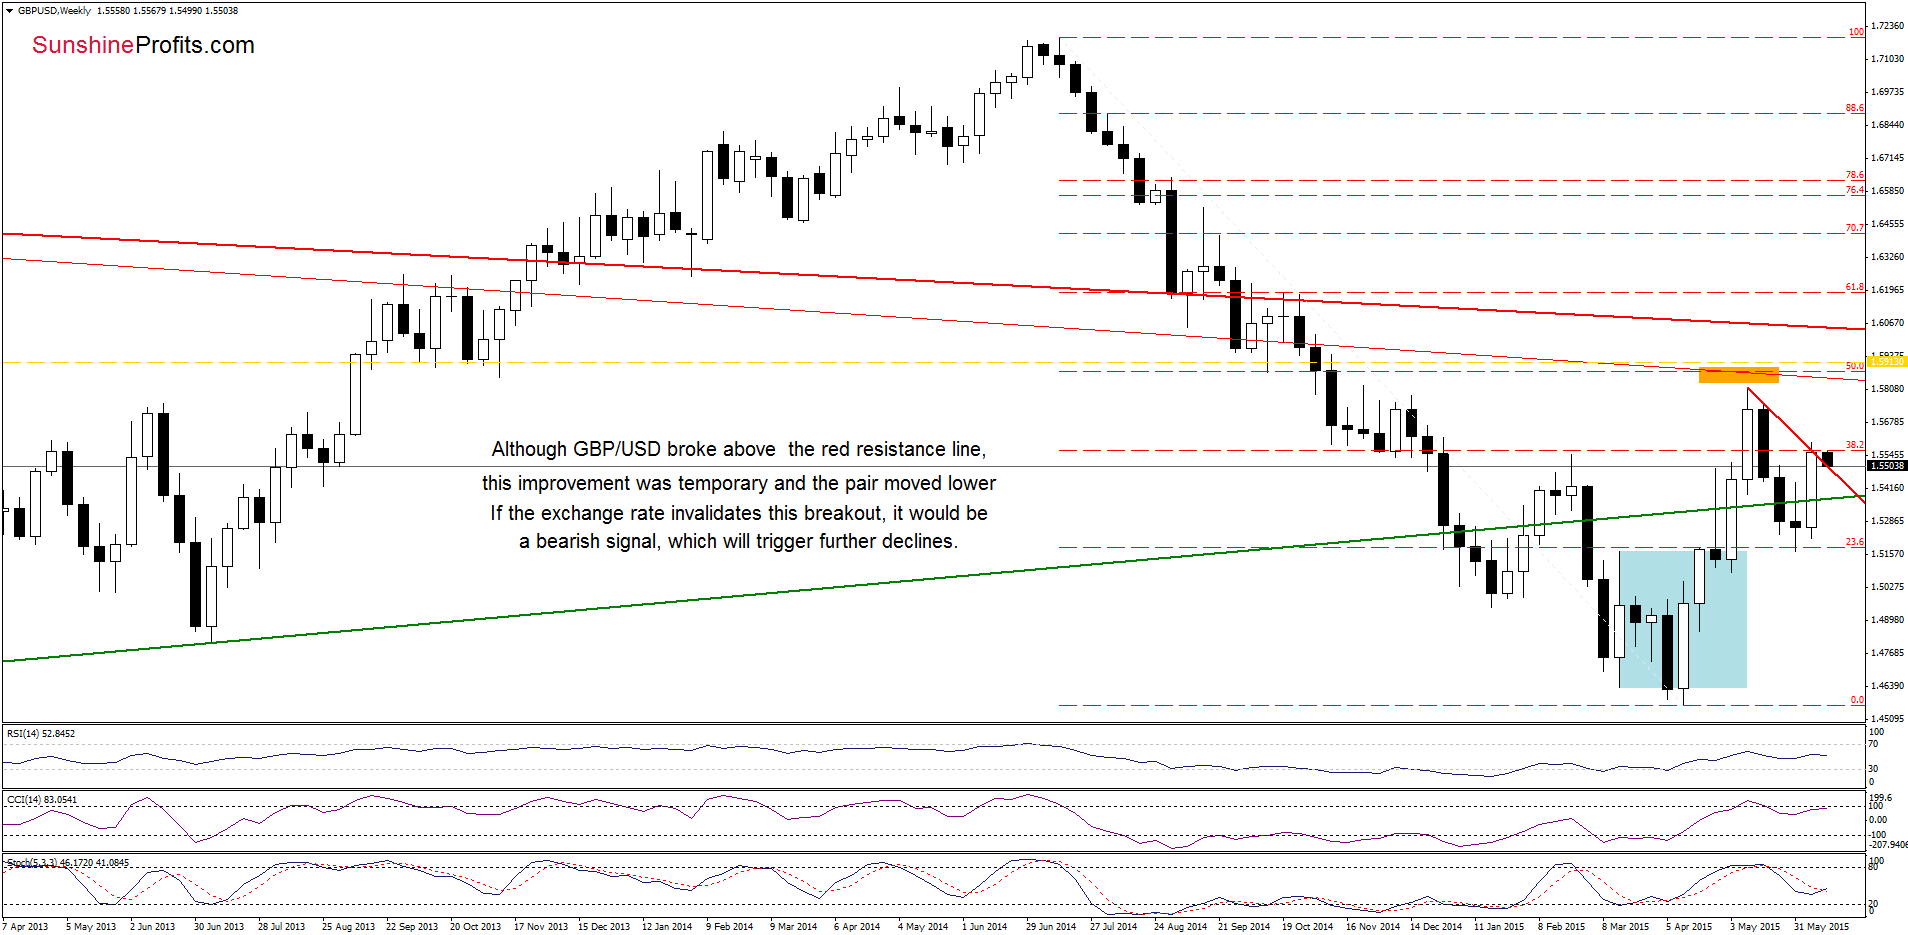
As you see on the weekly chart, although GBP/USD broke above the red resistance line based on the previous highs, this improvement was temporary and the pair moved lower earlier today. If the exchange rate invalidates this breakout, it would be a bearish signal, which will trigger further declines.
What impact did this move have on the very short-term chart? Let’s check.
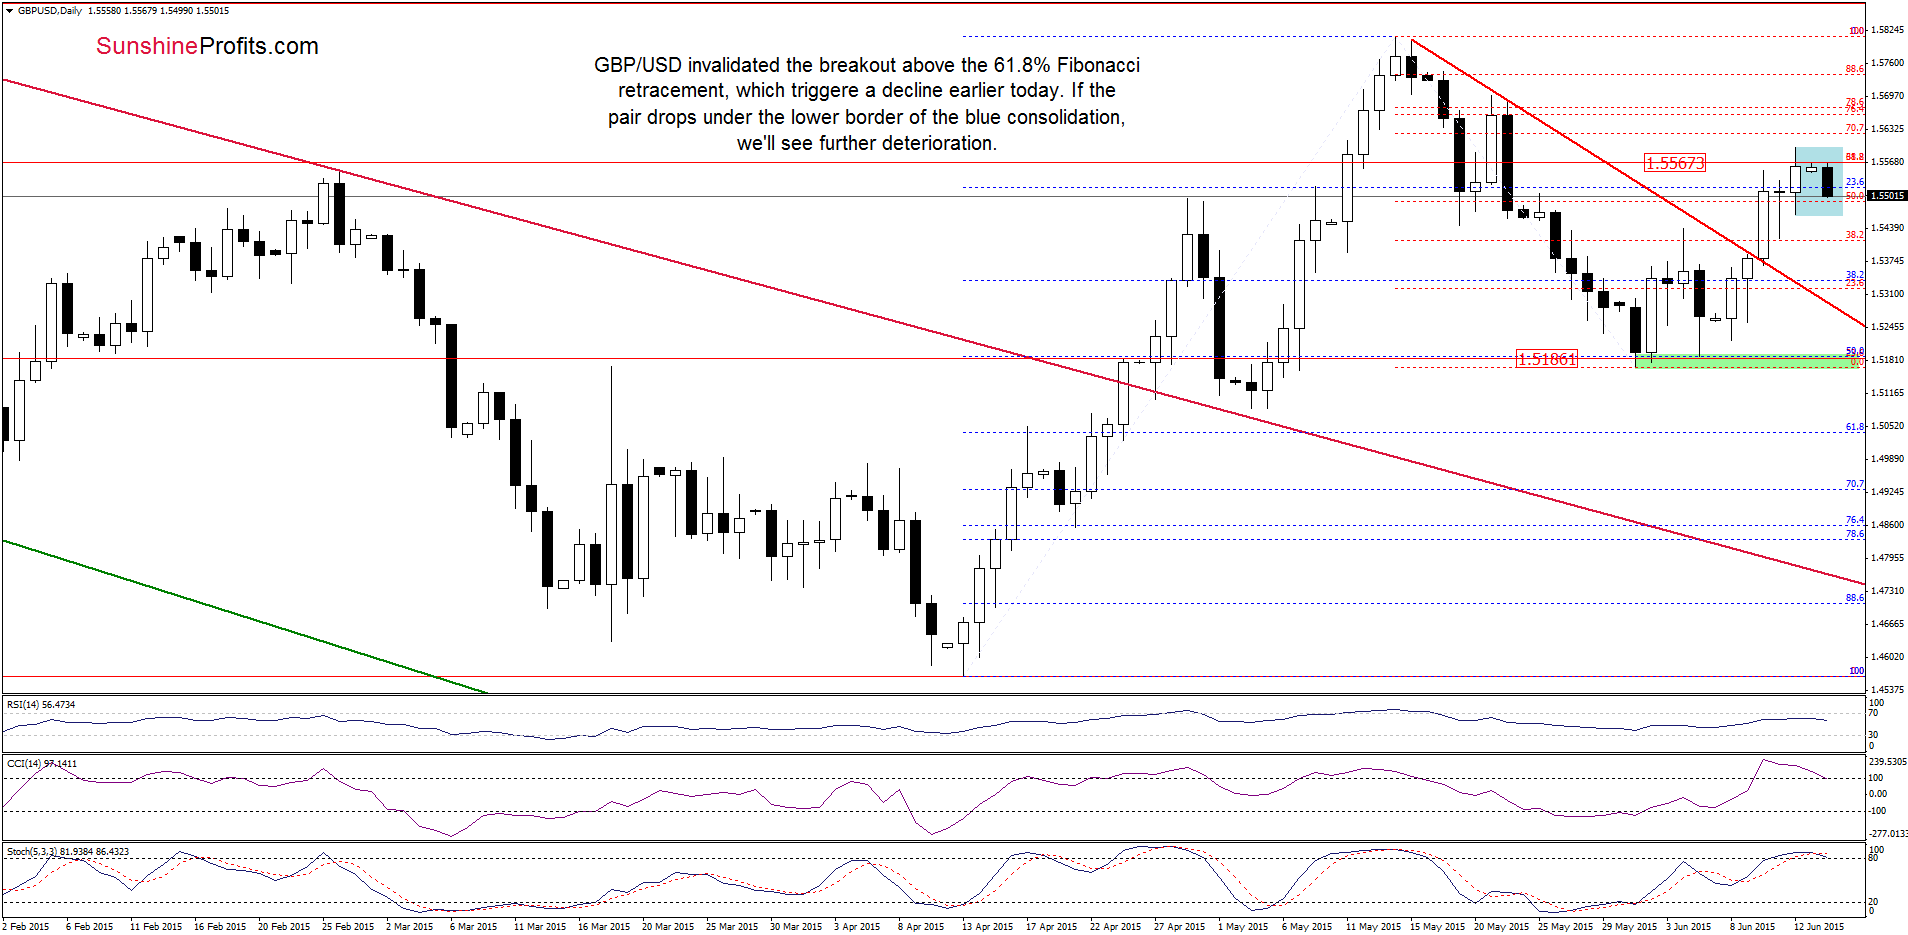
From this perspective, we see that GBP/USD moved lower earlier today, invalidating small breakout above the 61.8% Fibonacci retracement. This is a negative signal, which suggests further drops. If this is the case, the initial downside target would be around 1.5465, where the lower border of the blue consolidation is. If this support line is broken, we’ll see a decline to around 1.5330, where the size of the downswing will correspond to the height of the formation.
Very short-term outlook: bearish
Short-term outlook: mixed with bearish bias
MT outlook: mixed
LT outlook: mixed
Trading position (short-term; our opinion): Short positions (which are profitable) with a stop-loss order at 1.5913 are justified from the risk/reward perspective at the moment. We will keep you informed should anything change, or should we see a confirmation/invalidation of the above.
AUD/USD
The situation in the medium term hasn’t changed much as AUD/USD is trading under the last week’s high, but still above the green support line (based on the previous lows).
Can we infer something more from the very short-term picture? Let’s check.
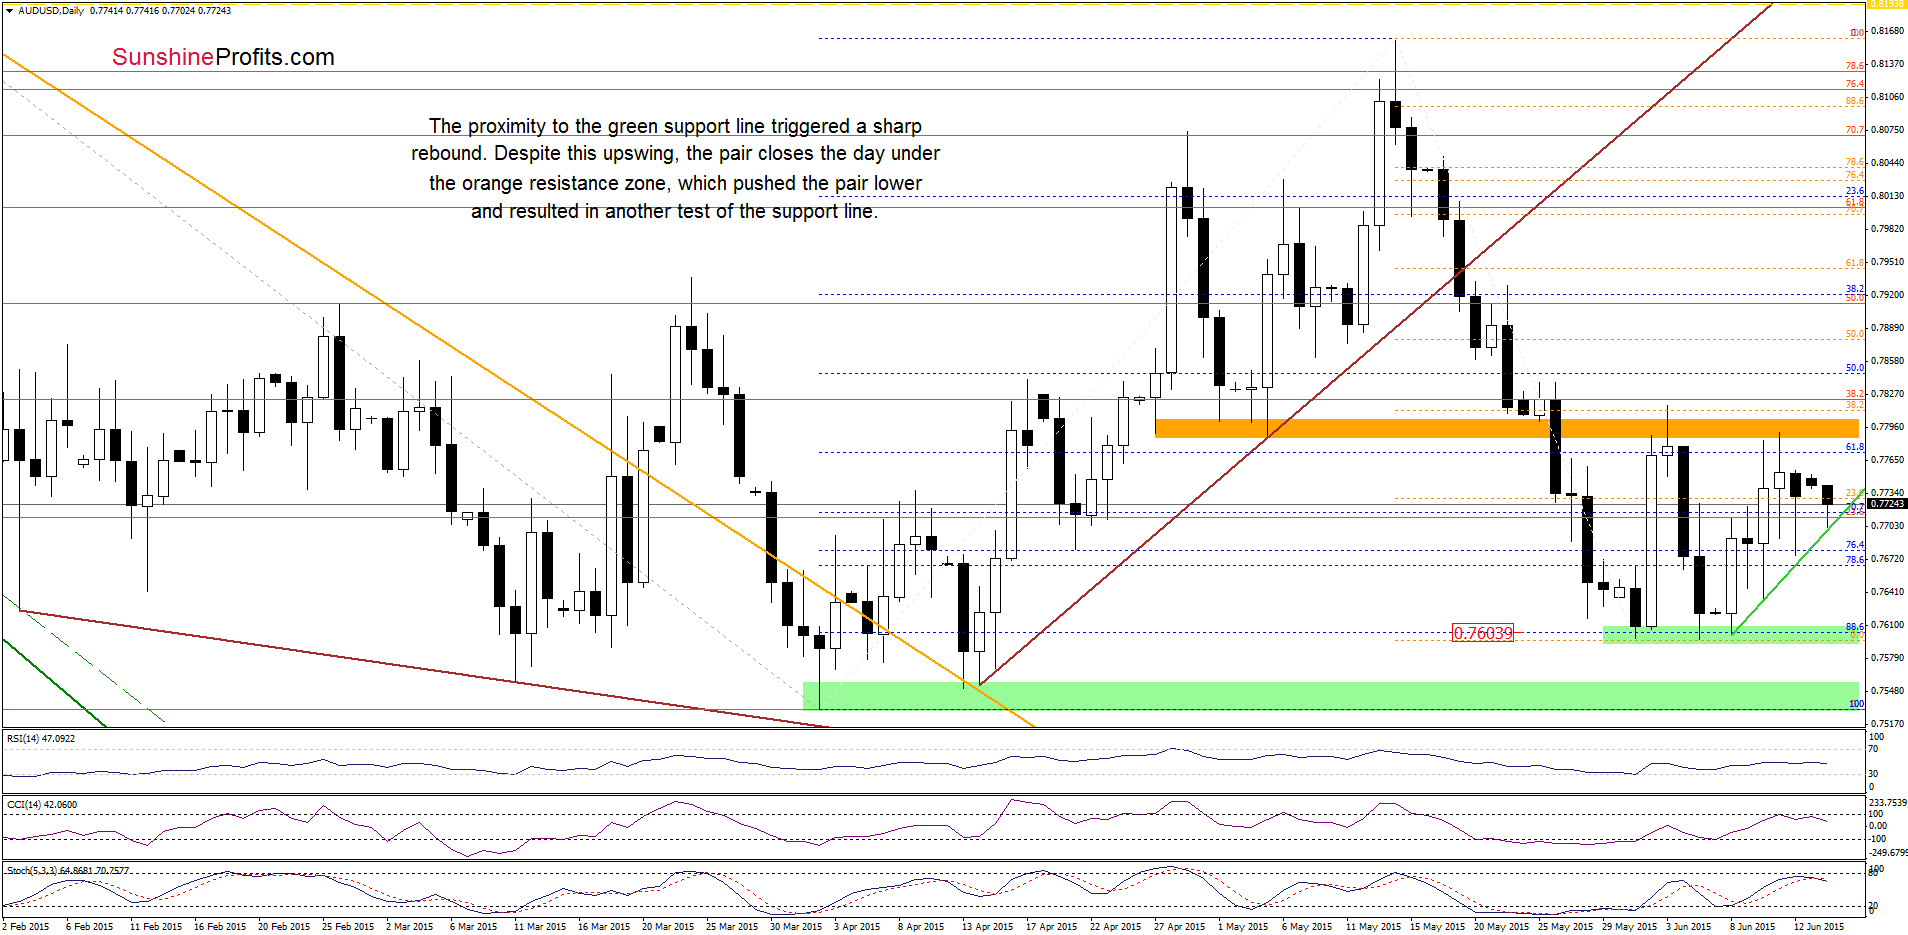
Quoting our Friday’s alert:
(…) the exchange rate moved sharply lower, which suggests a test of the green support line (based on the recent lows)
On the above chart, we see that the proximity to the green support line triggered a sharp rebound on Friday. Despite this upswing, the exchange rate closed the day under the orange resistance zone, which pushed AUD/USD lower and resulted in re-test of the green line earlier today. If it withstands the selling pressure, we’ll see a rebound from here and another increase to the key resistance area. However, taking into account the current position of the indicators (the CCI and Stochastic Oscillator generated sell signals), we think that lower values of the exchange rate are ahead us. If this is the case, and the pair drops under the support line, it would be a bearish signal, which will trigger a decline to around 0.7676, where the Friday’s low is.
Very short-term outlook: bearish
Short-term outlook: mixed with bearish bias
MT outlook: mixed
LT outlook: mixed
Trading position (short-term; our opinion): Short positions (which are profitable) with a stop-loss order at 0.8194 are justified from the risk/reward perspective at the moment. We will keep you informed should anything change, or should we see a confirmation/invalidation of the above.
Thank you.
Nadia Simmons
Forex & Oil Trading Strategist
Przemyslaw Radomski, CFA
Founder, Editor-in-chief
Gold & Silver Trading Alerts
Forex Trading Alerts
Oil Investment Updates
Oil Trading Alerts

