

Earlier today, the U.K. Office for National Statistics reported that the unemployment rate slipped to 5.5%, hitting the lowest level since September 2008. Additionally, U.K. average earnings (without bonuses) increased by 2.2%, beating expectations for a 2.1% increase. Thanks to these solid numbers, GBP/USD extended gains and hit a fresh 2015 high. How high could the exchange rate go in the coming days?
In our opinion the following forex trading positions are justified - summary:
EUR/USD
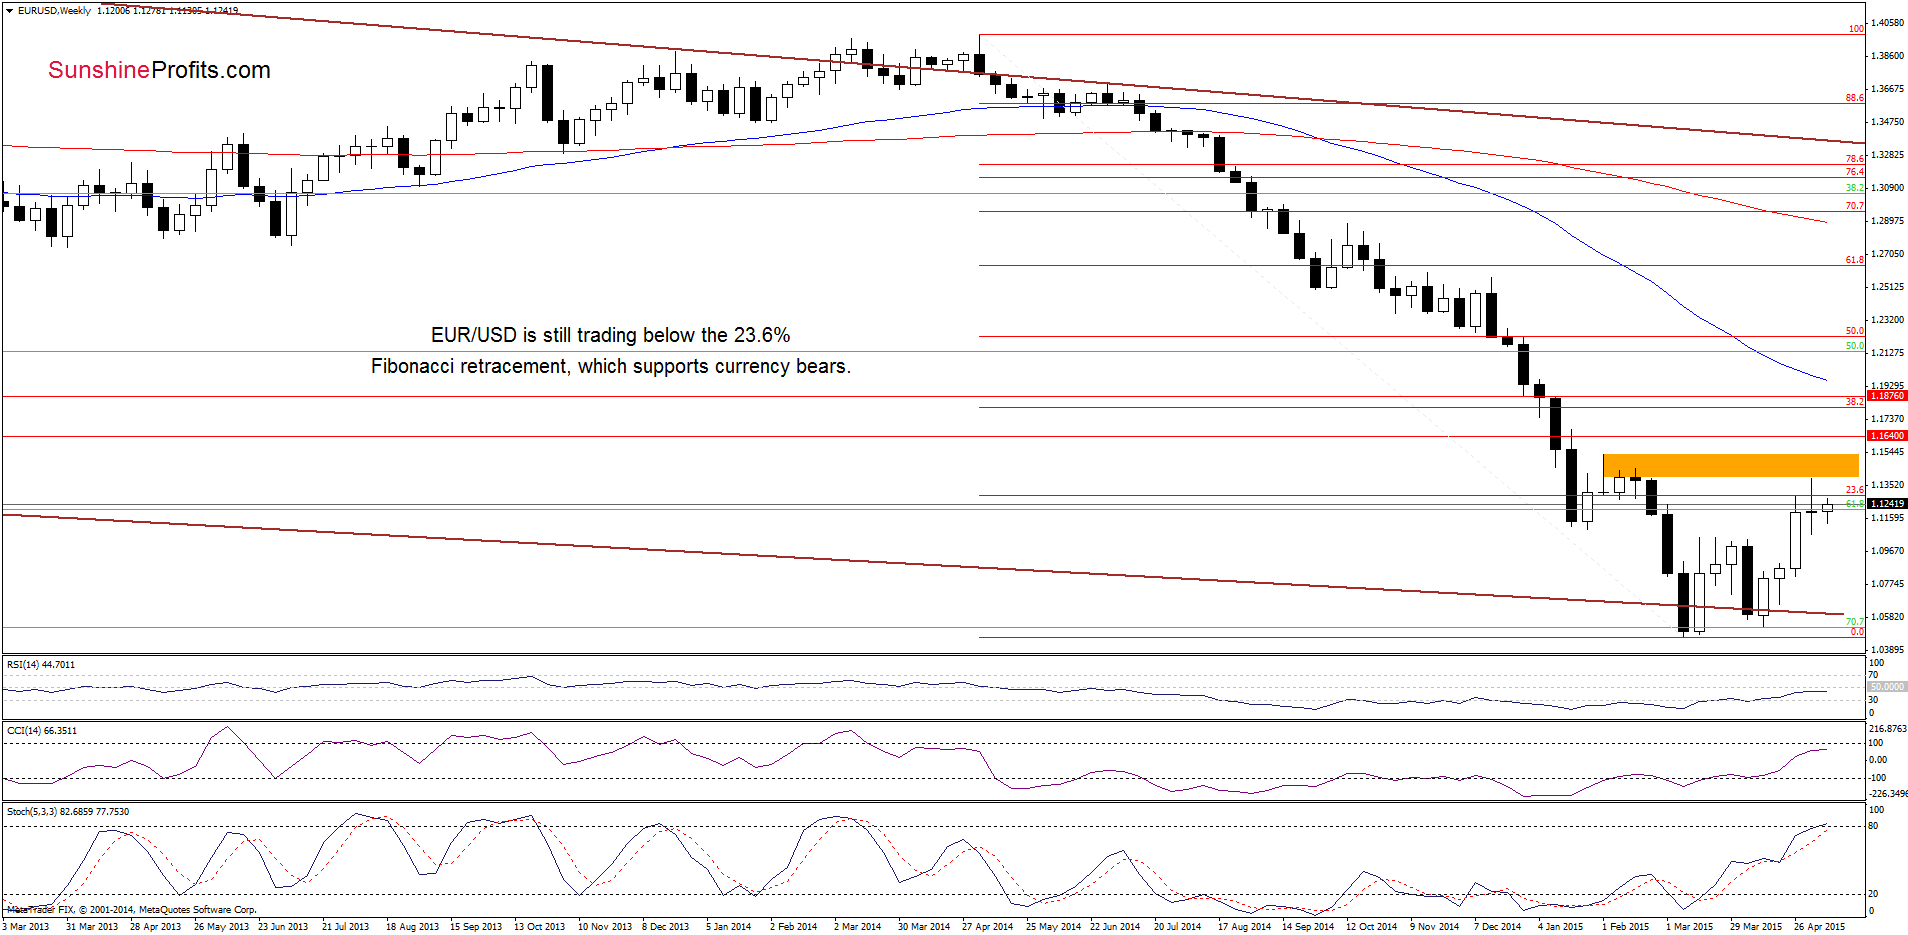
The situation in the medium-term perspective hasn’t changed much as EUR/USD is still trading under the previously-broken 23.6% Fibonacci retracement.
Having said that, let’s focus on the very short-term changes.
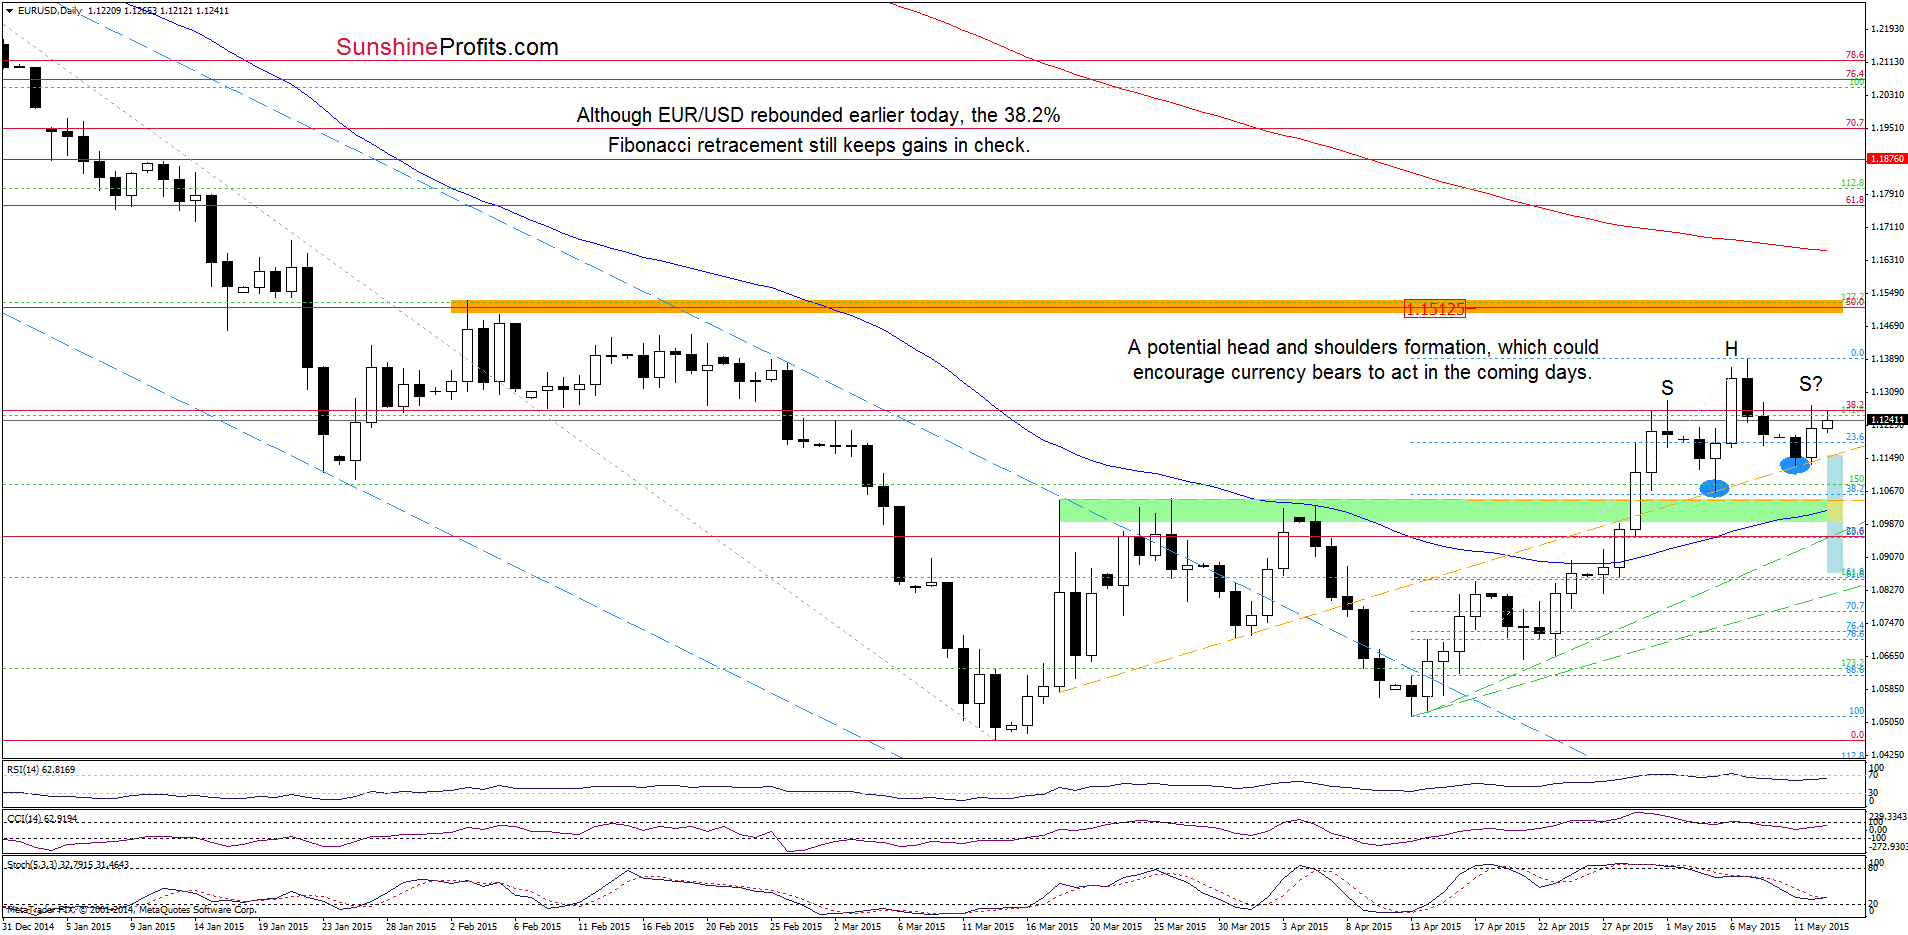
As you see n the daily chart, EUR/USD rebounded slightly earlier today, but despite this small improvement, the exchange rate sill remains under the 38.2% Fibonacci retracement. Additionally, there was no breakout above yesterday’s high (not to mention the May’s high), which means that what we wrote in our previous alert is up-to-date also today:
(…) we think that as long as there is no breakout above the recent high, a potential head and shoulders formation might be in play. As you see on the daily chart, if the exchange rate drops under the orange support line (which could be a neck line of the formation), we might see a bigger correction of the recent rally and a drop to at least the green support zone (around 1.1000-1.1050) supported by the 38.2% retracement (based on the recent upward move).
Very short-term outlook: mixed with bearish bias
Short-term outlook: mixed
MT outlook: mixed
LT outlook: mixed
Trading position (short-term; our opinion): No positions are justified from the risk/reward perspective at the moment. We will keep you informed should anything change, or should we see a confirmation/invalidation of the above.
GBP/USD
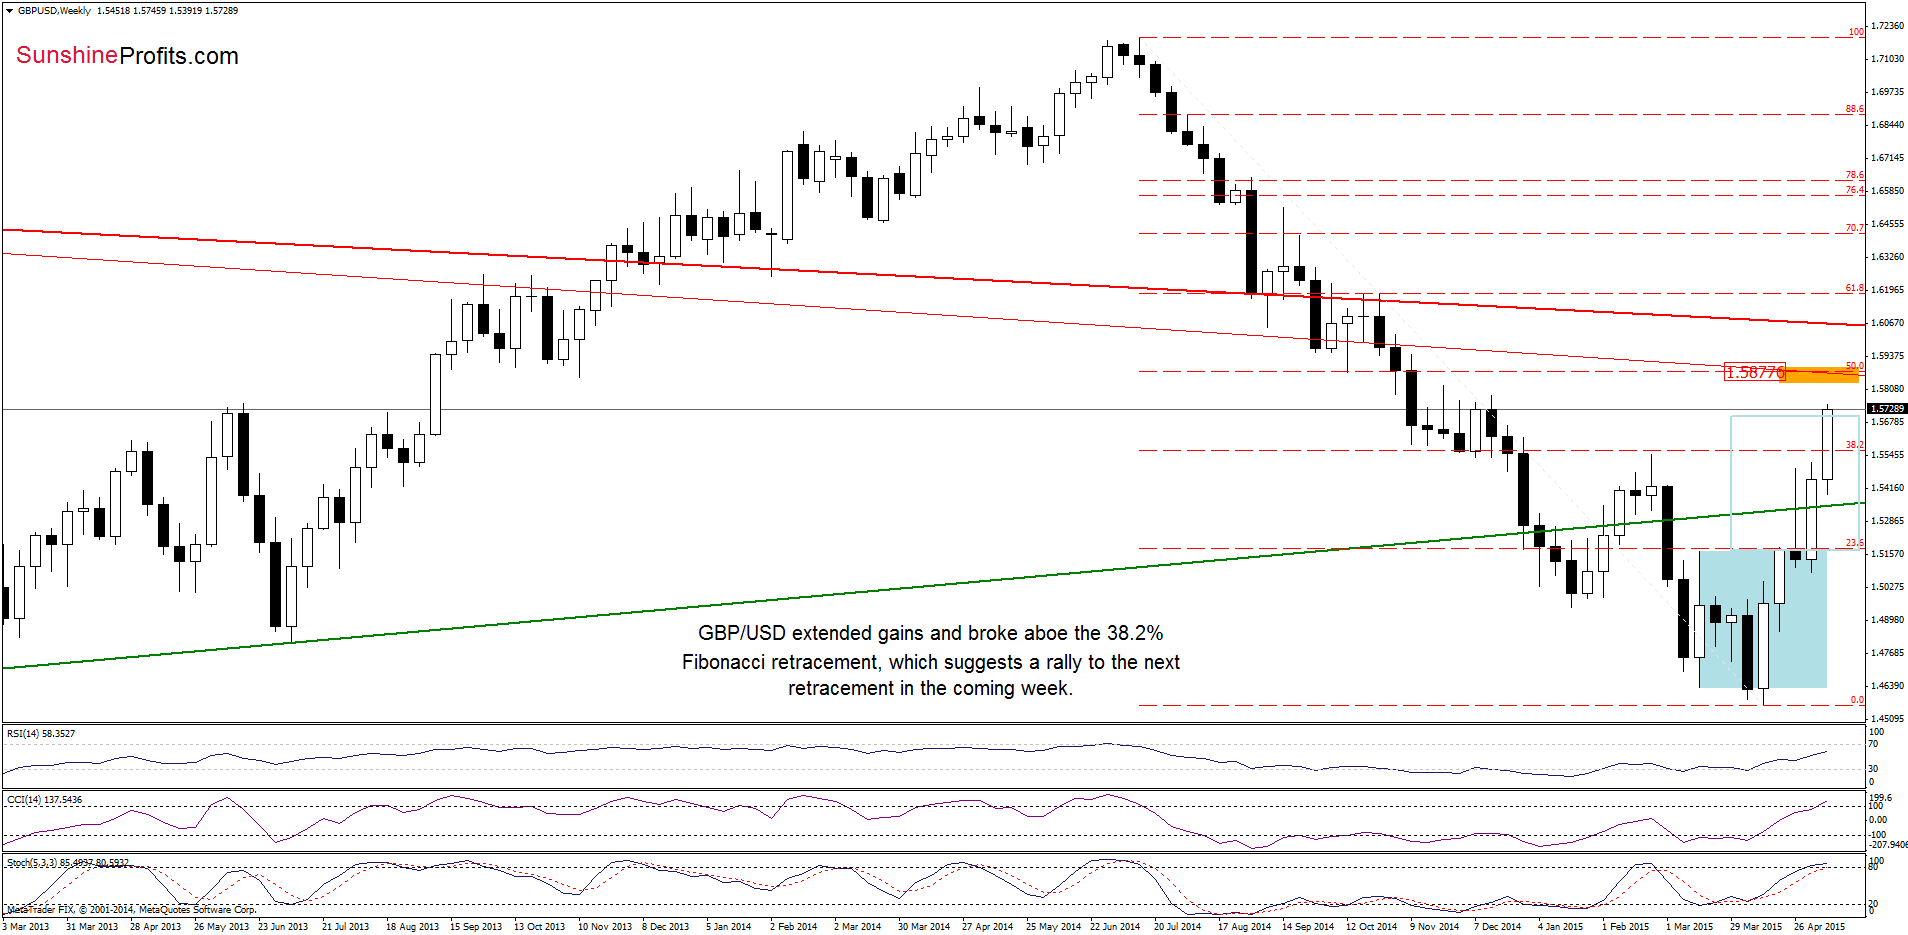
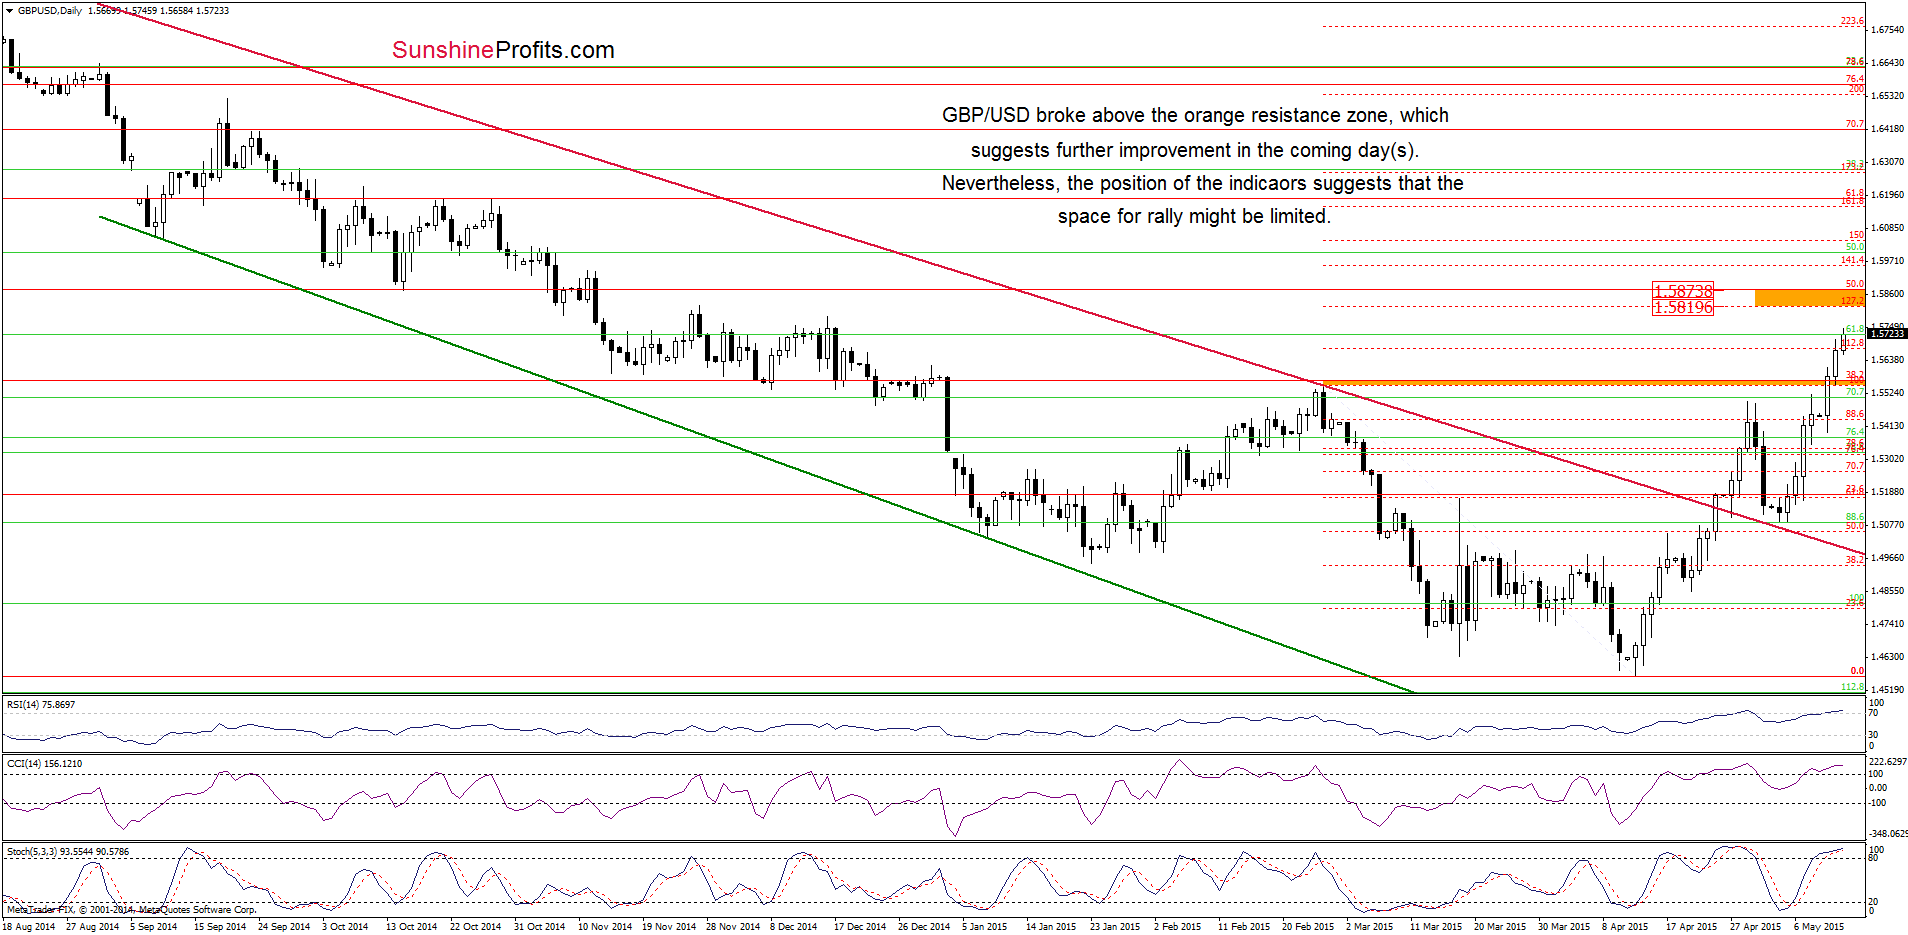
Looking at the above charts, we see that GBP/USD extended gains and broke above the orange resistance zone created by the Feb high and the 38.2% Fibonacci retracement. This positive signal triggered further improvement and the exchange rate climbed to the 112.8% Fibonacci extension, which suggests that we’ll likely see an increase to around 1.5820-1.5873, where the 127.2% Fibonacci extension, the 50% Fibonacci retracement (based on the entire Jul-Apr declines) and the long-term red resistance line (marked on the weekly chart) are. Finishing today’s commentary on this currency pair, we would like to draw your attention to the current position of the indicators: the RSI climbed above the level of 70, while the CCI and Stochastic Oscillator are overbought (which could translate to sell signals in the coming days). This is a negative signal, which suggests that the space for further rally might be limited.
Very short-term outlook: bullish
Short-term outlook: mixed
MT outlook: mixed
LT outlook: mixed
Trading position (short-term; our opinion): No positions are justified from the risk/reward perspective at the moment. We will keep you informed should anything change, or should we see a confirmation/invalidation of the above.
AUD/USD
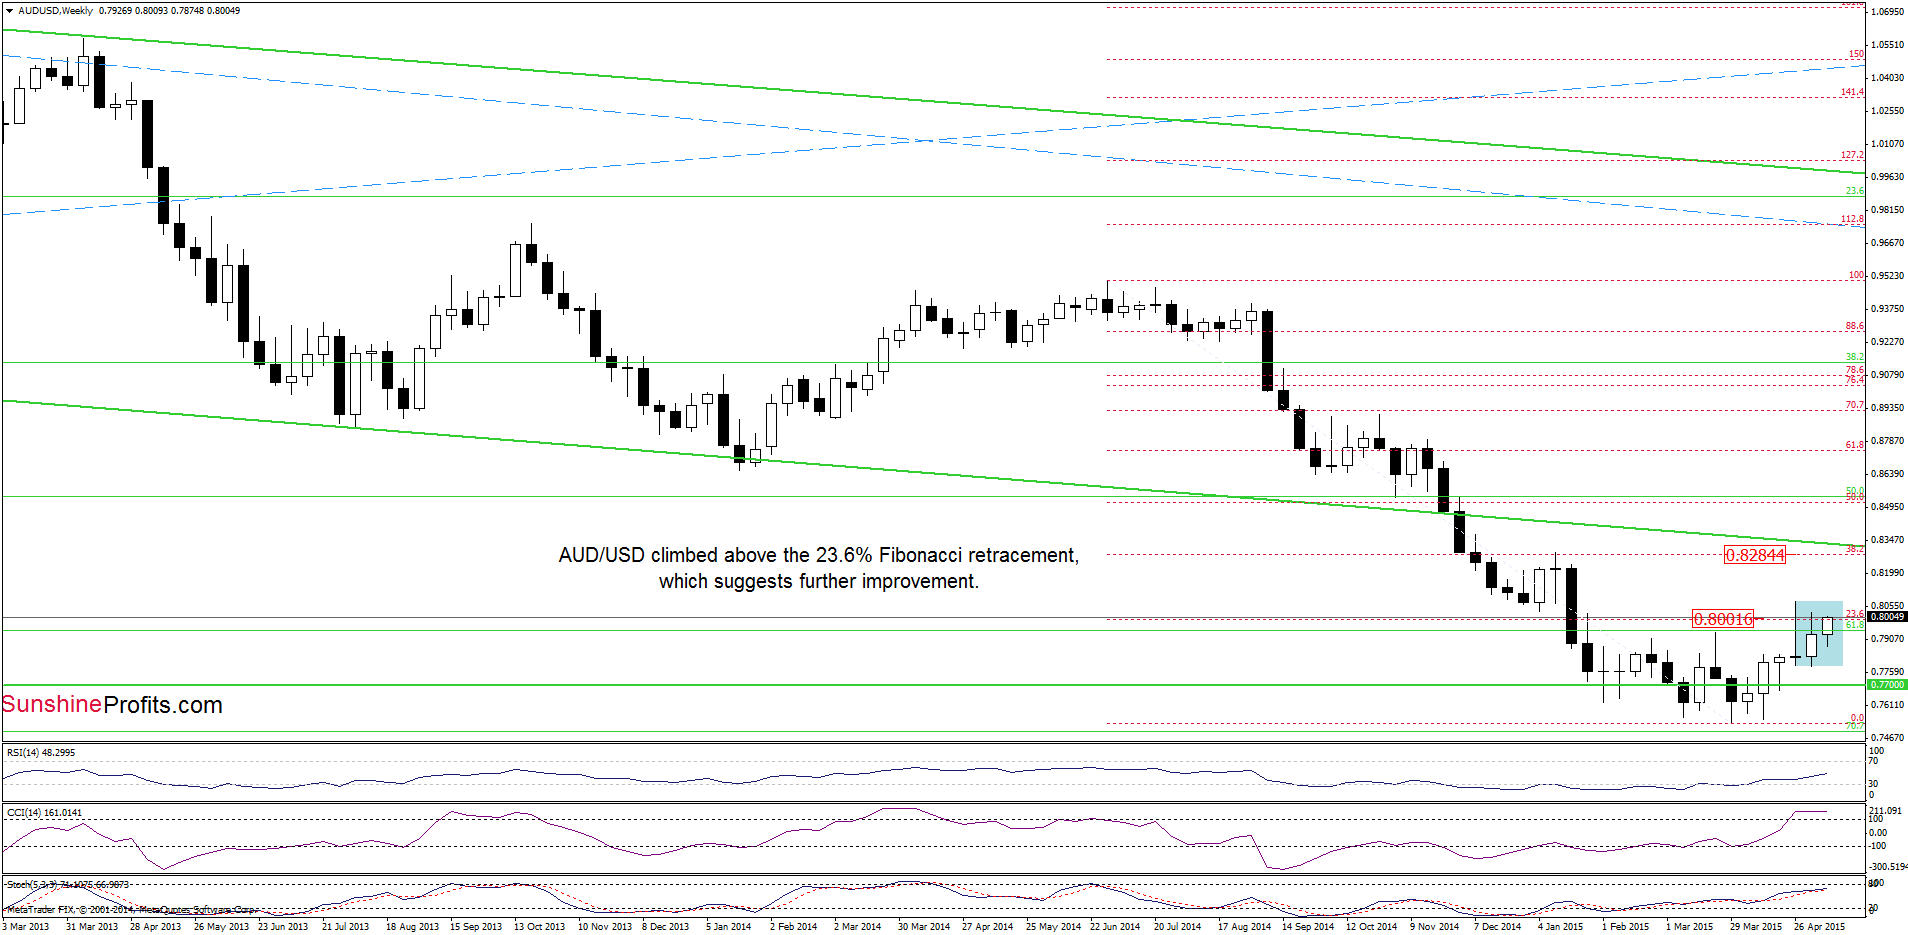
The medium-term picture has improved as AUD/USD reversed and climbed above the 23.6% Fibonacci retracement, which suggests further improvement.
How high could the exchange rate go? Let’s examine the daily chart and find out.
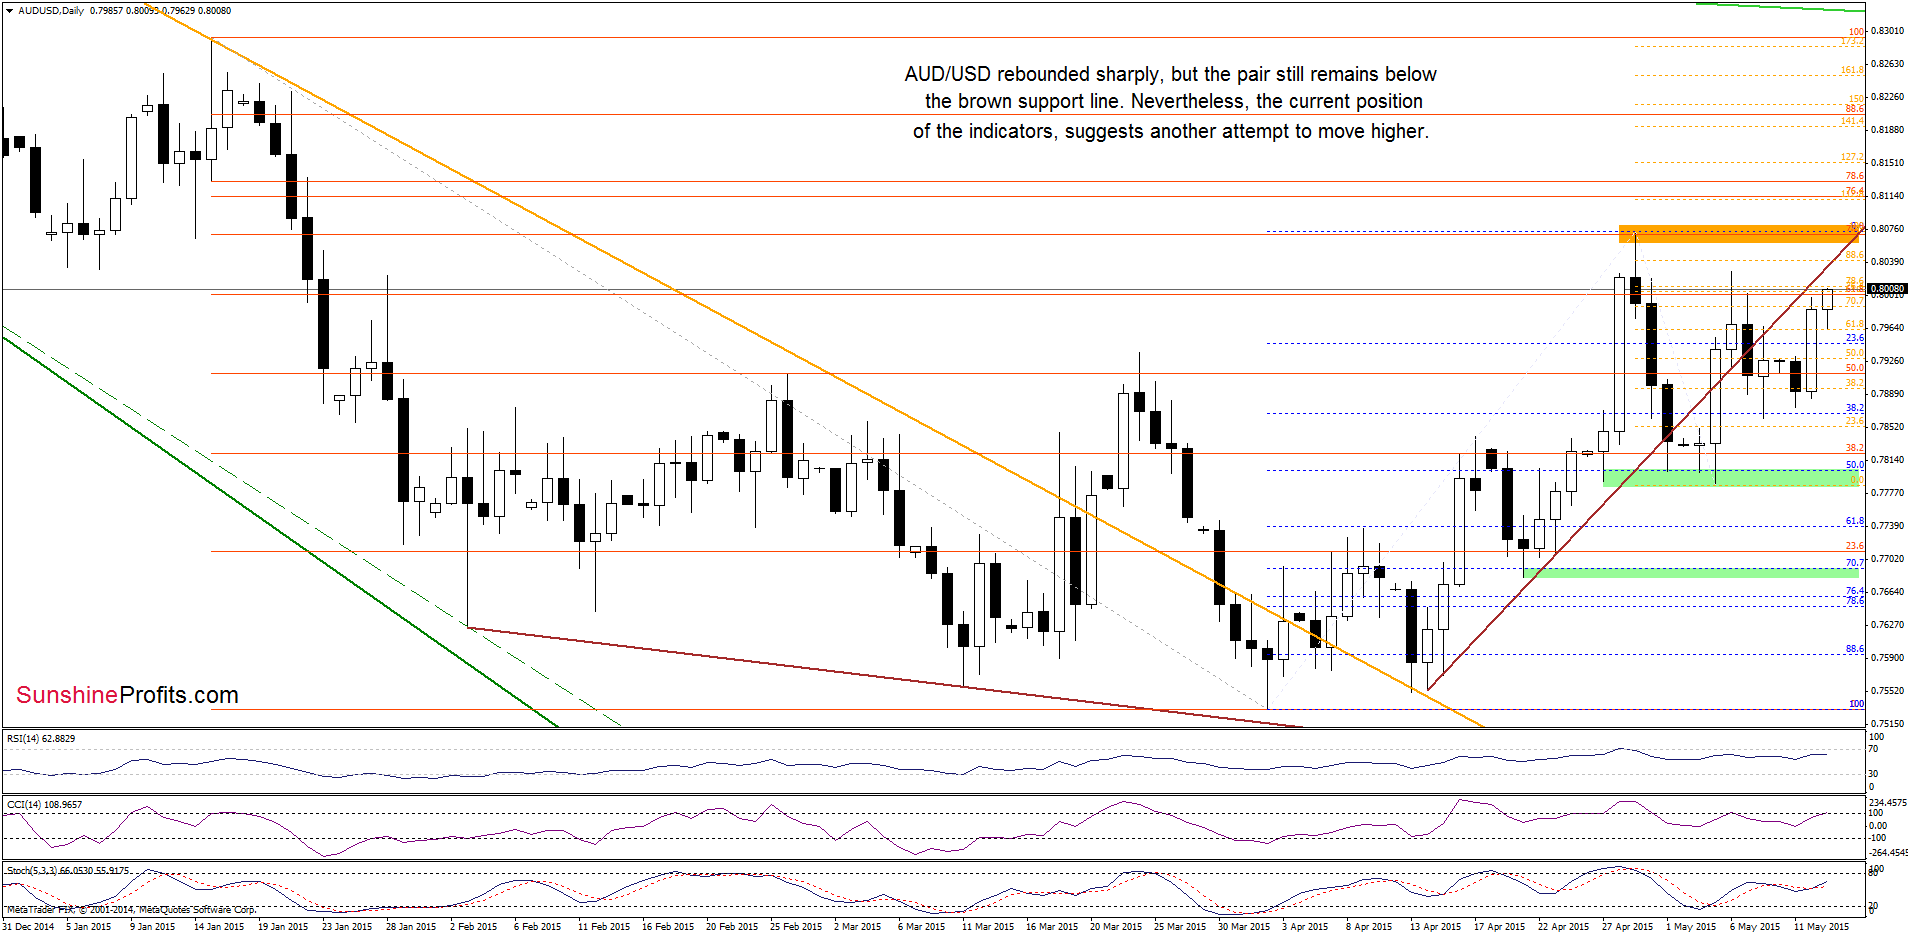
On the above chart, we see that AUD/USD reversed and almost erased the recent decline. Despite this improvement, the pair still remains under the previously-broken brown resistance line and the resistance zone created by the 76.4% and 78.6% Fibonacci retracement levels. In the previous week this area triggered a pullback, but taking into account buy the current position of the indicators and the medium-term picture, it seems that currency bulls will try to push the pair higher. If they succeed, and AUD/USD climbs above the brown line, it would be a positive sign, which will open the way to the Apr high and the next resistance zone around 0.8113-0.8129 (the 76.4% and 78.6% Fibonacci retracement levels based on the Jan-Apr declines).
Very short-term outlook: mixed with bullish bias
Short-term outlook: mixed
MT outlook: mixed
LT outlook: mixed
Trading position (short-term; our opinion): No positions are justified from the risk/reward perspective at the moment. We will keep you informed should anything change, or should we see a confirmation/invalidation of the above.
Thank you.
Nadia Simmons
Forex & Oil Trading Strategist
Przemyslaw Radomski, CFA
Founder, Editor-in-chief
Gold & Silver Trading Alerts
Forex Trading Alerts
Oil Investment Updates
Oil Trading Alerts

