
In the recent days, the USD Index bounced off Monday’s low, erasing not only the previous week’s decline, but also approaching the barrier of 100 as growing expectations for a U.S. rate hike in June continues to support to the U.S. currency. What impact did this rally have on major currency pairs?
In our opinion the following forex trading positions are justified - summary:
- EUR/USD: none
- GBP/USD: none
- USD/JPY: none
- USD/CAD: short (stop loss order at 1.2876)
- USD/CHF: none
- AUD/USD: none
EUR/USD
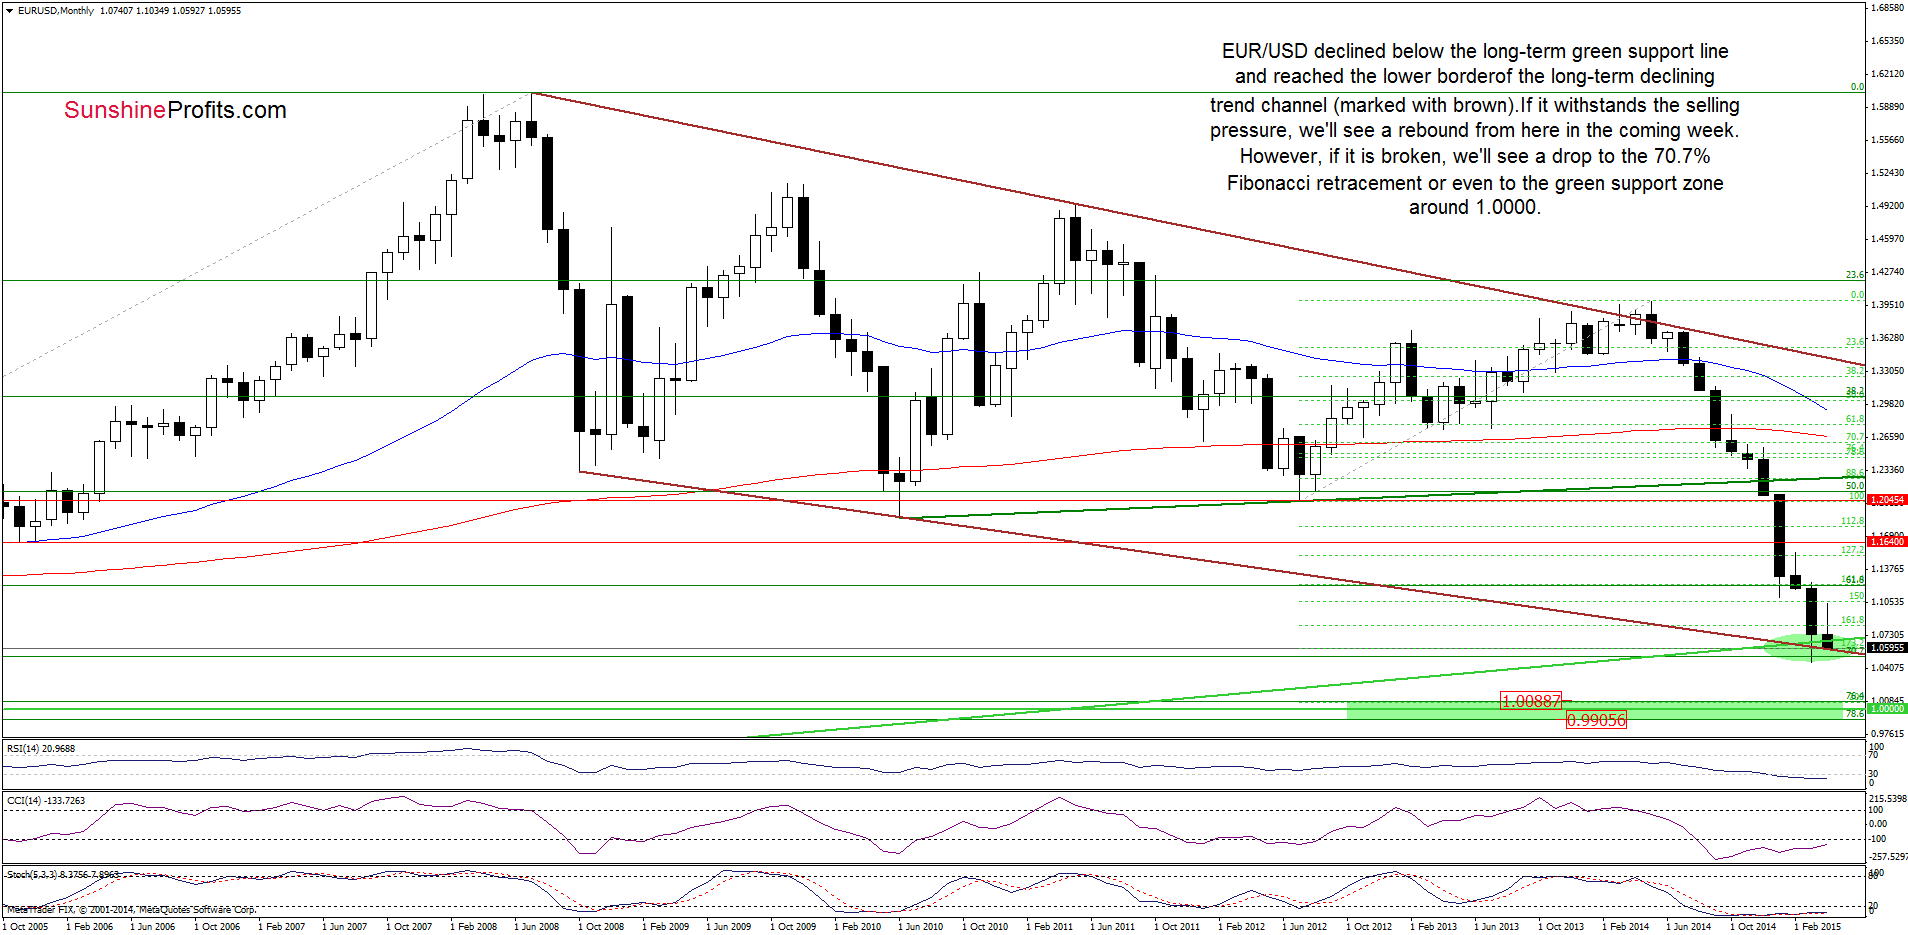
On the above chart, we see that EUR/USD extended declines and dropped below the long-term green support/resistance line and reached the lower border of the long-term declining trend channel (marked with brown). If it withstands the selling pressure, we’ll see a rebound from here in the coming week. However, if it is broken, we’ll see a drop to the 70.7% Fibonacci retracement or even to the green support zone around 1.0000.
Which scenario is more likely at the moment? Let’s examine the daily chart and look for more clues about future moves.
Yesterday, we wrote the following:
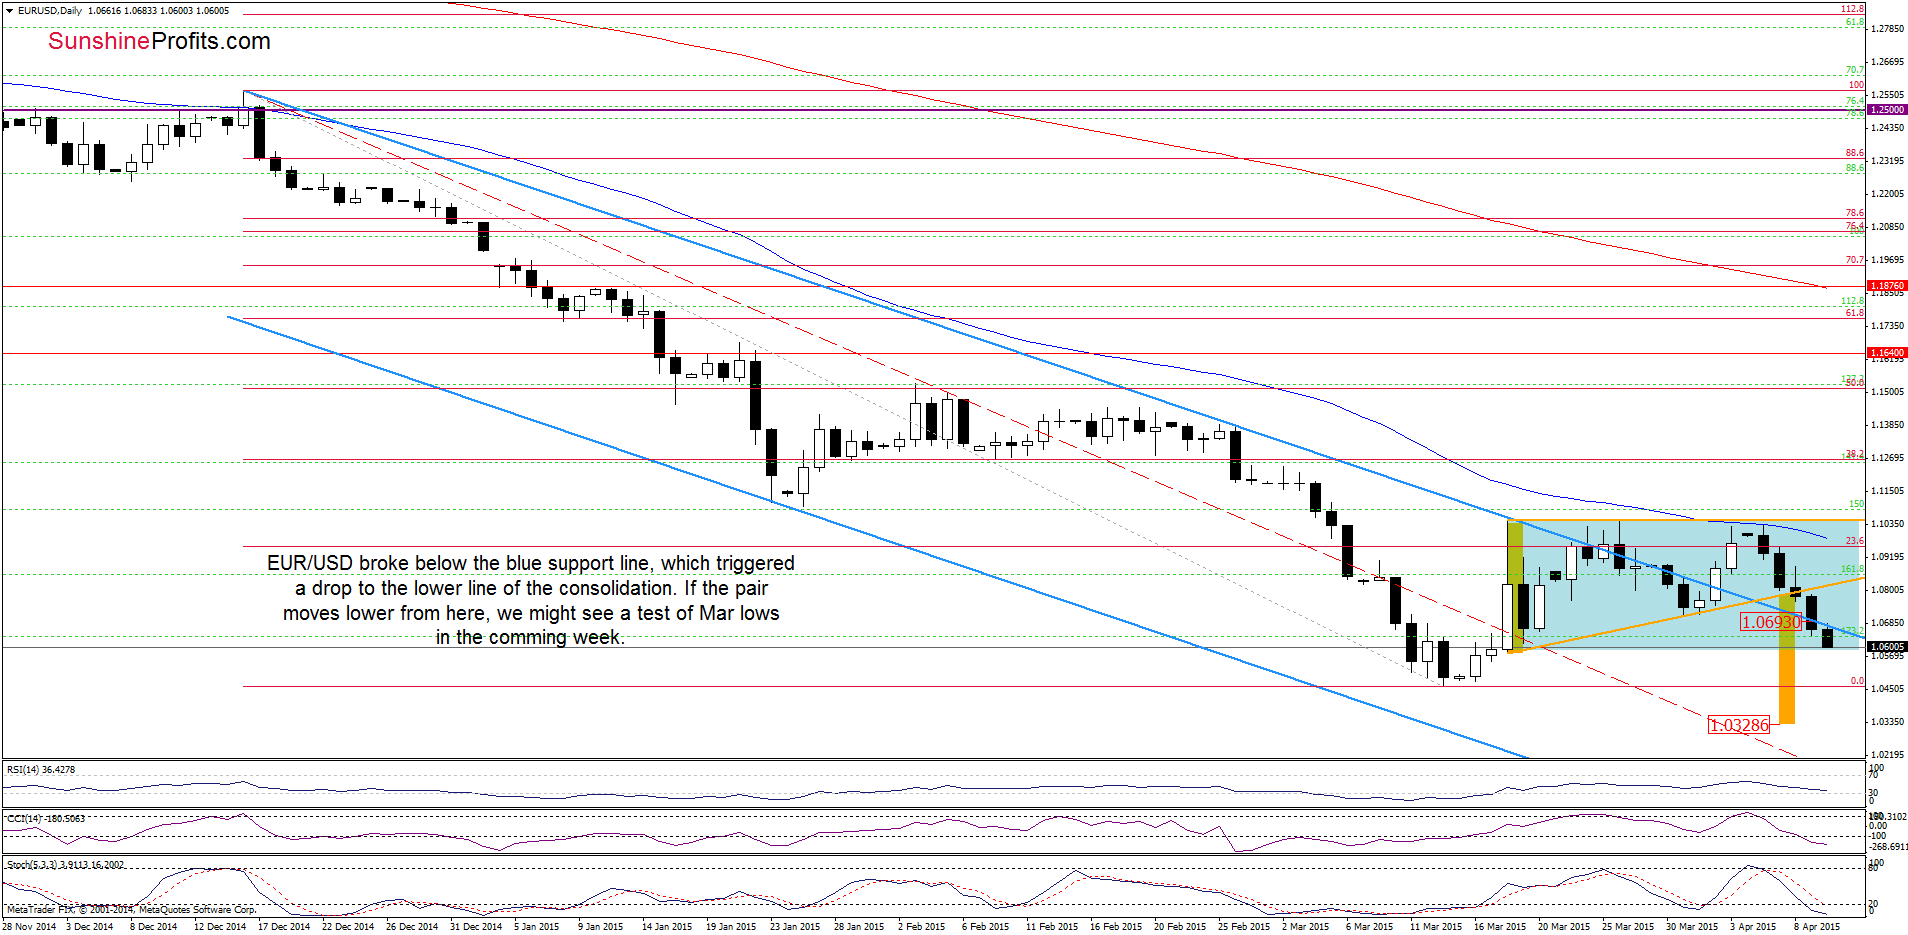
(…) EUR/USD declined below the orange support line, which suggests further deterioration. How low could the pair go? We think that (…) we’ll see at least a test of the previously-broken upper border of the declining trend channel (…). If it is broken, the next target for currency bears would be the lower line of the consolidation at 1.0579 or even March lows.
As you see on the daily chart, the situation developed in line with the above-mentioned scenario and EUR/USD reached the lower line of the consolidation. This is the place, where we should consider two scenarios. On one hand, if the pair moves lower from here, we’ll see a breakdown below the border of the formation, which will trigger a test the March lows in the coming days. On the other hand, if the exchange rate rebounds from here, we might see an invalidation of the breakdown under the blue support/resistance line and an increase to around 1.0832 (the previously-broken orange line). Which scenario is more likely? Taking into account the current position of the indicators (sell signals remain in place) it seems that currency bears will push the pair lower. Nevertheless, we think that today’s daily/weekly close give us more clues about future moves.
Very short-term outlook: mixed with bearish bias
Short-term outlook: mixed
MT outlook: mixed
LT outlook: mixed
Trading position (short-term; our opinion): No positions are justified from the risk/reward perspective at the moment. We will keep you informed should anything change, or should we see a confirmation/invalidation of the above.
GBP/USD
Quoting our last commentary on this currency pair:
(…) taking into account te fact that the pair dropped under the 2013 lows once again, it seems that we could see further deterioration and a test of the mid-Mar low in the coming week(s).
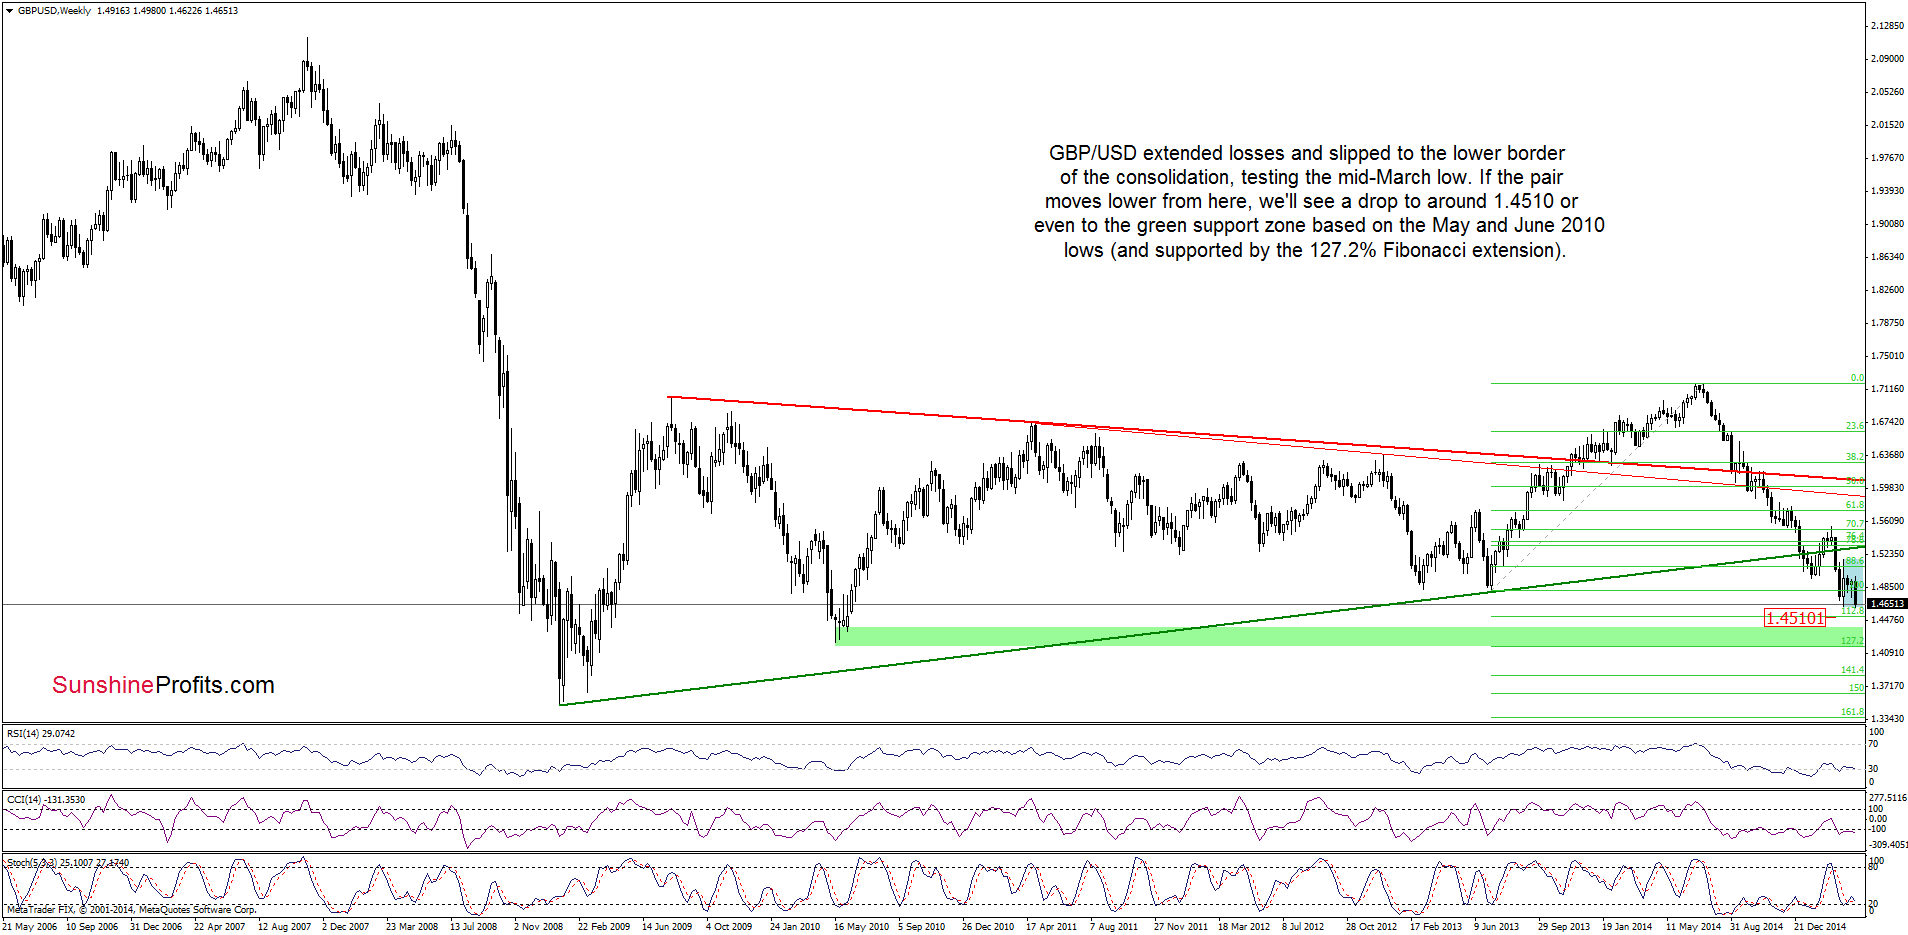
On the above chart we see that currecy bears pushed the exchange rate lower as we expected. With this downswing GBP/USD slipped below the mid-Mar low, hitting a fresh 2015 low. Despite this deterioration, the pair rebounded slightly, but if we see a weekly close below the previous low, it would be a bearish signal, which will likely trigger further deterioration and a drop to around 1.4510, where the 112.8% Fibonacci extension is. Please note that suh price action will also result in a breakdown under the lower line of the consolidation, which means that we could see a decline even to the green support zone created by the Nay and June 2010 lows and reinforced by the 127.2% Fibonacci extension.
Are there any short-term support levels that could hinder the realization of the above-mentioned scenario? Let’s check.
Yesterday, we wrote:
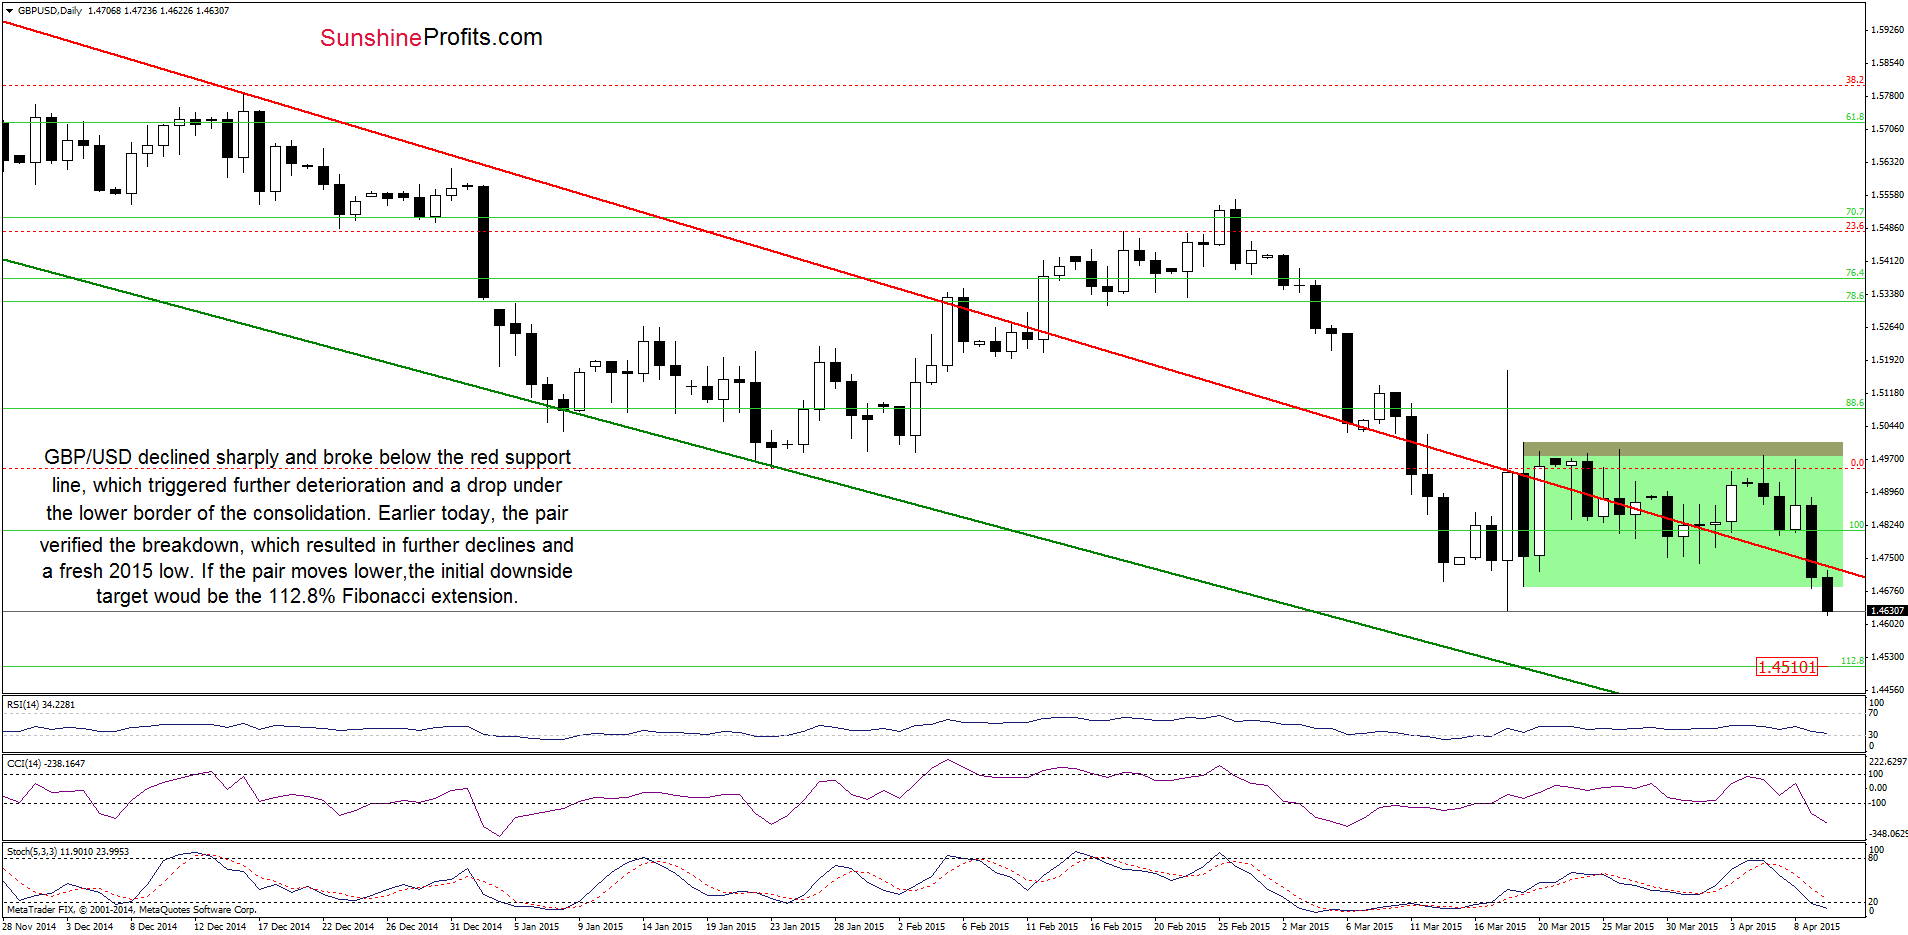
(…) the resistance zone created by the upper line of the consolidation and the 38.2% Fibonacci retracement successfully stopped further improvement, triggering a sharp pullback. Taking this fact into account and combining it with the current position of the indicators (sell signals generated by the CCI and Stochastic Oscillator reain in place), it seems that the pair will extend declines and test the red declining line n the coming day(s). If it is broken, the pair will move lower and test the lower line of the consolidation or even the mid-Mar low (…) in the near future.
From todays point of view, we see that th situation developed in line with the above scenario. With today’s downswing GBP/USD slipped below the March low, which suggests that if currency bulls do not invalidate the breakdown before today’s daily close, we’ll see a decline to the nearest support level (the 112.8% Fibonacci extension at 1.450). Please note that thi scenario is currently reinforced by the positionn of the indicators (sell signals reain in place).
Very short-term outlook: mixed with bearish bias
Short-term outlook: mixed
MT outlook: mixed
LT outlook: mixed
Trading position (short-term; our opinion): No positions are justified from the risk/reward perspective at the moment. We will keep you informed should anything change, or should we see a confirmation/invalidation of the above.
USD/JPY
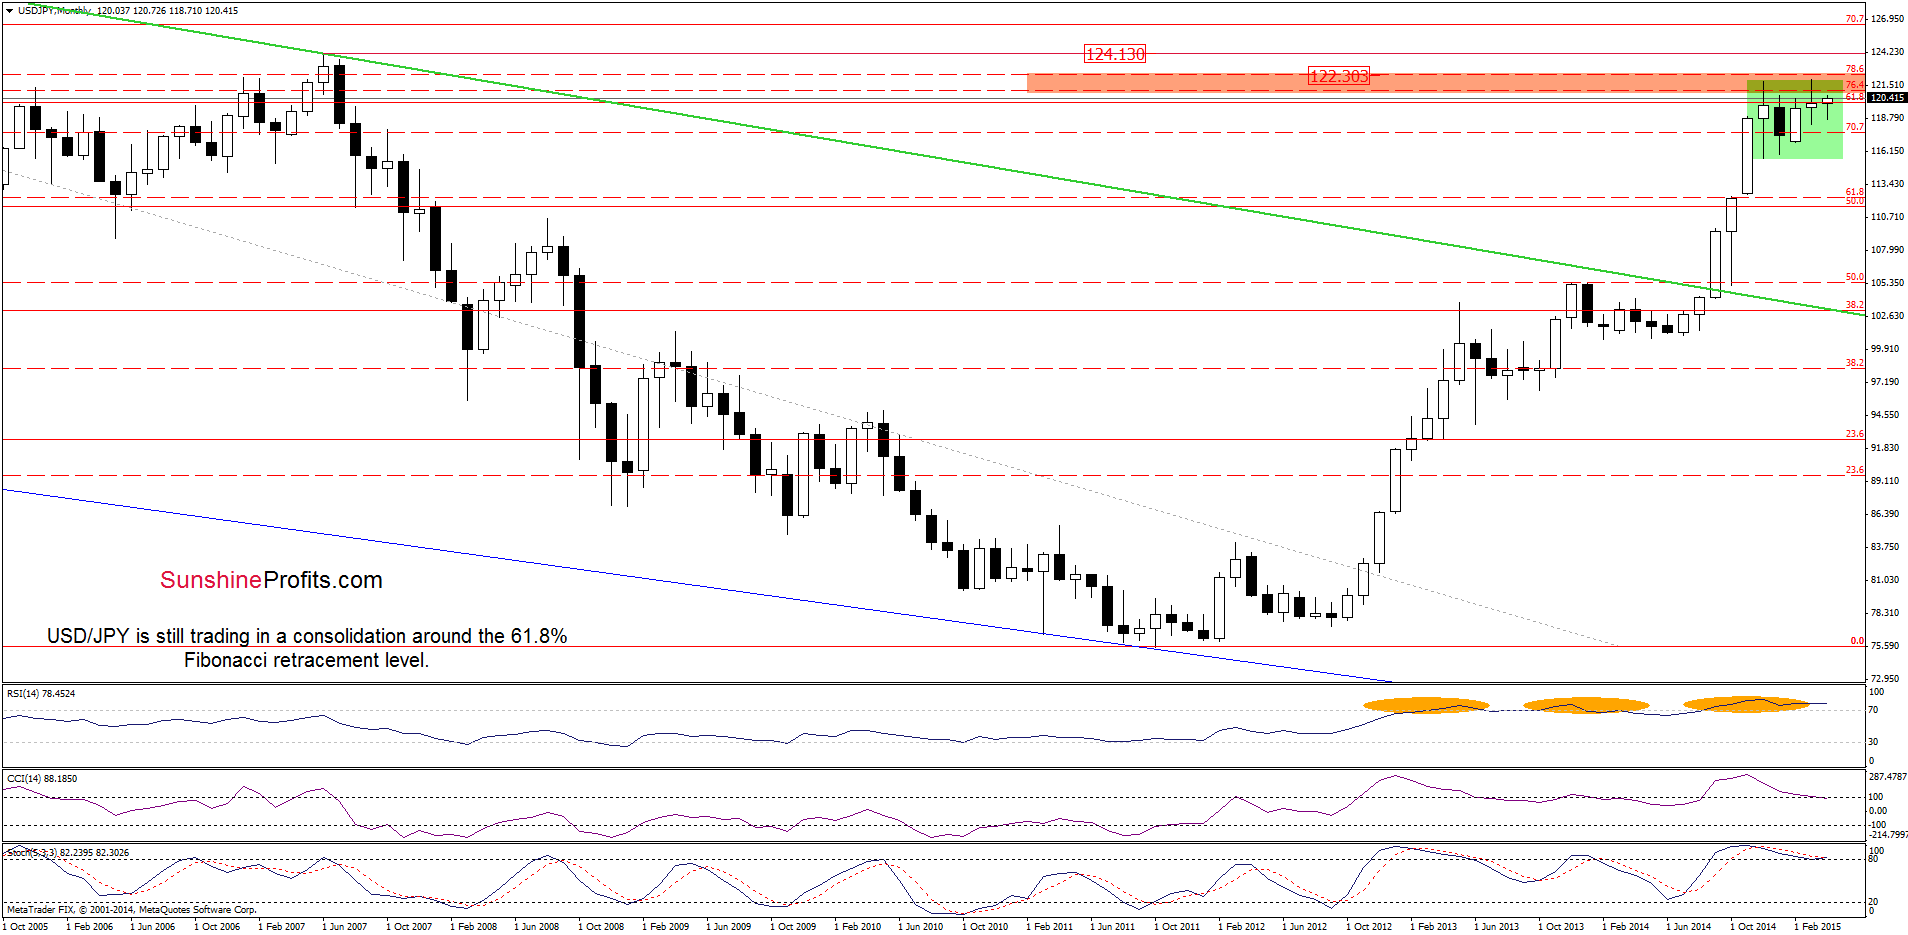
The medium-term outlook remains mixed as USD/JPY is still trading in a consolidation (between the Dec high and low) around the 61.8% Fibonacci retracement level (based on the entire 1998-2011 declines).
Having said that, let’s focus on the daily chart and look for more clues about future moves.
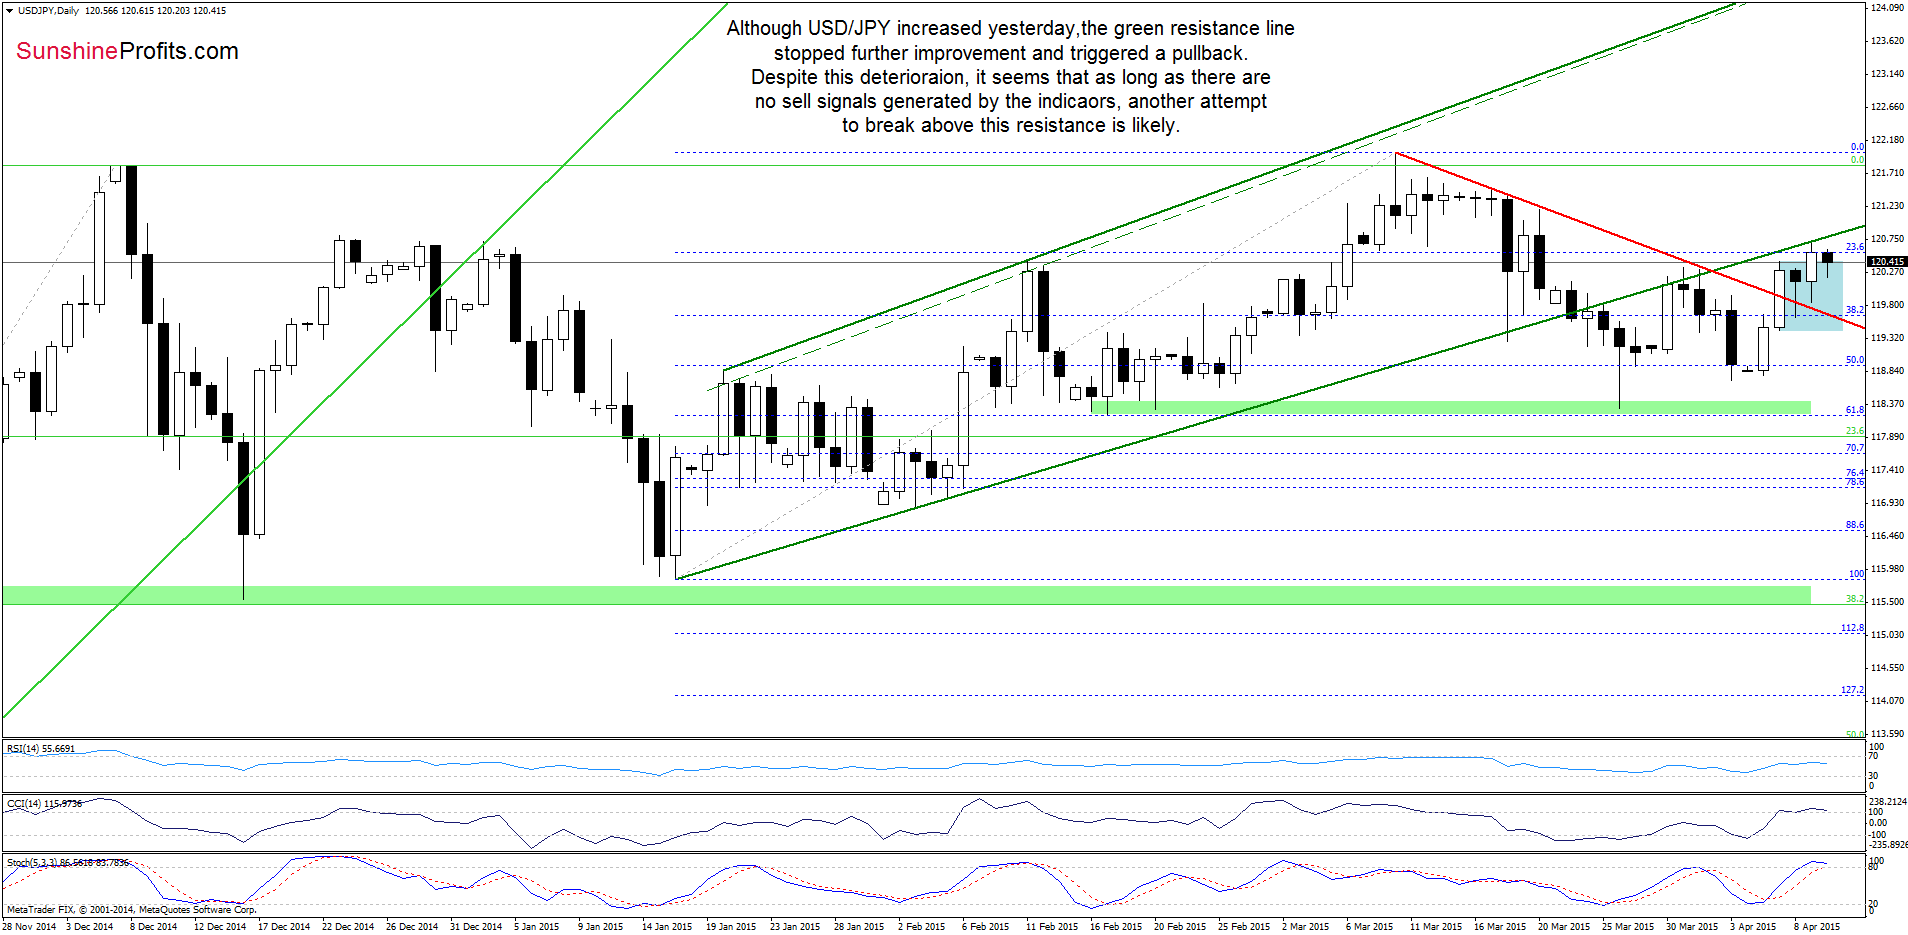
Although USD/JPY increased yesterday, the green resistance line stopped further deterioration and triggered a pullback. Despite this deterioration, it seems that as long as there are no sell signals, another attempt to break above this resistance line can’t be ruled out. Nevertheless, taking into account the current position of the indicators, we think that the coming week will bring a decline to the red declining line.
Very short-term outlook: mixed
Short-term outlook: mixed
MT outlook: mixed
LT outlook: bullish
Trading position (short-term; our opinion): No positions are justified from the risk/reward perspective at the moment. We will keep you informed should anything change, or should we see a confirmation/invalidation of the above.
USD/CAD
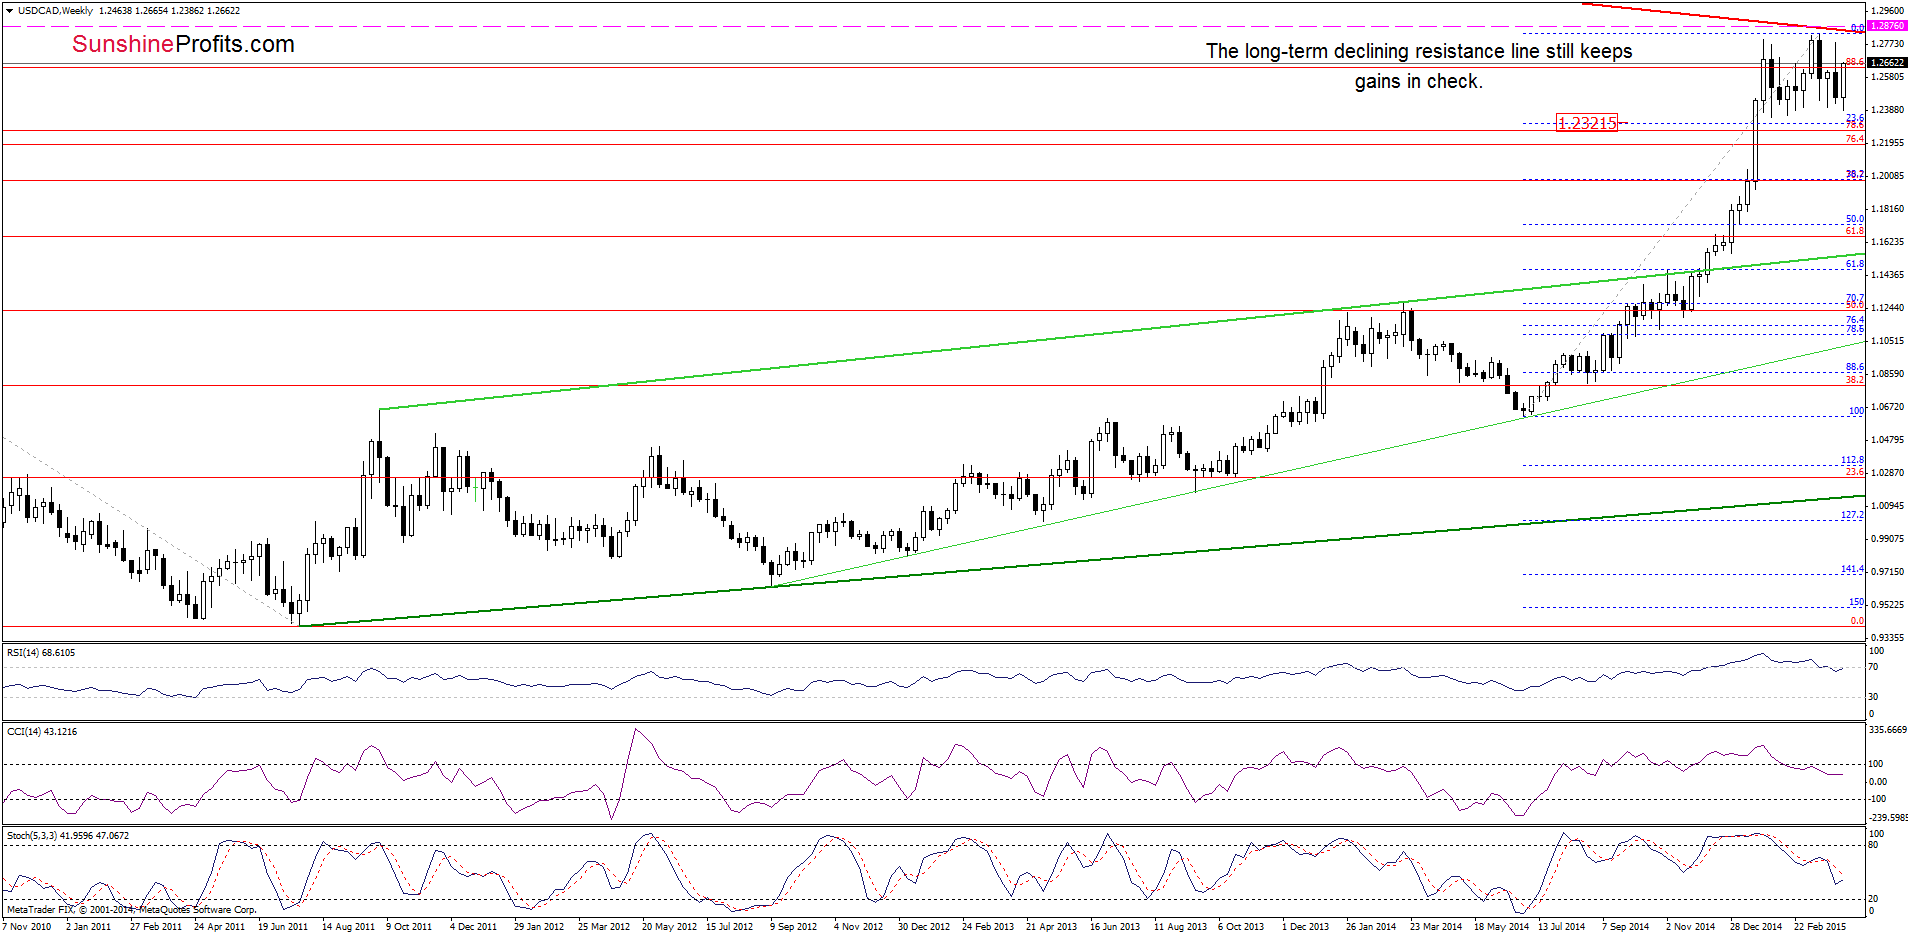
On the weekly chart, we see that although USD/CAD moved higher this week, the exchange rate is still trading under the long-term red declining resistance line, which keeps gains in check. Taking this fact into account, and combining it with sell signals generated by all indicators, we think that further deterioration is just around the corner.
Are there any short-term factors that could support or hinder the realization of the above scenario? Let’s check.
Quoting our Forex Trading Alert posted on Wednesday:
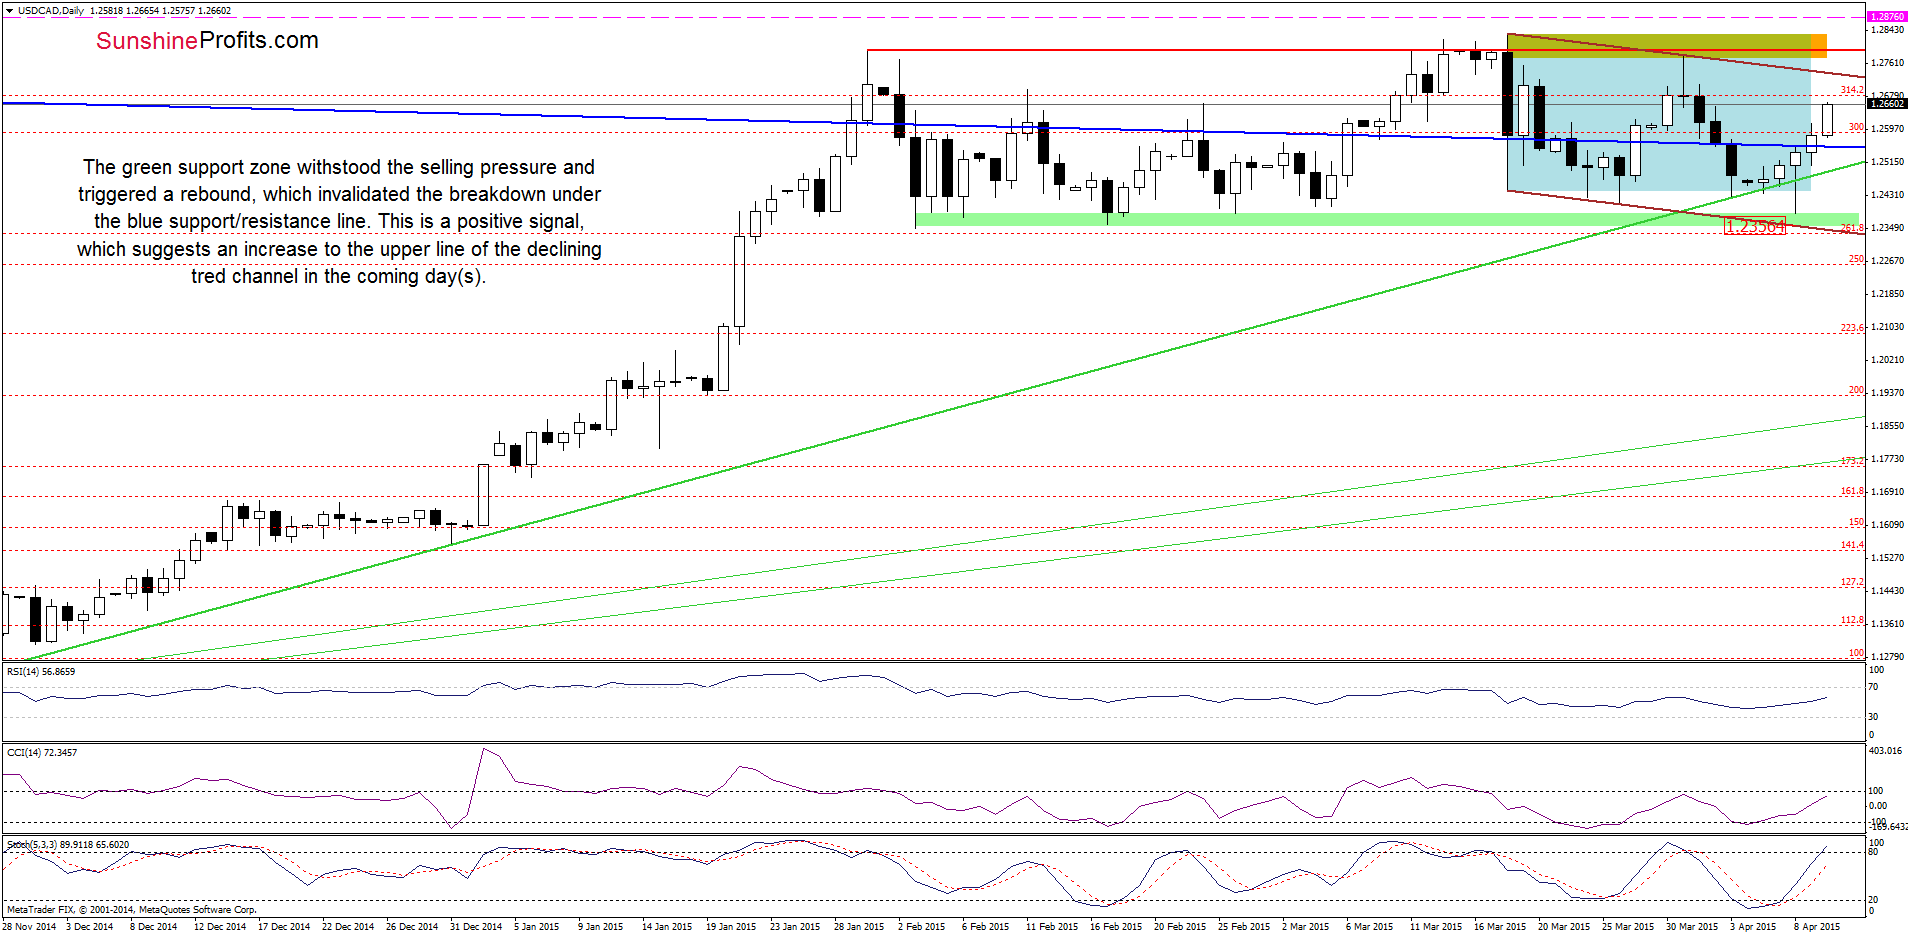
(…) If the exchange rate declines (…), it would be a bearish signal, which will trigger further deterioration and a drop to at least the green support zone, which is currently reinforced by the lower border of the declining trend channel (marked with brown) around 1.2356.
Looking at the daily chart, we see that the situation developed in line with the above-mentioned scenario and USD/CAD reached our downside target. As you see on the chart, the green support zone withstood the selling pressure and triggered a rebound, which invalidated the breakdown under the blue support/resistance line. This is a positive signal, which suggests an increase to the upper line of the declining trend channel in the coming day(s). Nevertheless, even if we see such price action, we think that the orange resistance zone created by the recent highs in combination with the red long-term resistance line marked on the weekly cart will stop further improvement.
Very short-term outlook: bearish
Short-term outlook: mixed with bearish bias
MT outlook: mixed
LT outlook: mixed
Trading position (short-term; our opinion): Short positions with a stop loss order at 1.2876 are justified from the risk/reward perspective. We will keep you informed should anything change, or should we see a confirmation/invalidation of the above.
USD/CHF
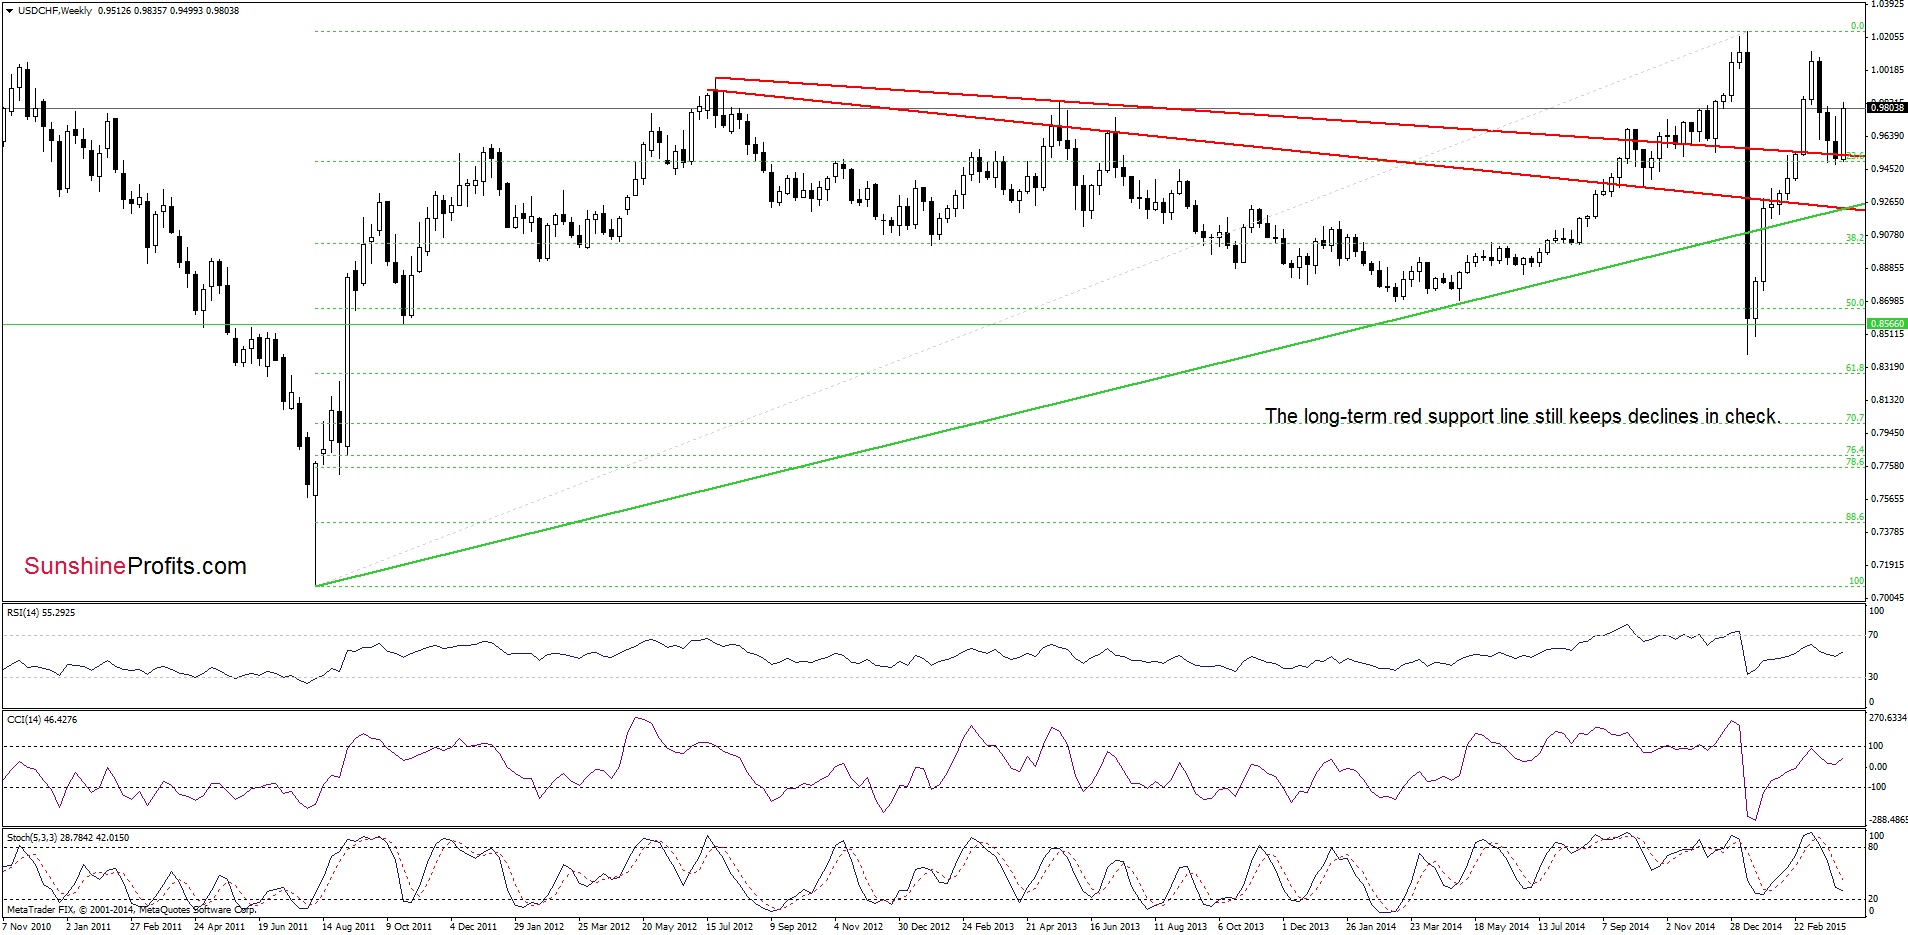
The situation in the medium-term perspective hasn’t changed much as USD/CHF still remains above the long-term red support line. Nevertheless, we should keep in mind that the sell signal generated by the Stochastic Oscillator is still in play, supporting the bearish case.
Having said that, let’s check what we can infer from the daily chart.
Quoting our last commentary on this currency pair:
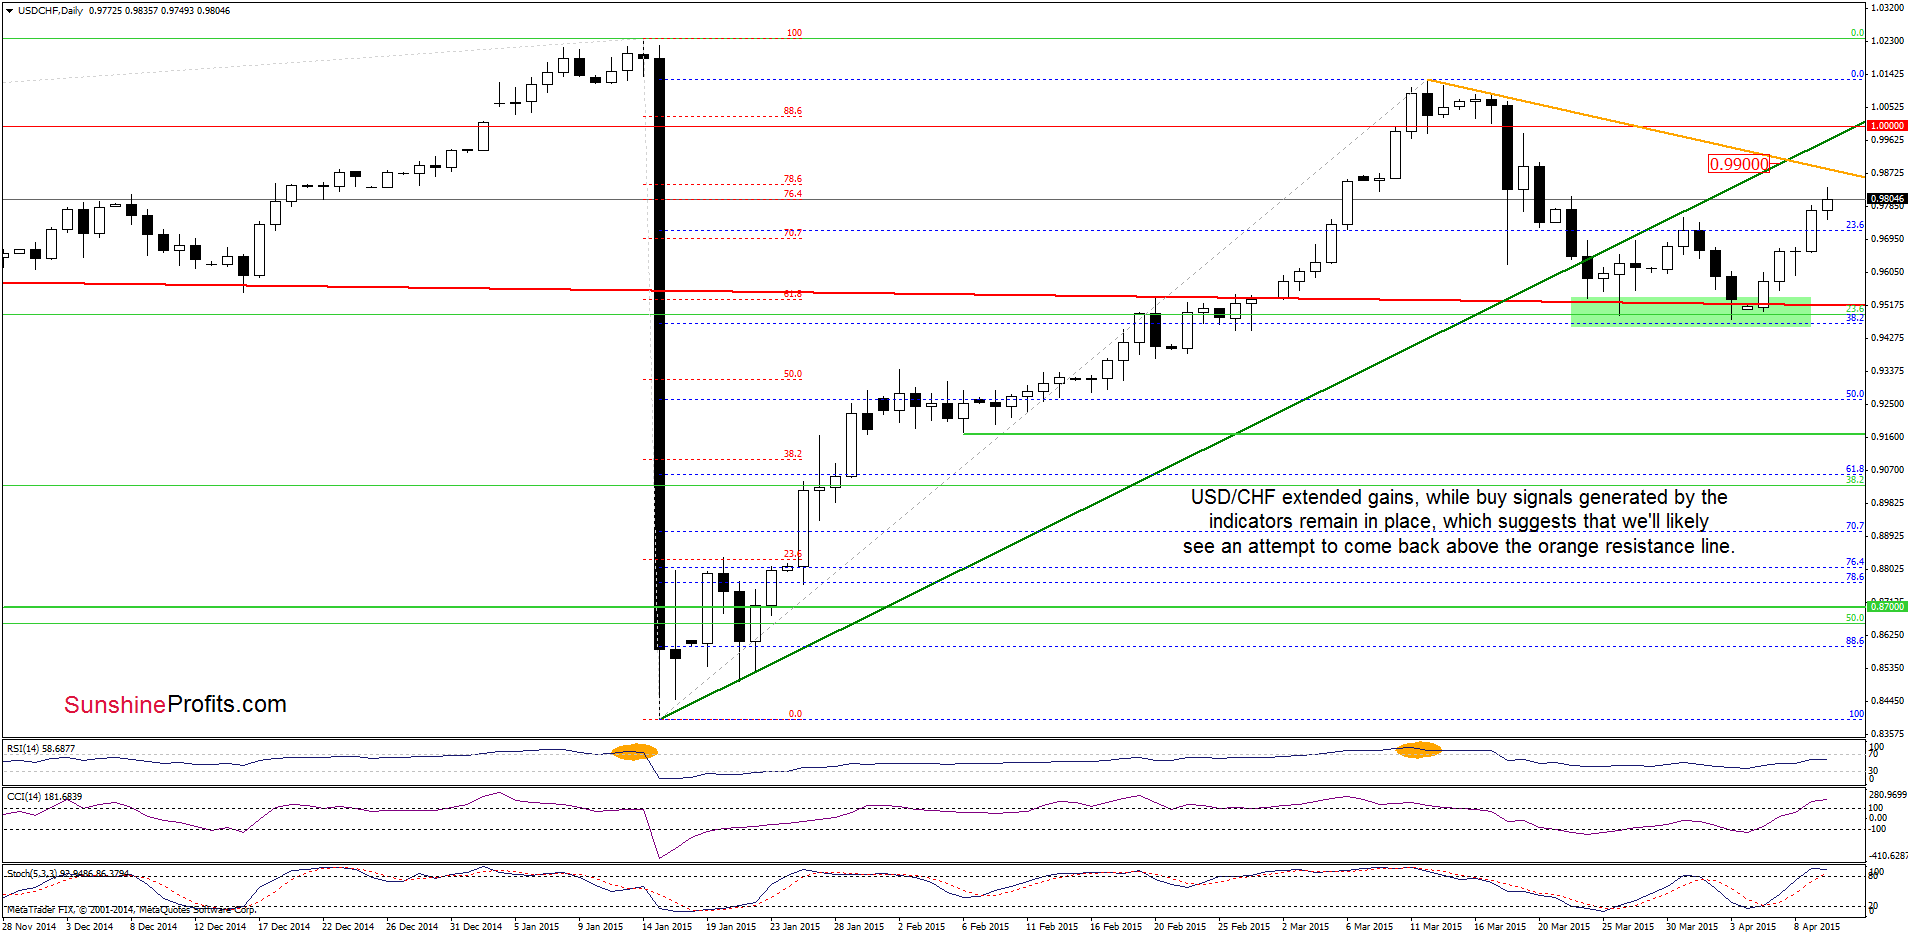
(…) the combination of the long-term red support line and the 38.2% Fibonacci retracement triggered a rebound. Additionally, the CCI and Stochastic Oscillator generated buy signals, supporting the bullish case and suggesting further improvement.
On the above chart, we see that USD/CHF extended gains as we expected. Additionally, buy signals generated by the indicators remain in play, which suggests that we’ll likely see an attempt to come back above the orange resistance line (currently around 0.9900) in the coming days.
Very short-term outlook: bullish
Short-term outlook: mixed
MT outlook: mixed
LT outlook: bearish
Trading position (short-term; our opinion): No positions are justified from the risk/reward perspective at the moment. We will keep you informed should anything change, or should we see a confirmation/invalidation of the above.
AUD/USD
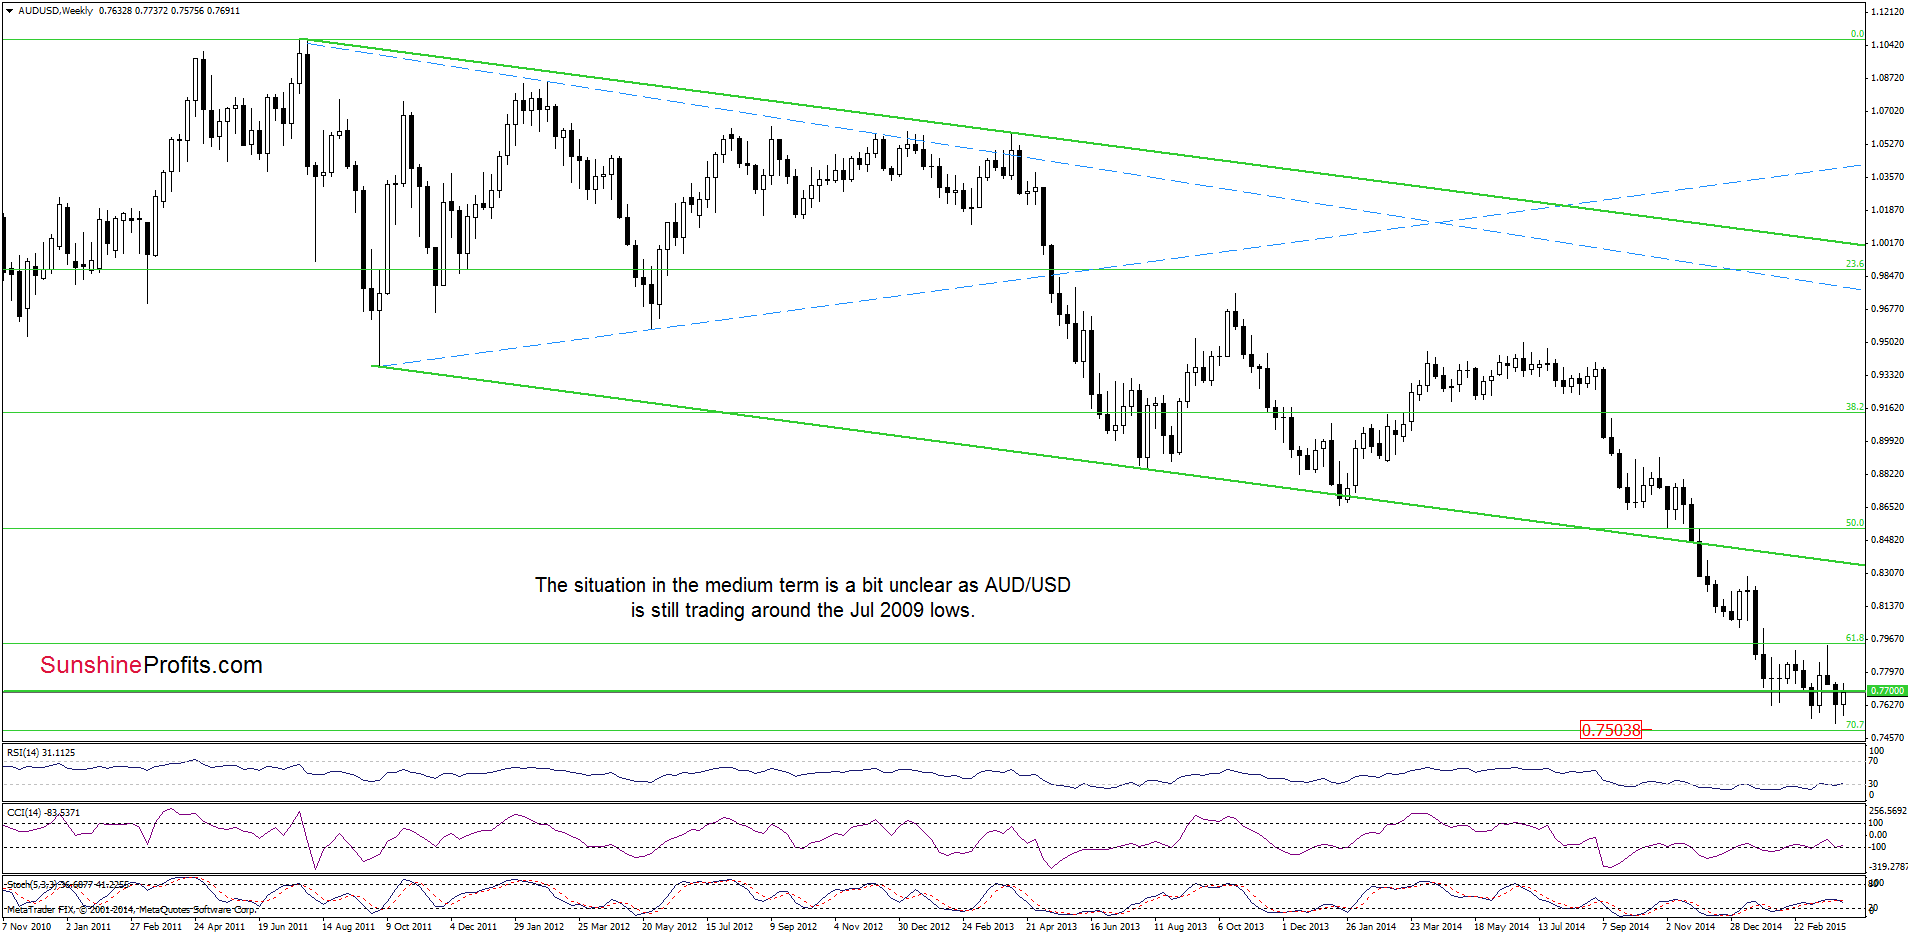
The medium-term outlook hasn’t changed much as AUD/USD is still trading around the Jul 2009 lows, making the outlook unclear. Therefore, we think that today’s closing price will give us more clues about future moves.
Having said that, let’s focus on the very short-term changes and examine the daily chart.
On Wednesday, we wrote the following:
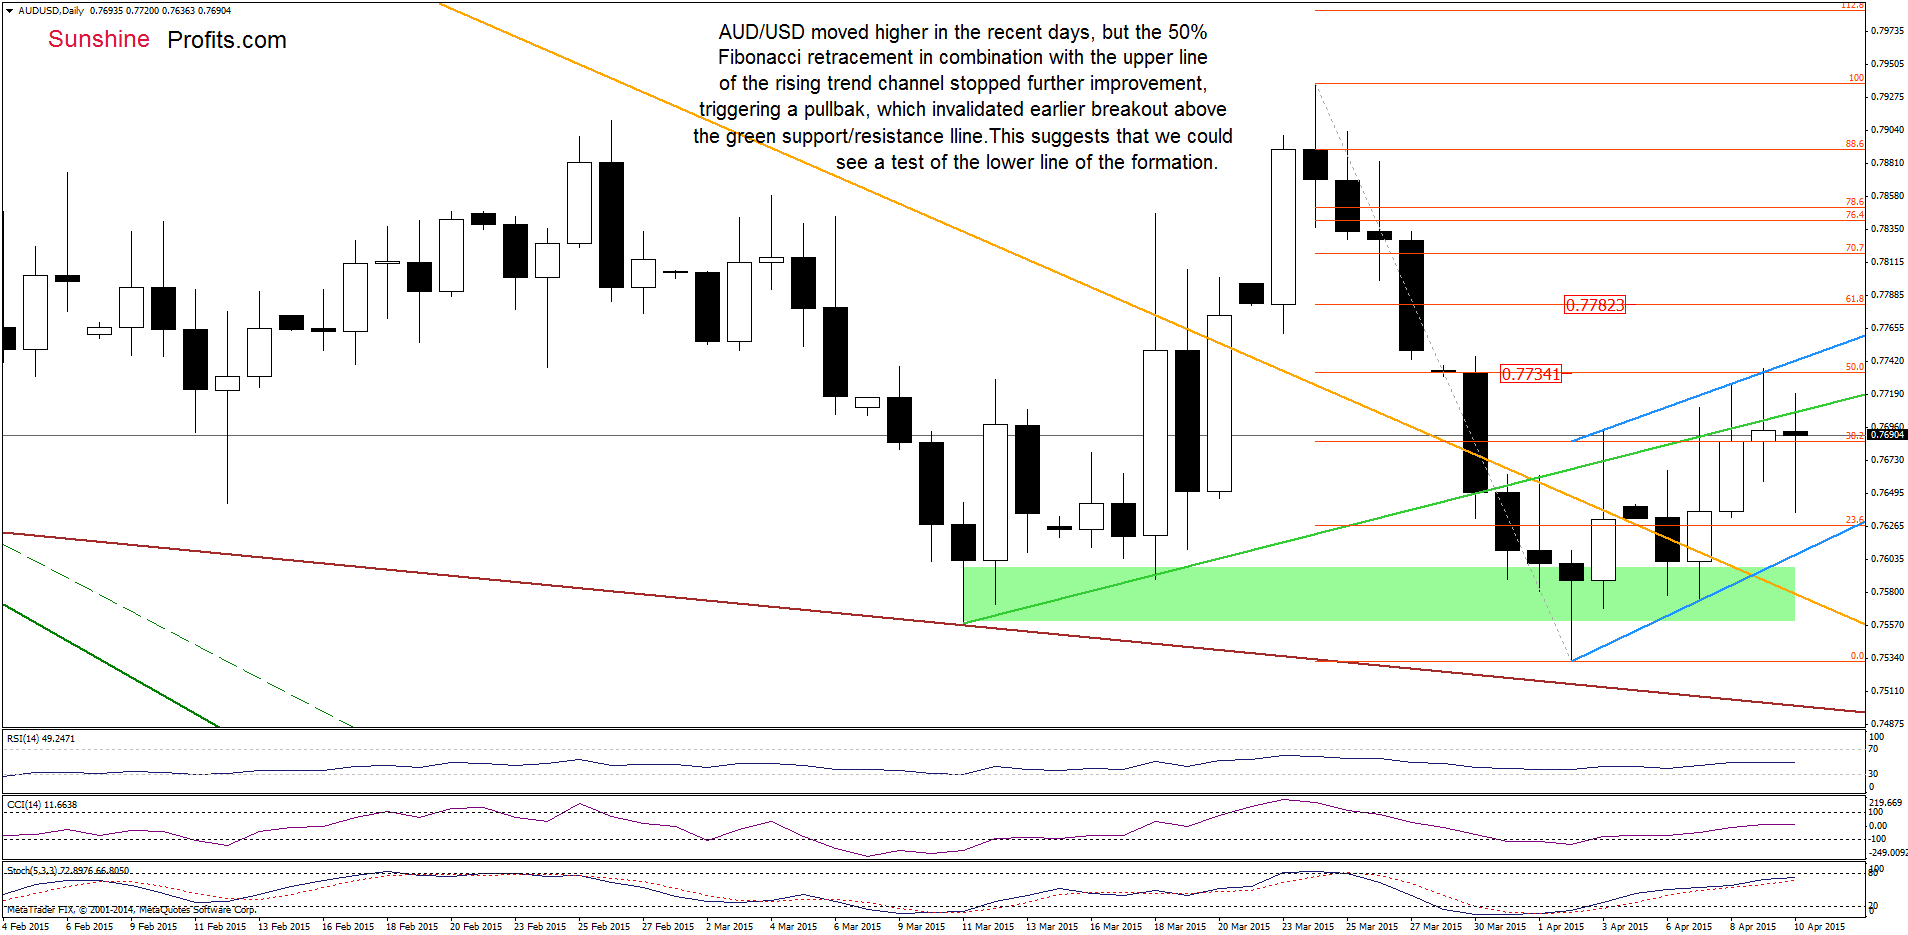
(…) currency bulls (…) managed to push AUD/USD above the previously-broken green line, which is an additional positive signal. On top of that, buy signals generated by the indicators remain in place supporting further improvement. If this is the case, the initial upside target would be around 0.7734, where the 50% Fibonacci retracement based on the Mar-Apr decline is.
Looking at the above chart, we see that AUD/USD reached our upside target yesterday. Despite this improvement, the 50% Fibonacci retracement in combination with the upper line of the rising trend channel (marked with blue) stopped further improvement, triggering a pullback, which invalidated earlier breakout above the green support/resistance line. This suggests that we could see a test of the lower line of the formation in the coming days (especially if the exchange rate closes the week under the Jul 2009 lows).
Very short-term outlook: mixed with bearish bias
Short-term outlook: mixed
MT outlook: mixed
LT outlook: mixed
Trading position (short-term; our opinion): No positions are justified from the risk/reward perspective at the moment. We will keep you informed should anything change, or should we see a confirmation/invalidation of the above.
Thank you.
Nadia Simmons
Forex & Oil Trading Strategist
Przemyslaw Radomski, CFA
Founder, Editor-in-chief
Gold & Silver Trading Alerts
Forex Trading Alerts
Oil Investment Updates
Oil Trading Alerts

