

Although industry data showed that U.K. house prices increased by 0.4% in March, beating expectations for a 0.2% gain, dark clouds gathered over the pound after the U.K. Office for National Statistics showed that the British trade deficit widened to £10.34 billion in February from £9.17 billion in January, missing analysts’ expectations. Thanks to these disappointing numbers, GBP/USD declined sharply, approaching Apr lows. Will we see further deterioration in the coming days?
In our opinion the following forex trading positions are justified - summary:
- EUR/USD: none
- GBP/USD: none
- USD/JPY: none
- USD/CAD: short (stop loss order at 1.2876)
- USD/CHF: none
- AUD/USD: none
EUR/USD
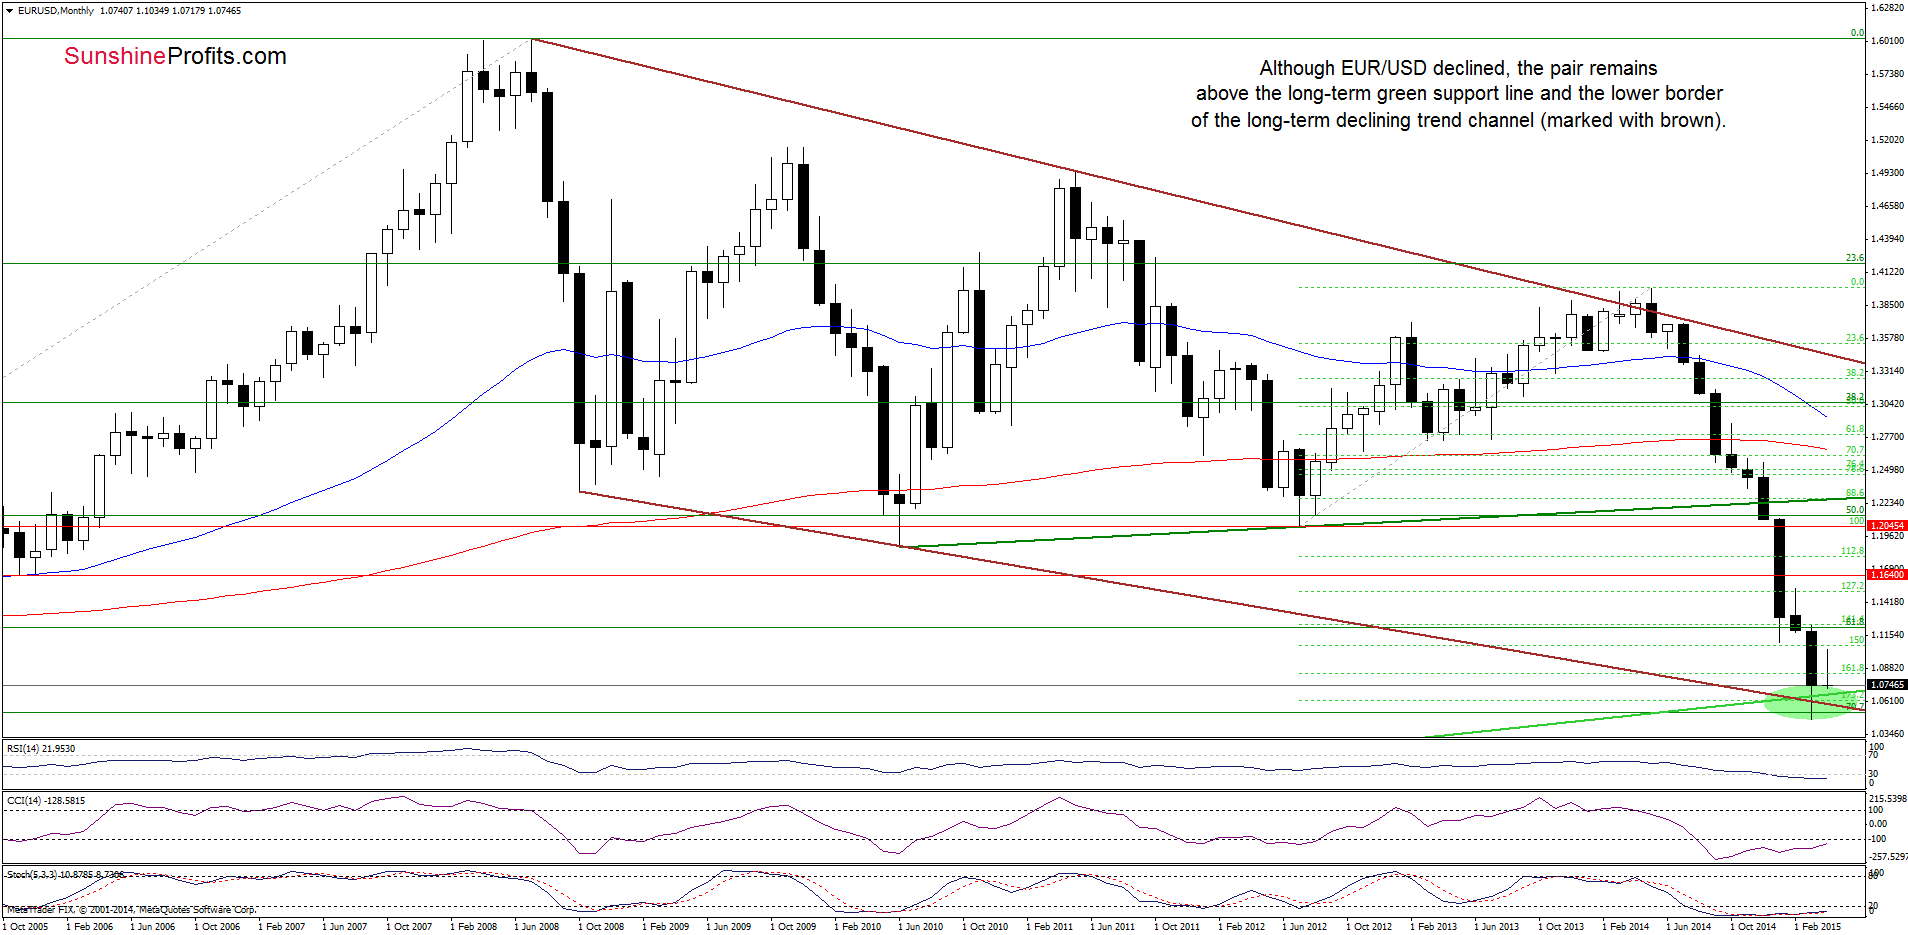
Although EUR/USD moved visibly lower, the exchange rate is still trading above the previously-broken long-term green support/resistance line and the lower border of the long-term declining trend channel, which together keep declines in check.
Will we see a test of these key support lines in the near future? Let’s examine the daily chart and look for more clues about future moves.
On Tuesday, we wrote the following:
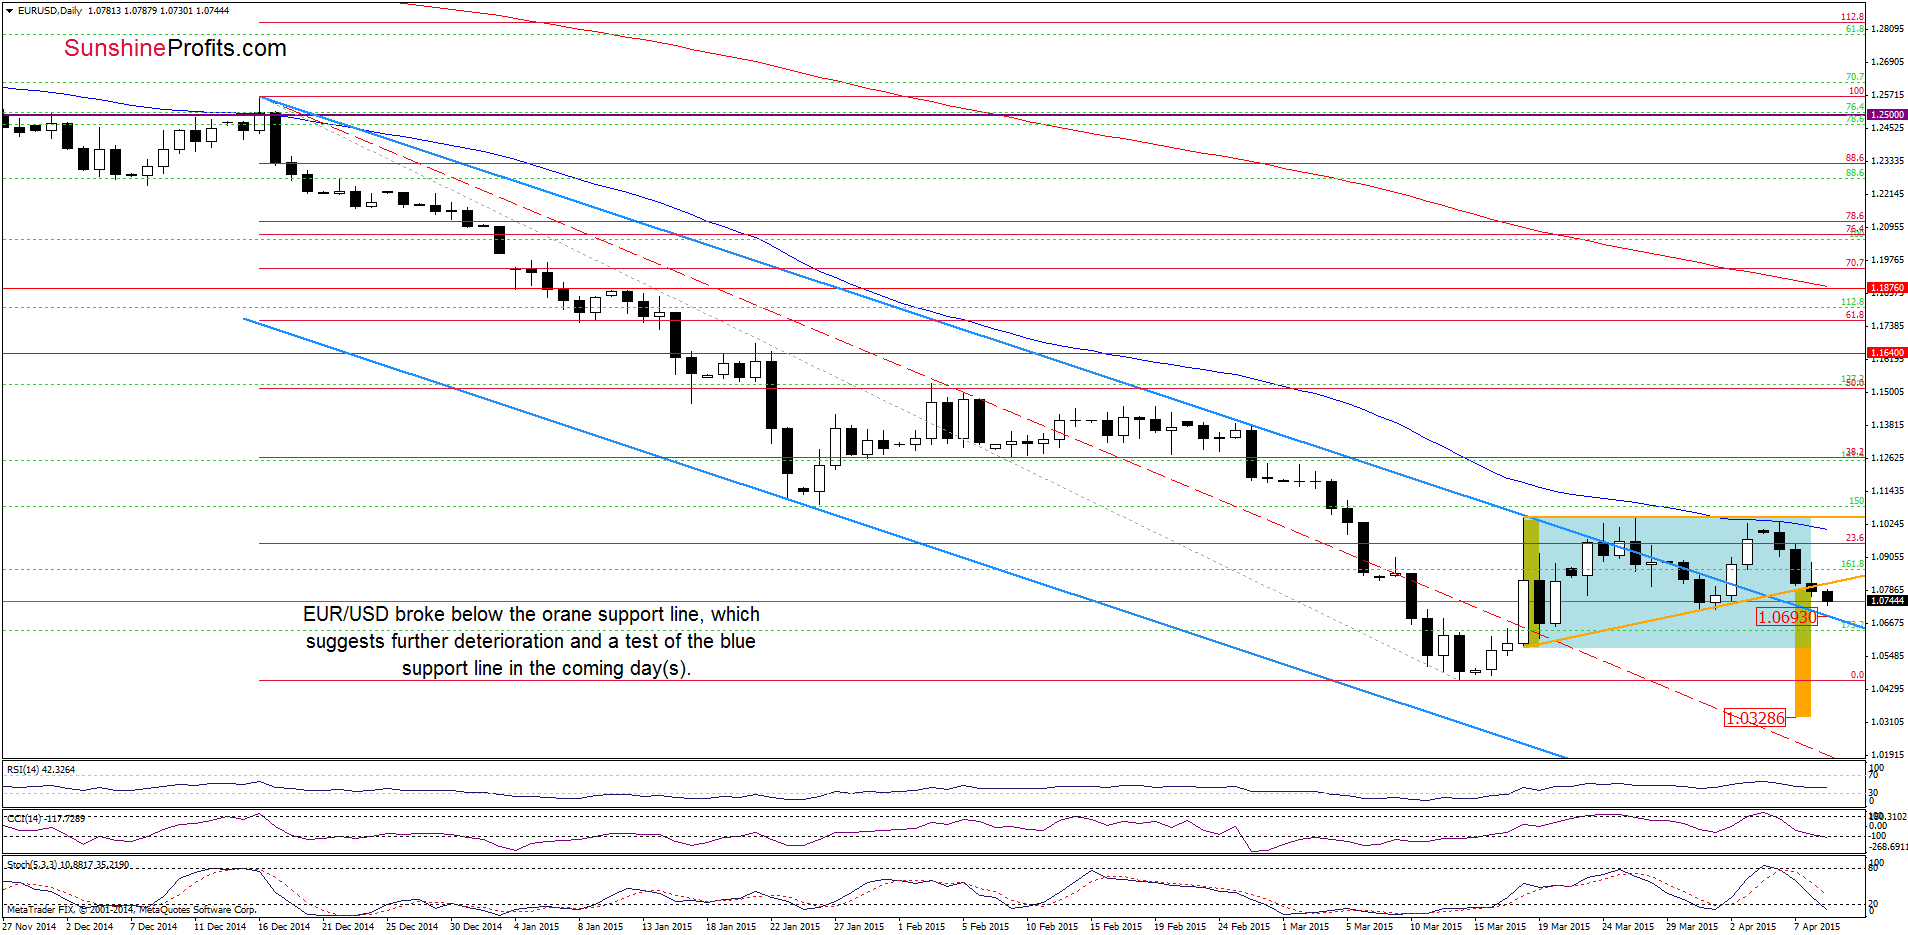
(…) taking into account sell signals generated by the indicators, it seems that lower values of the exchange rate are ahead us.
Looking at the above chart, we see that currency bears pushed the exchange rate lower as we expected. As a result, EUR/USD declined below the orange support line, which suggests further deterioration. How low could the pair go? We think that the best answer to this question will be our yesterday’s commentary:
(…) If this is the case, and the pair breaks below this key support line, we’ll see at least a test of the previously-broken upper border of the declining trend channel (…). If it is broken, the next target for currency bears would be the lower line of the consolidation at 1.0579 or even March lows.
Very short-term outlook: bearish
Short-term outlook: mixed
MT outlook: mixed
LT outlook: mixed
Trading position (short-term; our opinion): No positions are justified from the risk/reward perspective at the moment. We will keep you informed should anything change, or should we see a confirmation/invalidation of the above.
GBP/USD
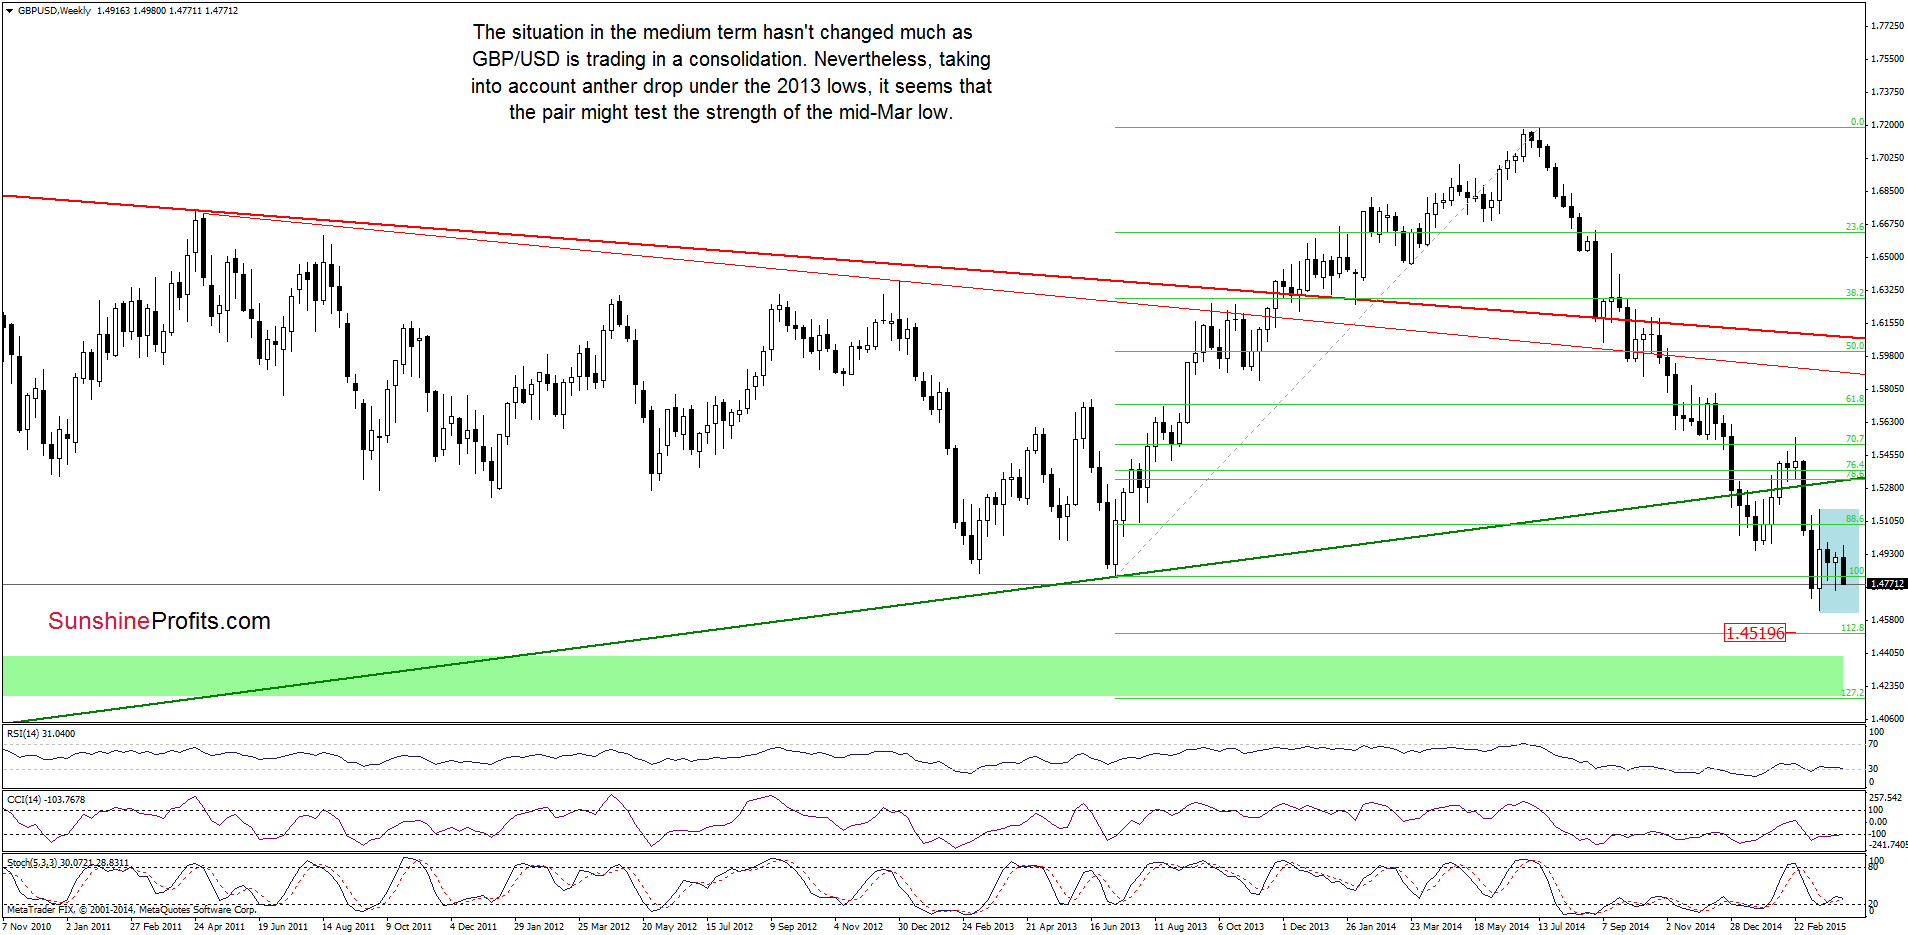
On the above chart, we see that although GBP/USD moved sharply lower, the medium-term picture hasn’t changed much as the pair is still trading in a consolidation (marked with blue). Nevertheless, taking into account te fact that the pair dropped under the 2013 lows once again, it seems that we could see further deterioration and a test of the mid-Mar low in the coming week(s).
Are there any short-term support levels that could hinder the realization of the above-mentioned scenario? Let’s check.
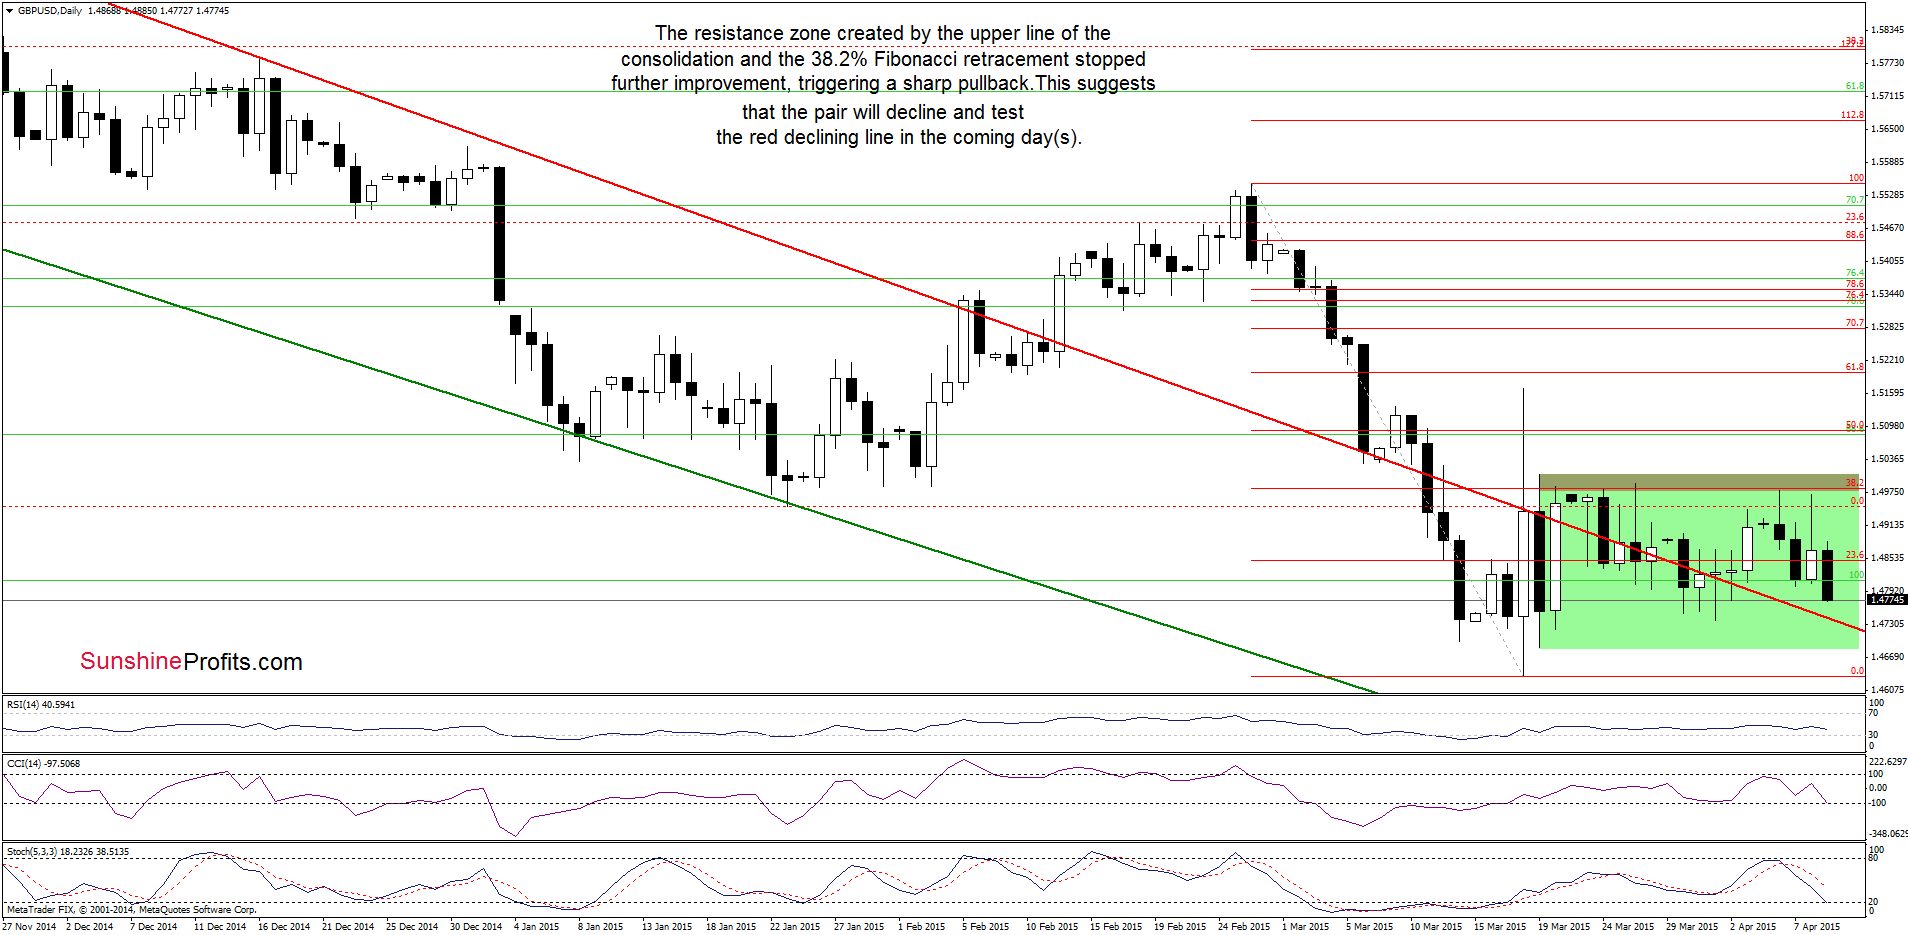
From this perspecive, we see that the resistance zone created by the upper line of the consolidation and the 38.2% Fibonacci retracement successfully stopped further improvement, triggering a sharp pullback. Taking this fact into account and combining it with the current position of the indicators (sell signals generated by the CCI and Stochastic Oscillator reain in place), it seems that the pair will extend declines and test the red declining line n the coming day(s). If it is broken, the pair will move lower and test the lower line of the consolidation or even the mid-Mar low (which is also the lower line of the consolidation marked on the weekly chart) in the near future.
Very short-term outlook: mixed with bearish bias
Short-term outlook: mixed
MT outlook: mixed
LT outlook: mixed
Trading position (short-term; our opinion): No positions are justified from the risk/reward perspective at the moment. We will keep you informed should anything change, or should we see a confirmation/invalidation of the above.
USD/JPY
The medium-term outlook remains mixed as USD/JPY is still trading in a consolidation (between the Dec high and low) around the 61.8% Fibonacci retracement level (based on the entire 1998-2011 declines). Today, we’ll focus on the daily chart and look for more clues about future moves.
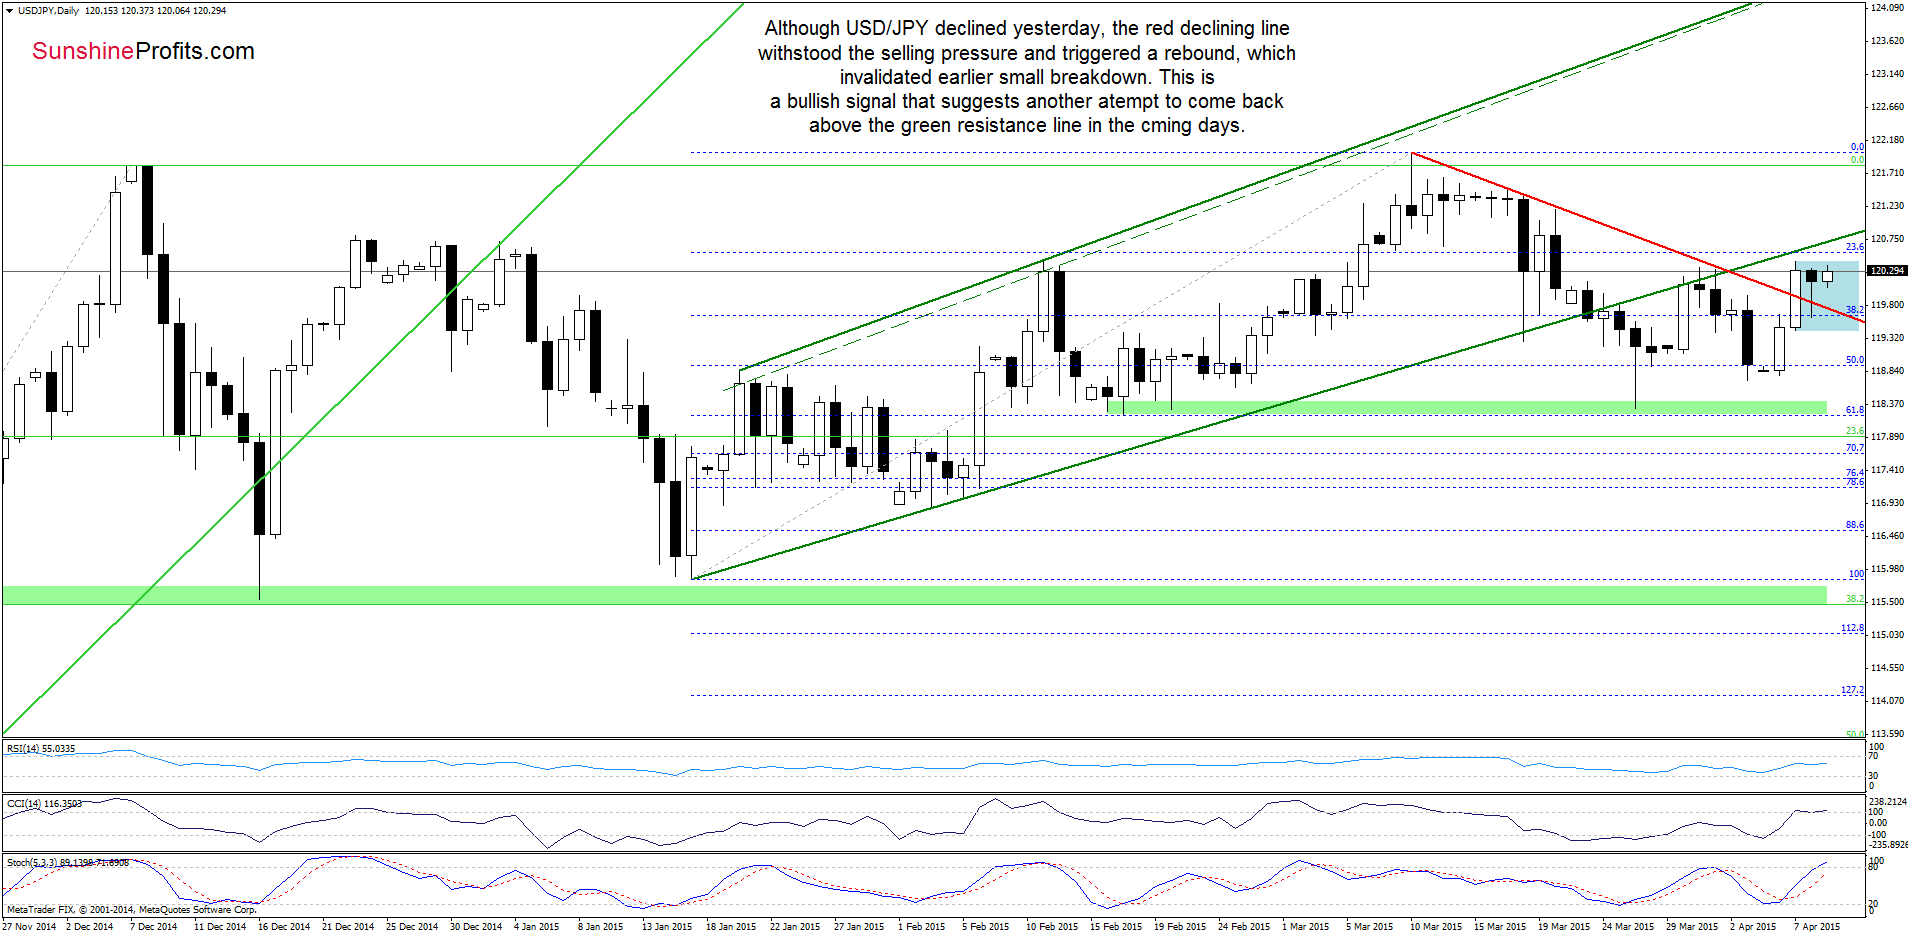
Although USD/JPY declined yesterday, the red declining line withstood the selling pressure and triggered a rebound, which invalidated earlier small breakdown under this line. This is a bullish signal, which suggests another attempt to come back above the green rising line n the coming days. This scenario is currently reinforced by the position of the indicators (buy signals generated by the CCI and Stochastic Oscillator remain in place, supporting the bullish case).
Very short-term outlook: bullish
Short-term outlook: mixed
MT outlook: mixed
LT outlook: bullish
Trading position (short-term; our opinion): No positions are justified from the risk/reward perspective at the moment. We will keep you informed should anything change, or should we see a confirmation/invalidation of the above.
Thank you.
Nadia Simmons
Forex & Oil Trading Strategist
Przemyslaw Radomski, CFA
Founder, Editor-in-chief
Gold & Silver Trading Alerts
Forex Trading Alerts
Oil Investment Updates
Oil Trading Alerts

