

The lack of major U.S. data later in the day in combination with the Federal Reserve's latest policy statement, which showed that interest rates will rise at a slower pace than market participants’ forecast, weighs on investors’ sentiment. As a result, the USD Index, which tracks the performance of the greenback against the basket of major currencies, extended losses and slipped below 99, erasing over 50% of yesterday’s rebound. How the recent price action in the index affected the short-term pictures of our six currency pairs?
In our opinion the following forex trading positions are justified - summary:
- EUR/USD: none
- GBP/USD: none
- USD/JPY: none
- USD/CAD: short (stop loss order at 1.2876)
- USD/CHF: none
- AUD/USD: none
EUR/USD
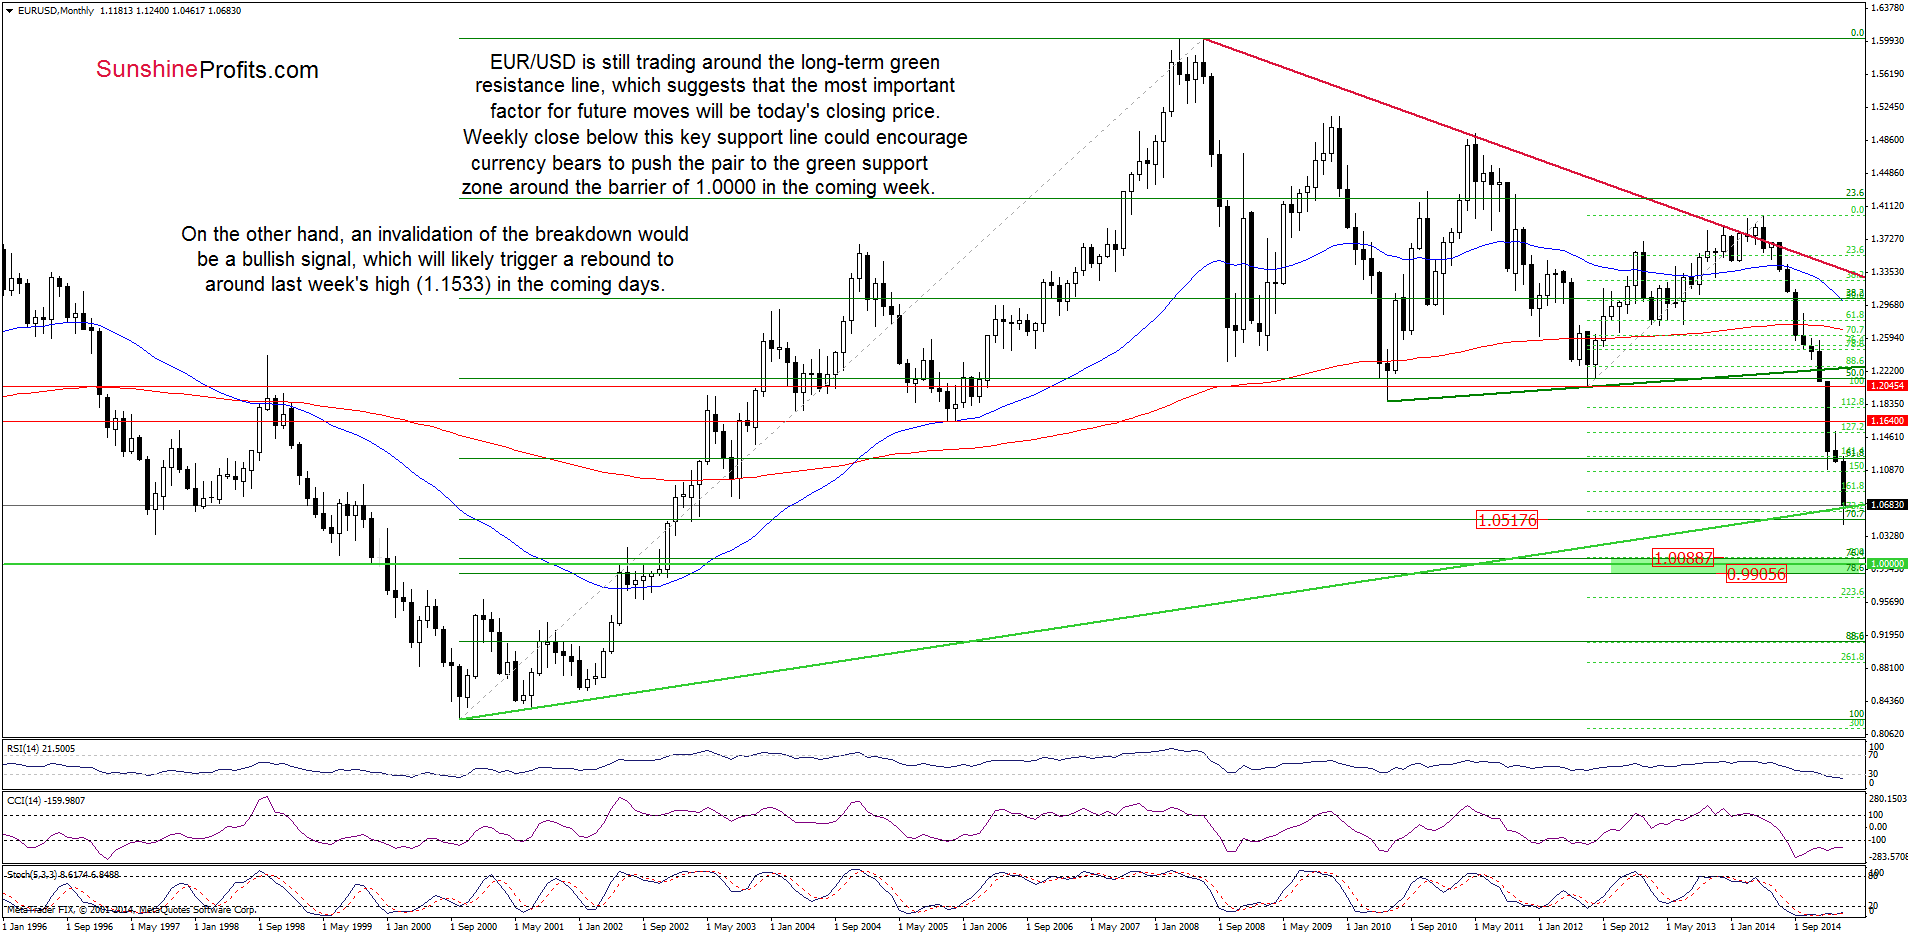
Looking at the weekly chart, we see that EUR/USD is still trading around the long-term green support/resistance line, which suggests that the most important factor for future moves will be today’s closing price. Weekly close below this key support line could encourage currency bears to push the pair even to the green support zone created by the 76.4% and 78.6% Fibonacci retracement levels and reinforced by the barrier of 1.0000. On the other hand, an invalidation of the breakdown would be a bullish signal, which will trigger further improvement and a rebound to around last week’s high (1.1533) in the coming days. Which scenario is more likely? When we take a closer look at the current position of the weekly indicator, we see that they are all oversold (additionally, there are positive divergences between the CCI, Stochastic Oscillator and the exchange rate), which suggests that a trend reversal (or at least a bigger corrective upward move) is just around the corner.
Having said that, let’s examine the daily chart and look for more clues about future moves.
Yesterday, we wrote the following:
(…) the exchange rate extended losses and came back to yesterday’s levels, slipping to the previously-broken declining support/resistance red line. In our opinion, if this line withstands the selling pressure, we’ll likely see a rebound from here and another attempt to break above the upper border of the trend channel. (…) we think that it’s worth to wait for today’s session close because it will give us more clues about future moves. If the pair closes the day above the red line, currency bulls will try to realize a pro-growth scenario. Otherwise, lower values of the exchange rate will be in play.
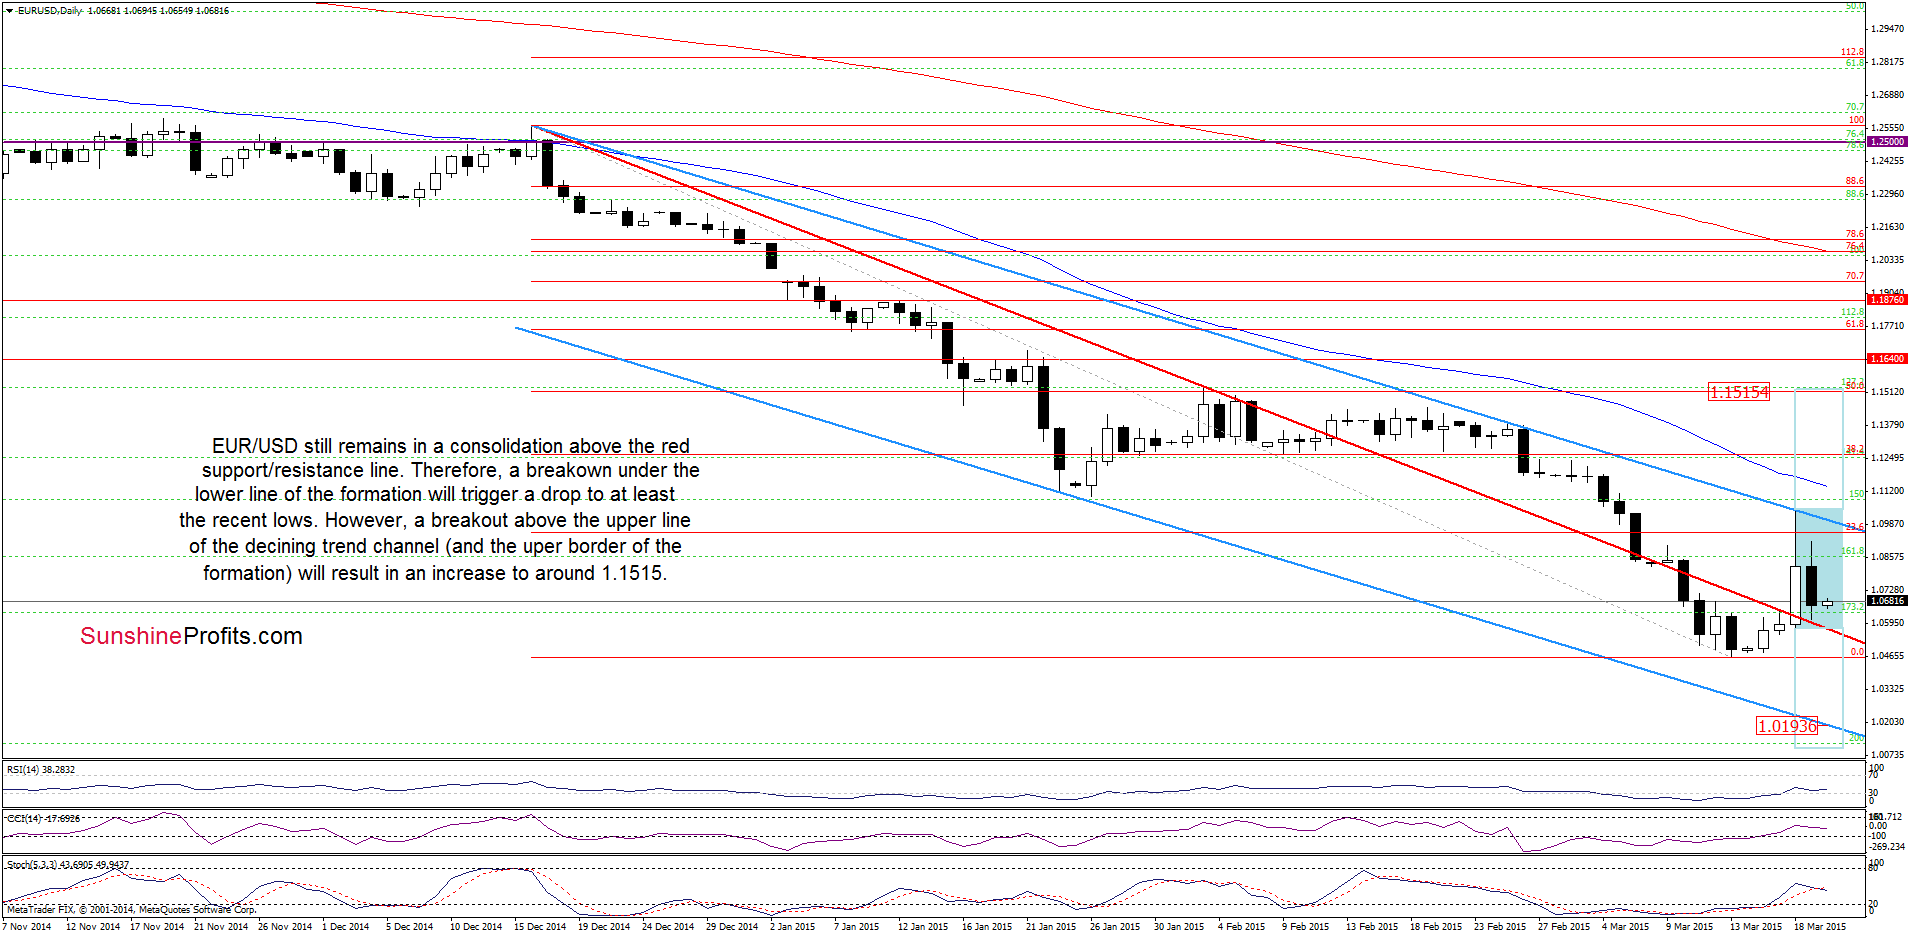
Looking at the daily chart, we see that currency bulls managed to hold the exchange rate above the declining support/resistance red line, which triggered a rebound earlier today. Despite this improvement, the pair is still trading in a consolidation (marked with blue). Therefore, a breakdown under the lower line of the formation will trigger a drop to at least the recent lows (nevertheless, if this area is broken, the next downside target would be around 1.0194, where the lower line of the declining trend channel is at the moment when these words are written). However, a breakout above the upper line of the trend channel (and the upper line of the formation) will result in an increase to around 1.1515, where the size of the upward move will correspond to the height of the consolidation (in this area there is also the 50% Fibonacci retracement level based on the entire Dec-Mar decline and the Feb highs). Taking into account the current position of the daily indicators (buy signals remain in place), it seems that another attempt to break above the upper border of the trend channel is more likely at the moment.
Very short-term outlook: mixed
Short-term outlook: mixed
MT outlook: mixed
LT outlook: mixed
Trading position (short-term; our opinion): No positions are justified from the risk/reward perspective at the moment. We will keep you informed should anything change, or should we see a confirmation/invalidation of the above.
GBP/USD
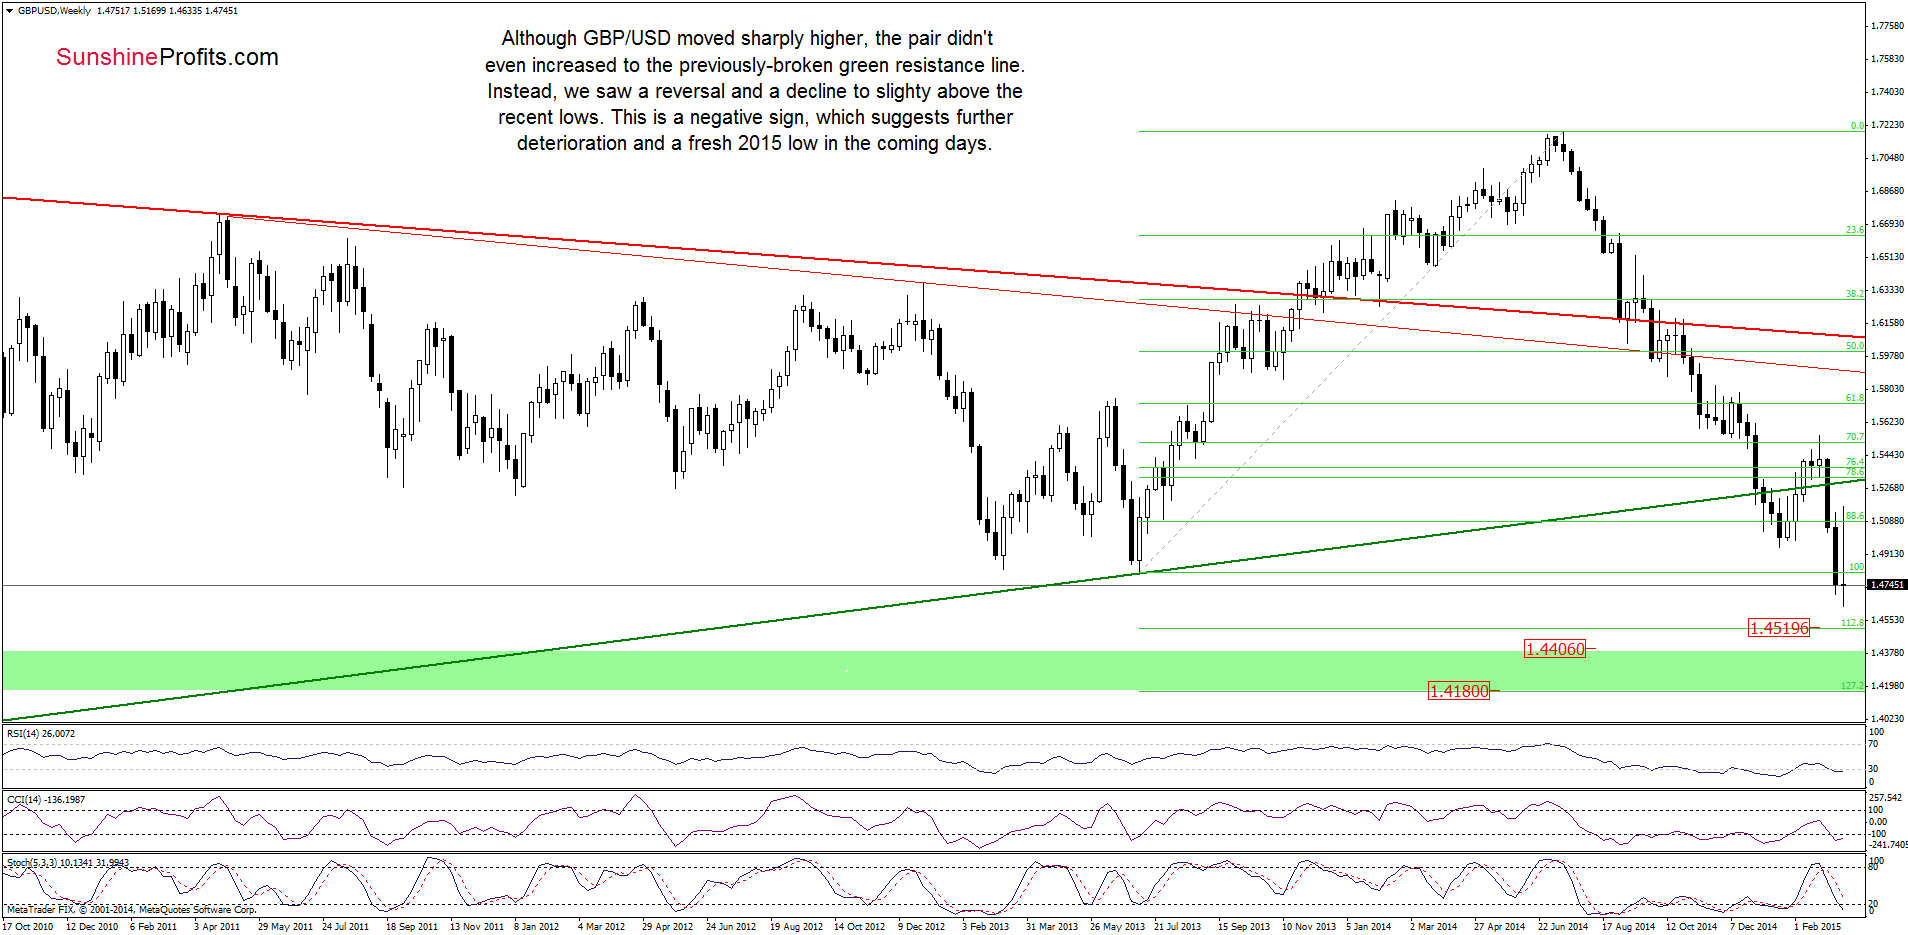
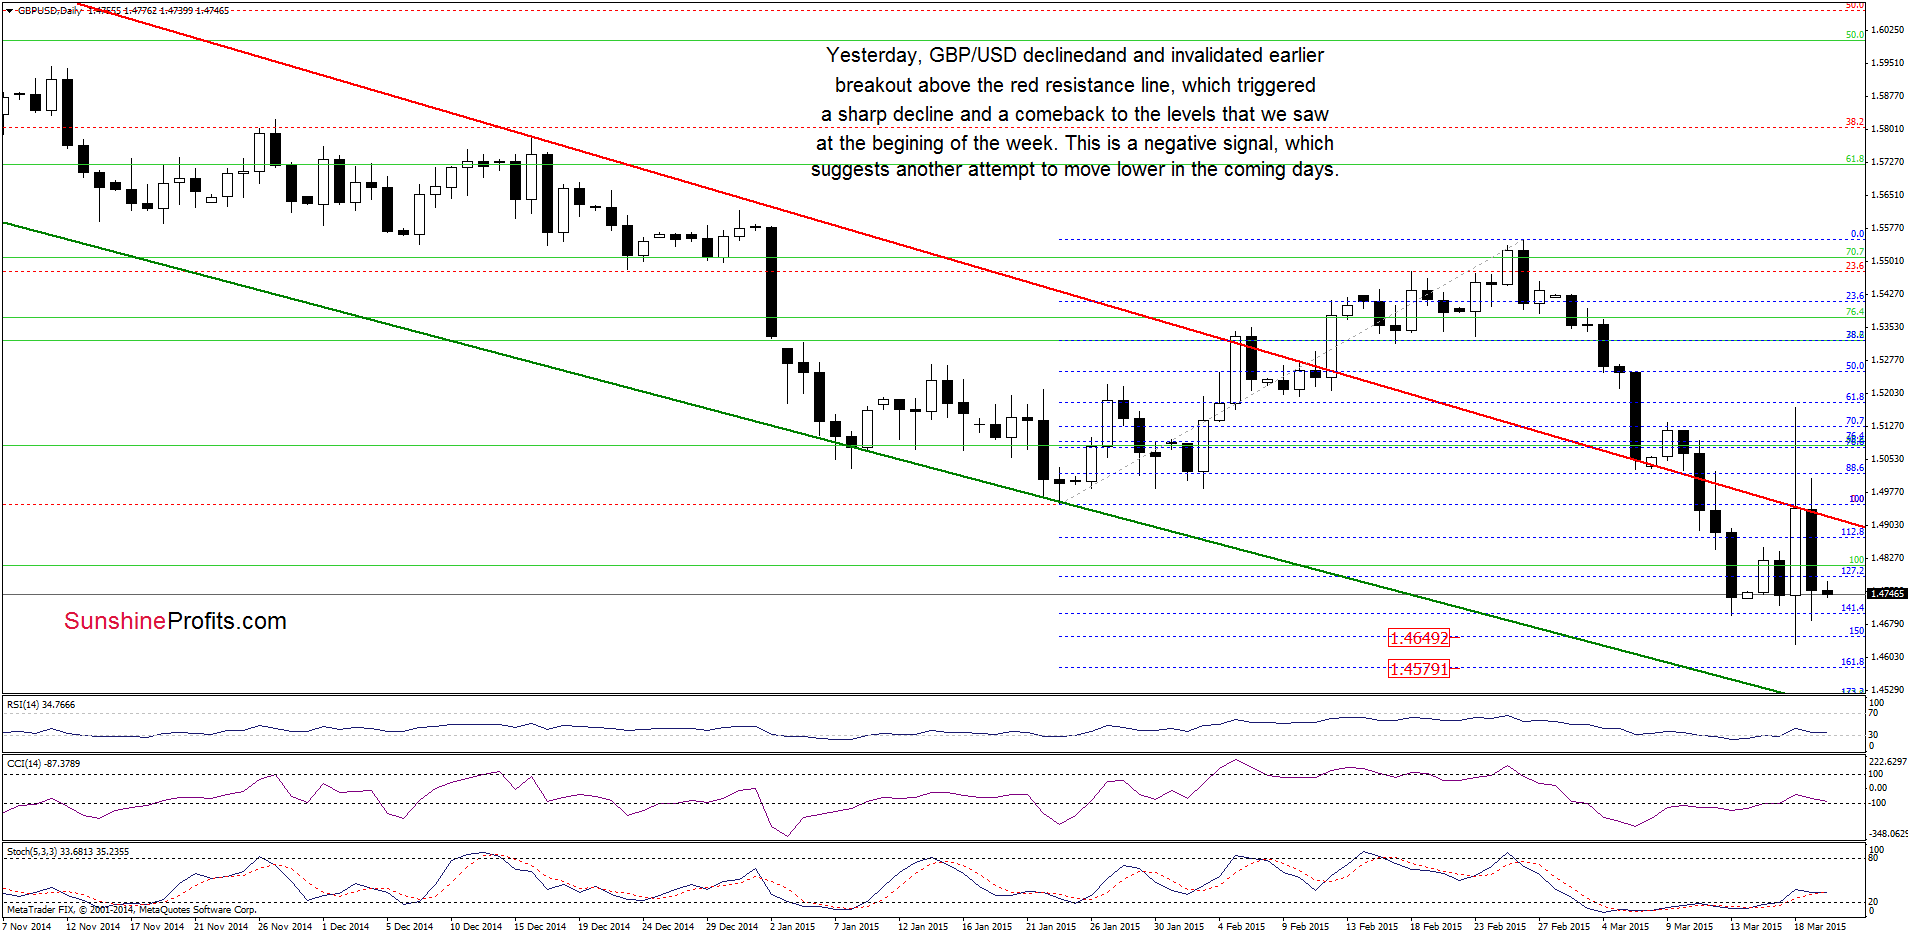
Yesterday, GPB/USD declined and invalidated earlier breaktu above the red resistance line, which triggered a sharp decline and a comeback to the levels that we saw at the beginning of the week. This is a negative signal, which suggests another attempt to move lower in the coming days. If this is the case, the initial downside targt would be Wednesday’s low and the 150% Fibonacci extension. If it is broken, we might see a decline to 1.4579 (161.8% extension). Nevertheless, taking into account the medium-term picture, it seems that GBP/USD could drop even to around 1.4180-1.4406, where the green support zone (marked on the weekly chart) created by the 2010 lows and the 127.2% Fibonacci extension (based on the entire 2013-2014 rally) is.
Before we move on to the next currency pair, we’ll also consider a bullish scenario as buy signals generated by the daily indicator remain in place. Please note that the key factor for future moves will be a breakout (or the lack of such price action) above the red resistance line. If currency bulls manage to push the pair above it, this would be a solid positive sign, which will likely trigger further improvement and an increase to at least Wednesday’s high of 1.5170 (or even to the 61.8% Fibonacci retracement based on the Feb-Mar declie at 1.5200) in the coming days. However, if they fail, GBP/USD will reverse and we’ll likely see a realization of the above-mentioned bearish scenario.
Very short-term outlook: mixed
Short-term outlook: mixed
MT outlook: mixed
LT outlook: mixed
Trading position (short-term; our opinion): No positions are justified from the risk/reward perspective at the moment. We will keep you informed should anything change, or should we see a confirmation/invalidation of the above.
USD/JPY
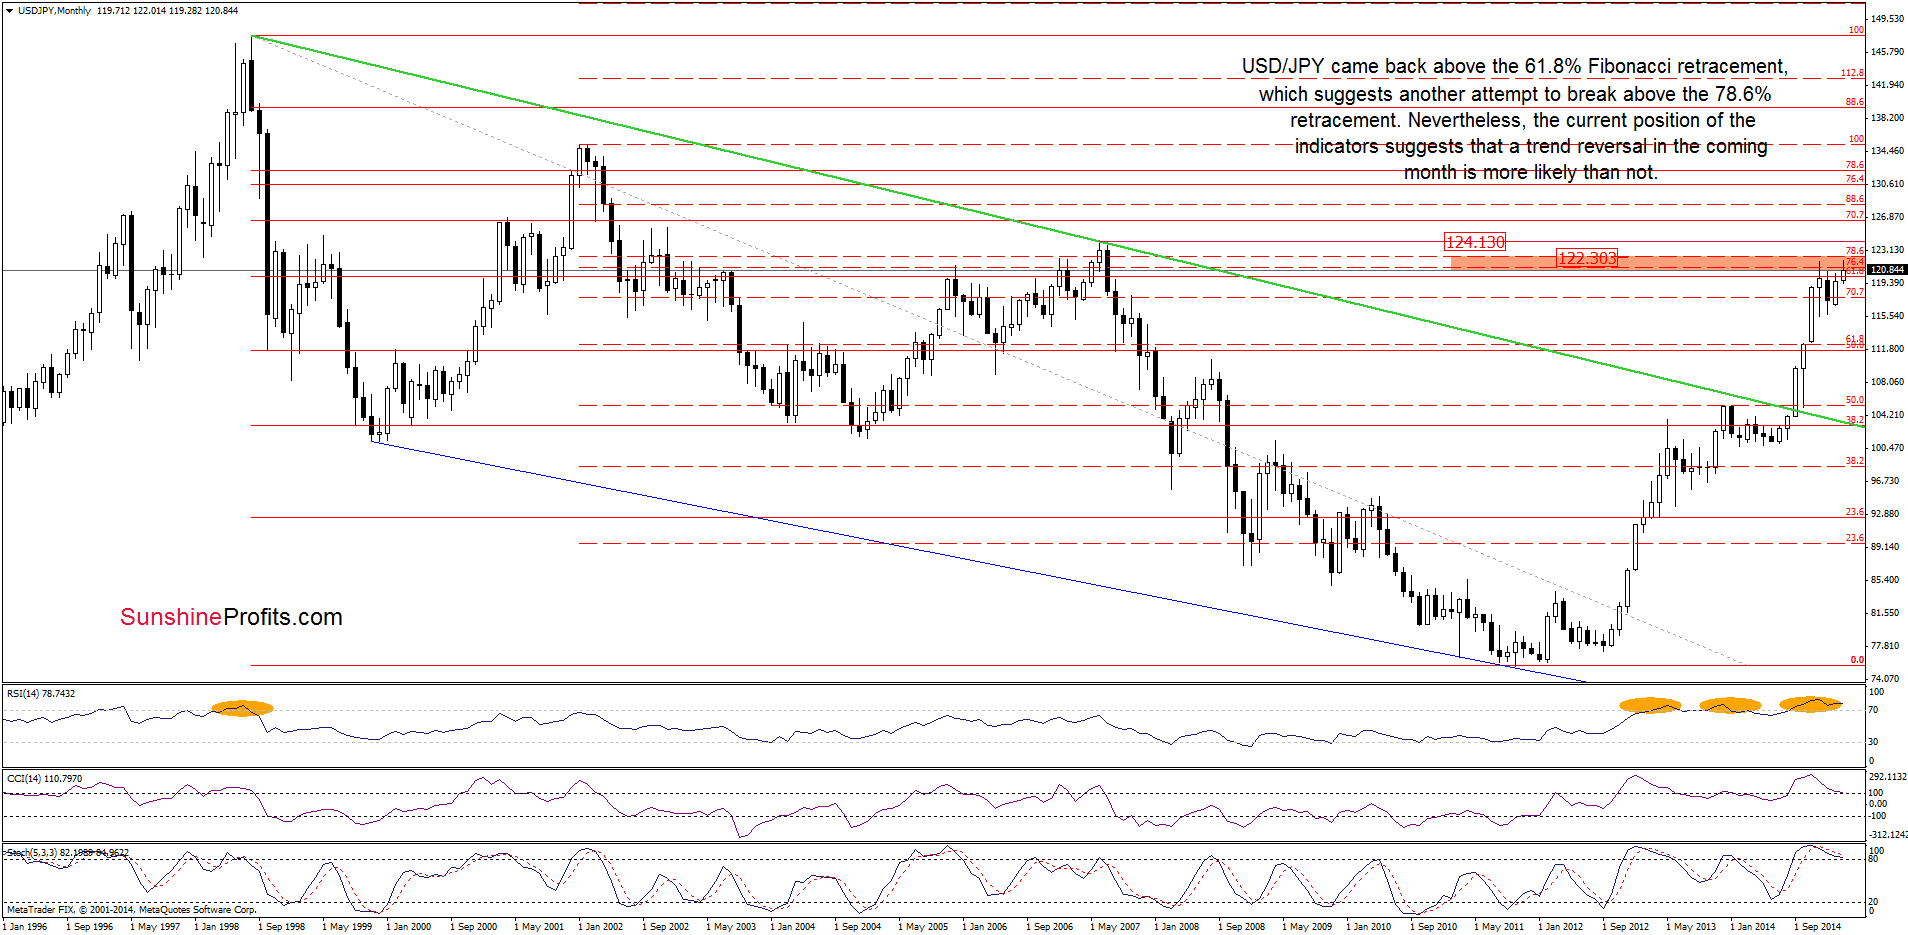
On the above chart, we see that USD/JPY came back above the 61.8% Fibonacci retracement level (based on the entire 1998-2011 declines), which suggests another attempt to break above the 78.6% retracement at 122.30. Nevertheless, the current position of the indicators suggests that a trend reversal in March is more likely than not.
Having said that, let’s examine the daily chart.
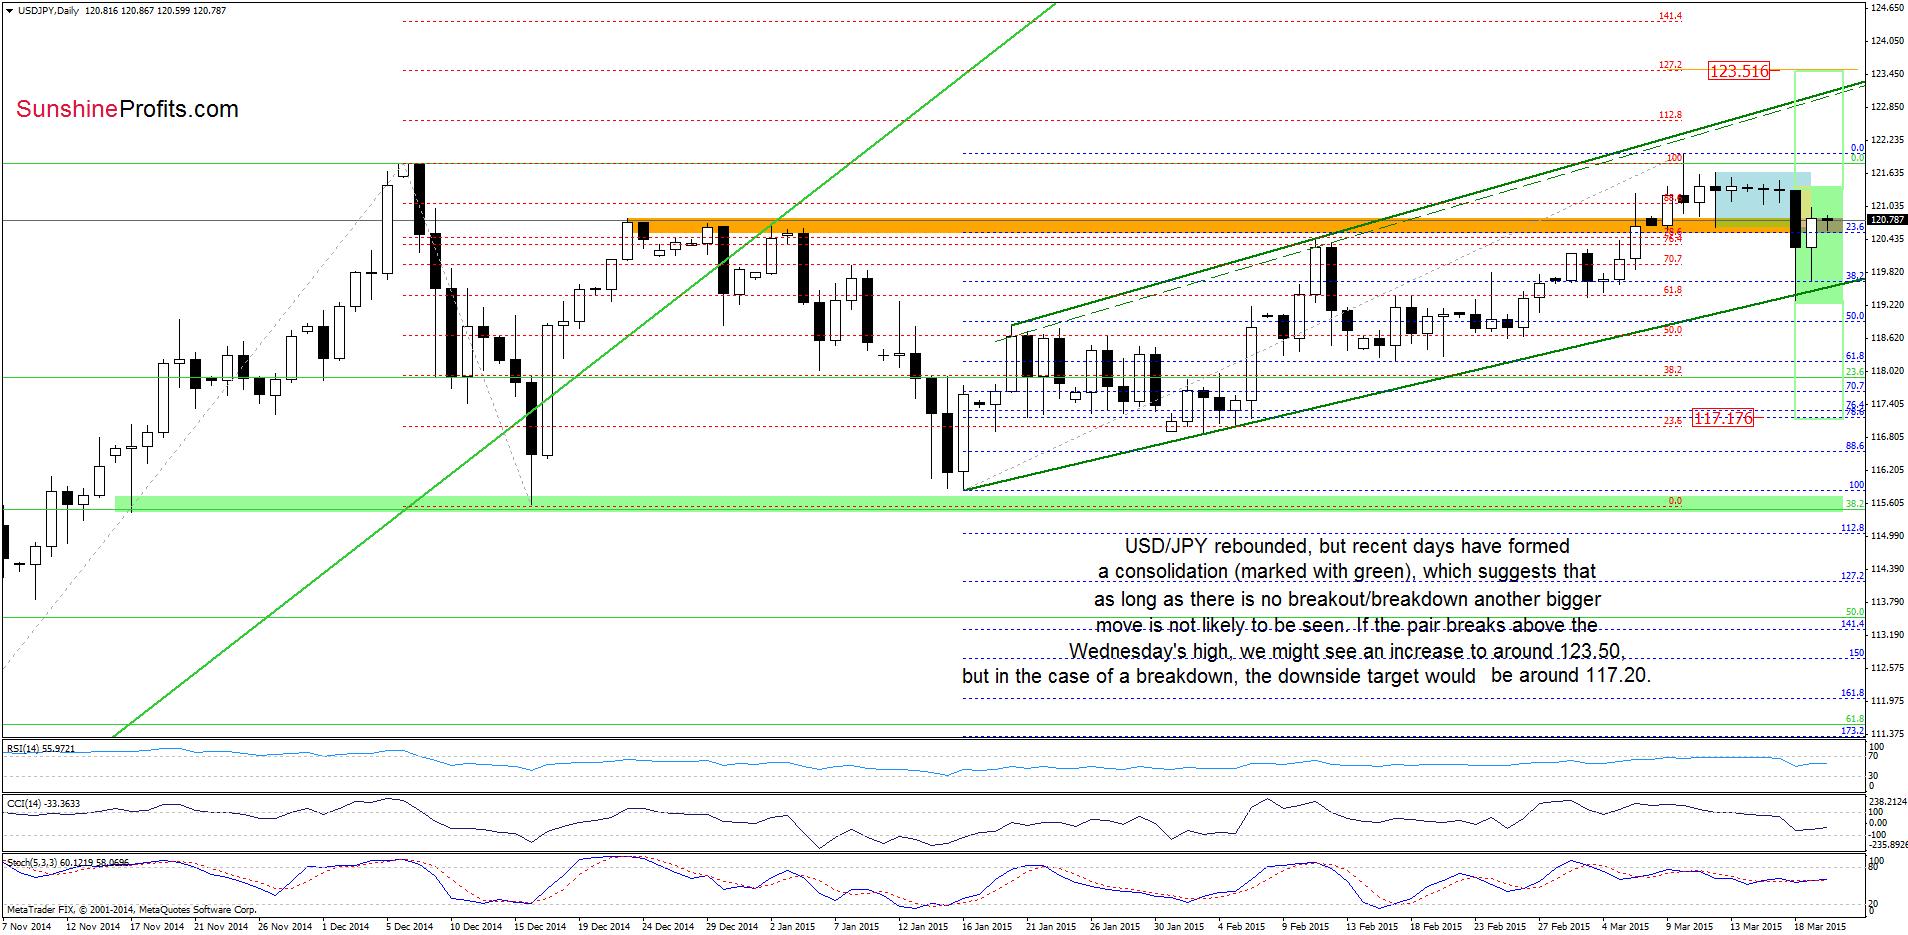
On Thursday, USD/JPY rebounded, but the recent days have formed a consolidation (marked with green) on the above chart. This suggests that as long as there is no breakout or breakdown another bigger move is not likely to be seen. What is the bullish scenario? If the pair breaks above the Wednesday’s high, we might see an increase even to around 123.50, where the size of the upward move will correspond to the height of the formation and where the upper line of the rising trend channel is. At this point, it’s worth noting that before currency bulls realize this scenario they will have to break above the medium-term resistances marked on the chart. What could happen if currency bears show their claws once again? In our opinion, if USD/JPY moves lower and breaks under the green support line (and then below the lower line of the consolidation), it would be a strong negative signal, which will likely trigger a decline to around 117.20, where the size of the downward move will correspond to the height of the consolidation and where the support zone (created by the 76.4% and 78.6% Fibonacci retracement levels) are. Please note that sell signals generated by the indicators remain in place, supporting currency bears at the moment, which suggests an attempt to move below the orange support zone in the coming day.
Very short-term outlook: mixed
Short-term outlook: mixed
MT outlook: mixed
LT outlook: bullish
Trading position (short-term; our opinion): No positions are justified from the risk/reward perspective at the moment. We will keep you informed should anything change, or should we see a confirmation/invalidation of the above.
USD/CAD
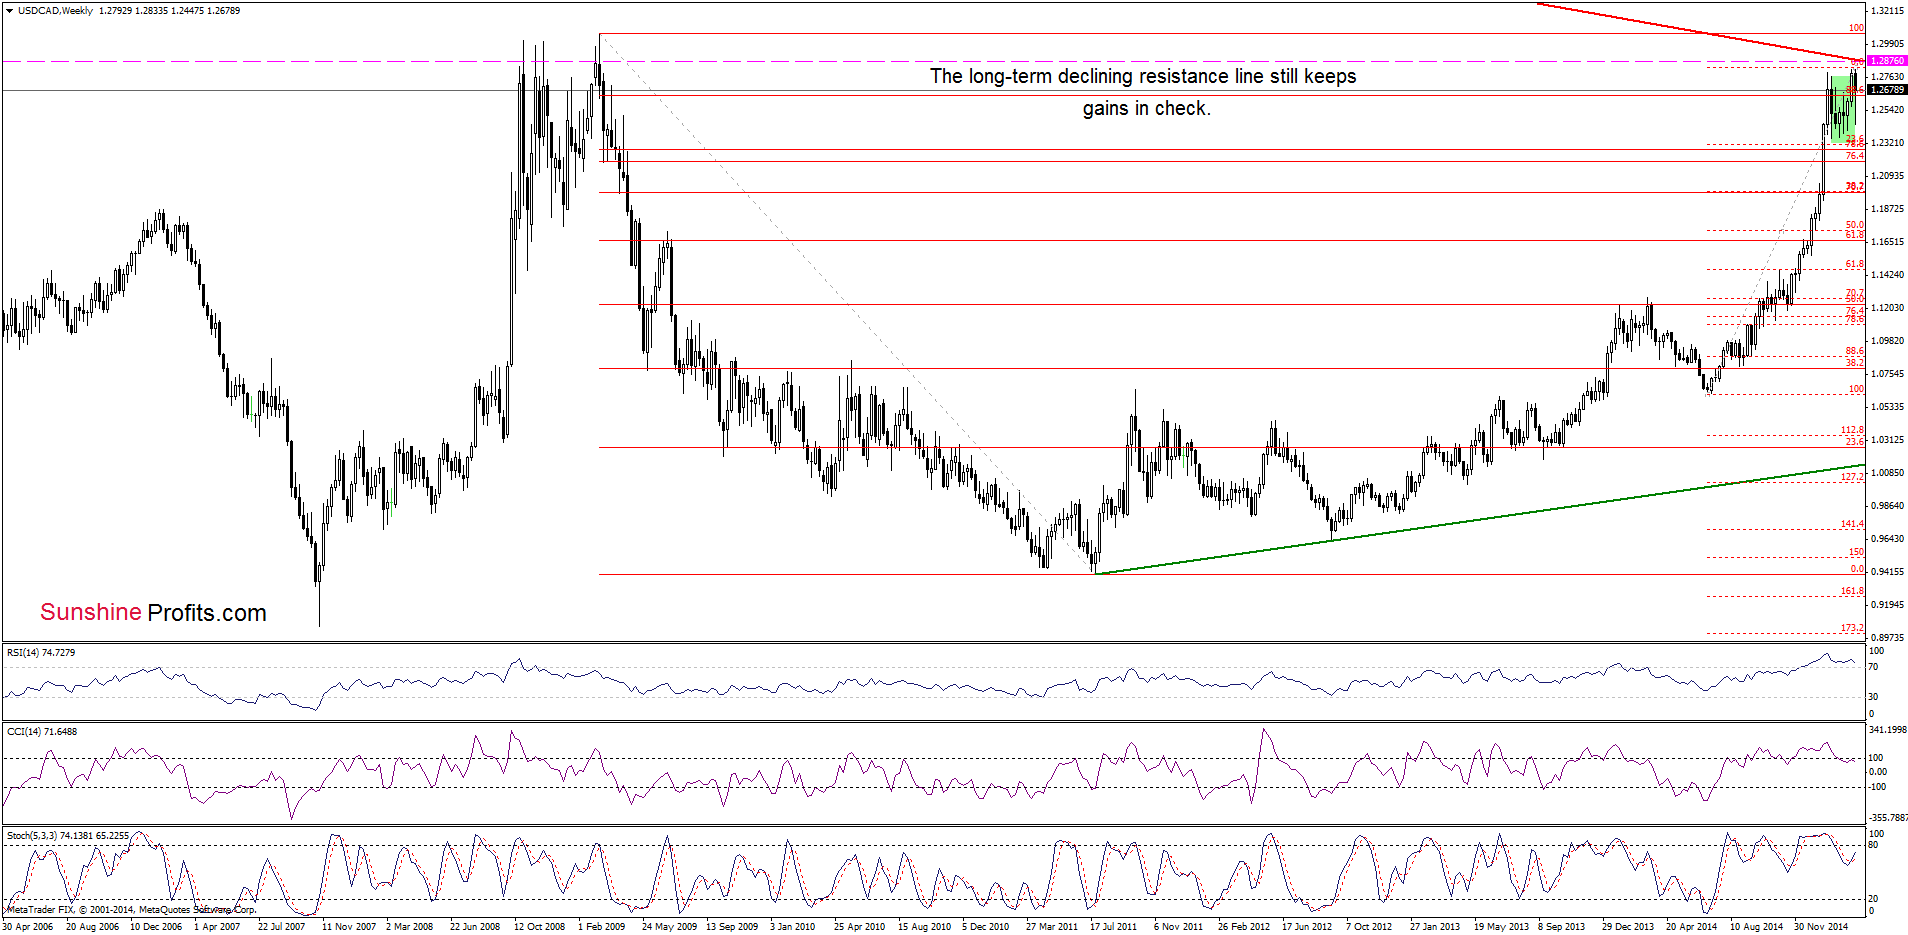
As you see on the weekly chart, the situation in the medium term hasn’t changed much as USD/CAD is still trading under the long-term red declining resistance line, which keeps gains in check. In the previous weeks, the proximity to this key resistance was enough to trigger a correction. Therefore, we think that as long as there is no breakout above this line, the probability of a reversal is high.
Are there any short-term factors that could support or hinder the realization of the above scenario? Let’s check.
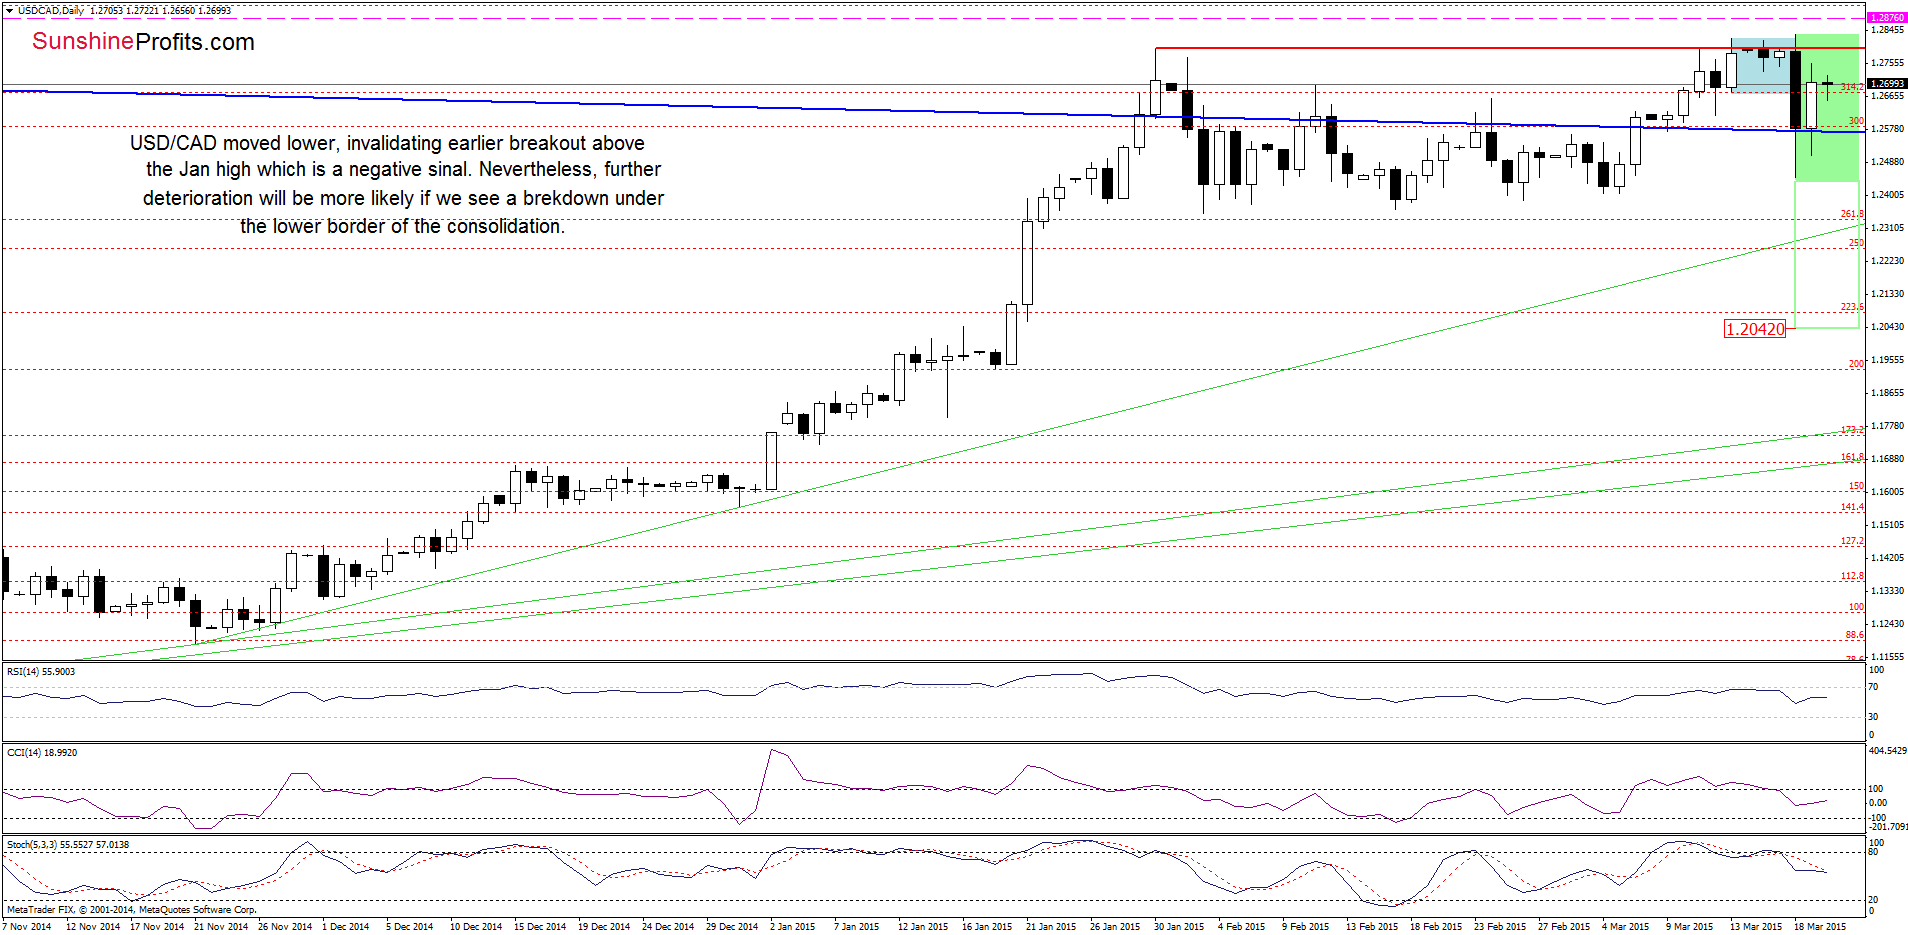
As you see on the daily chart, USD/CAD declined sharply on Wednesday, invalidating earlier breakout above the Jan high. Although the pair rebounded yesterday, the exchange rate is still trading under the recent highs. Taking this negative signal into account, and combining it with sell signals generated by the indicators, we think that another test of the blue support line is more likely than not. If it withstands the selling pressure, we might see another rebound to the recent highs (or even the long-term resistance line marked on the weekly chart). However, if t is broken, the initial downside target would be around 1.2350-1.2386, where the recent lows are. Please note that such drop will also imply a breakdown under the lower order of the consolidation (marked with green). When we take this fact into account, the correction of the recent rally could reach the green support zone based on the Nov 21 and Dec 31 lows, or even the level of 1.2042, where the size of the downward move will correspond to the height of the consolidation.
Very short-term outlook: bearish
Short-term outlook: mixed with bearish bias
MT outlook: mixed
LT outlook: mixed
Trading position (short-term; our opinion): Short positions with a stop loss order at 1.2876 are justified from the risk/reward perspective. We will keep you informed should anything change, or should we see a confirmation/invalidation of the above.
USD/CHF
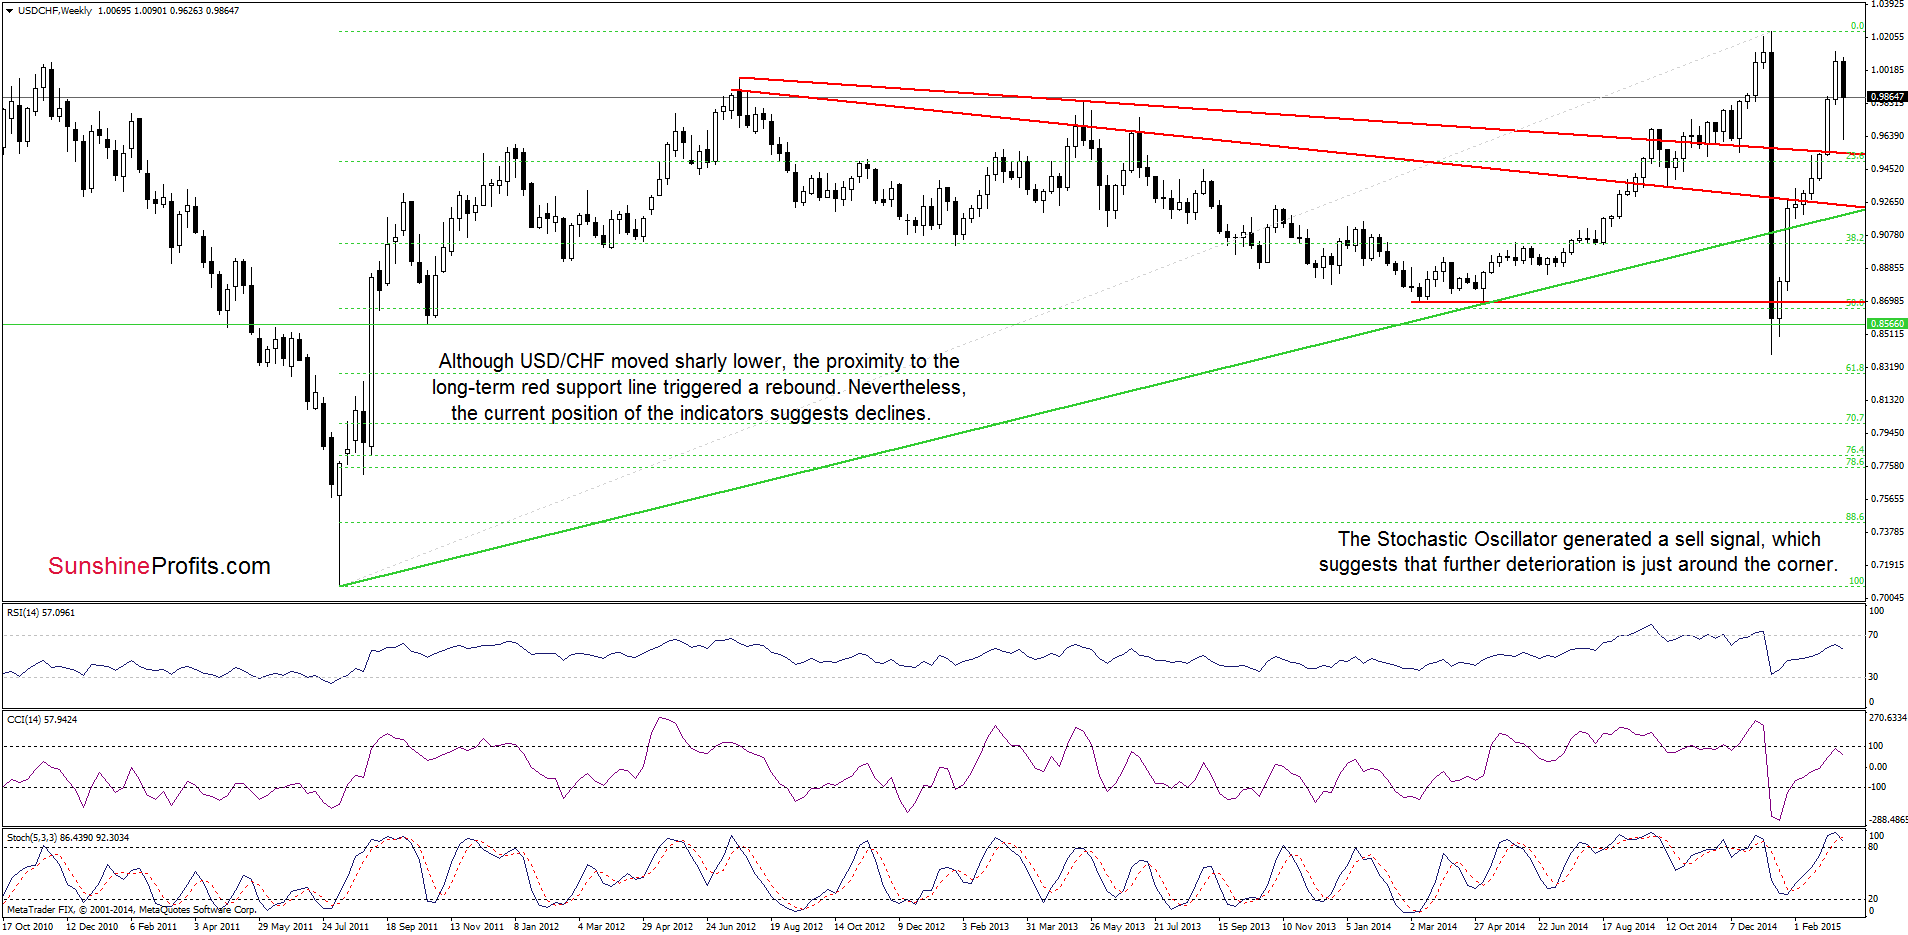
Although USD/CHF moved sharply lower earlier this week, the proximity to the long-term red support line triggered a rebound. Nevertheless, we should keep in mind that the Stochastic Oscillator generated a sell signal, which suggests that the probability of a correction in the coming week increased.
Having said that, let’s check what we can infer from the daily chart.
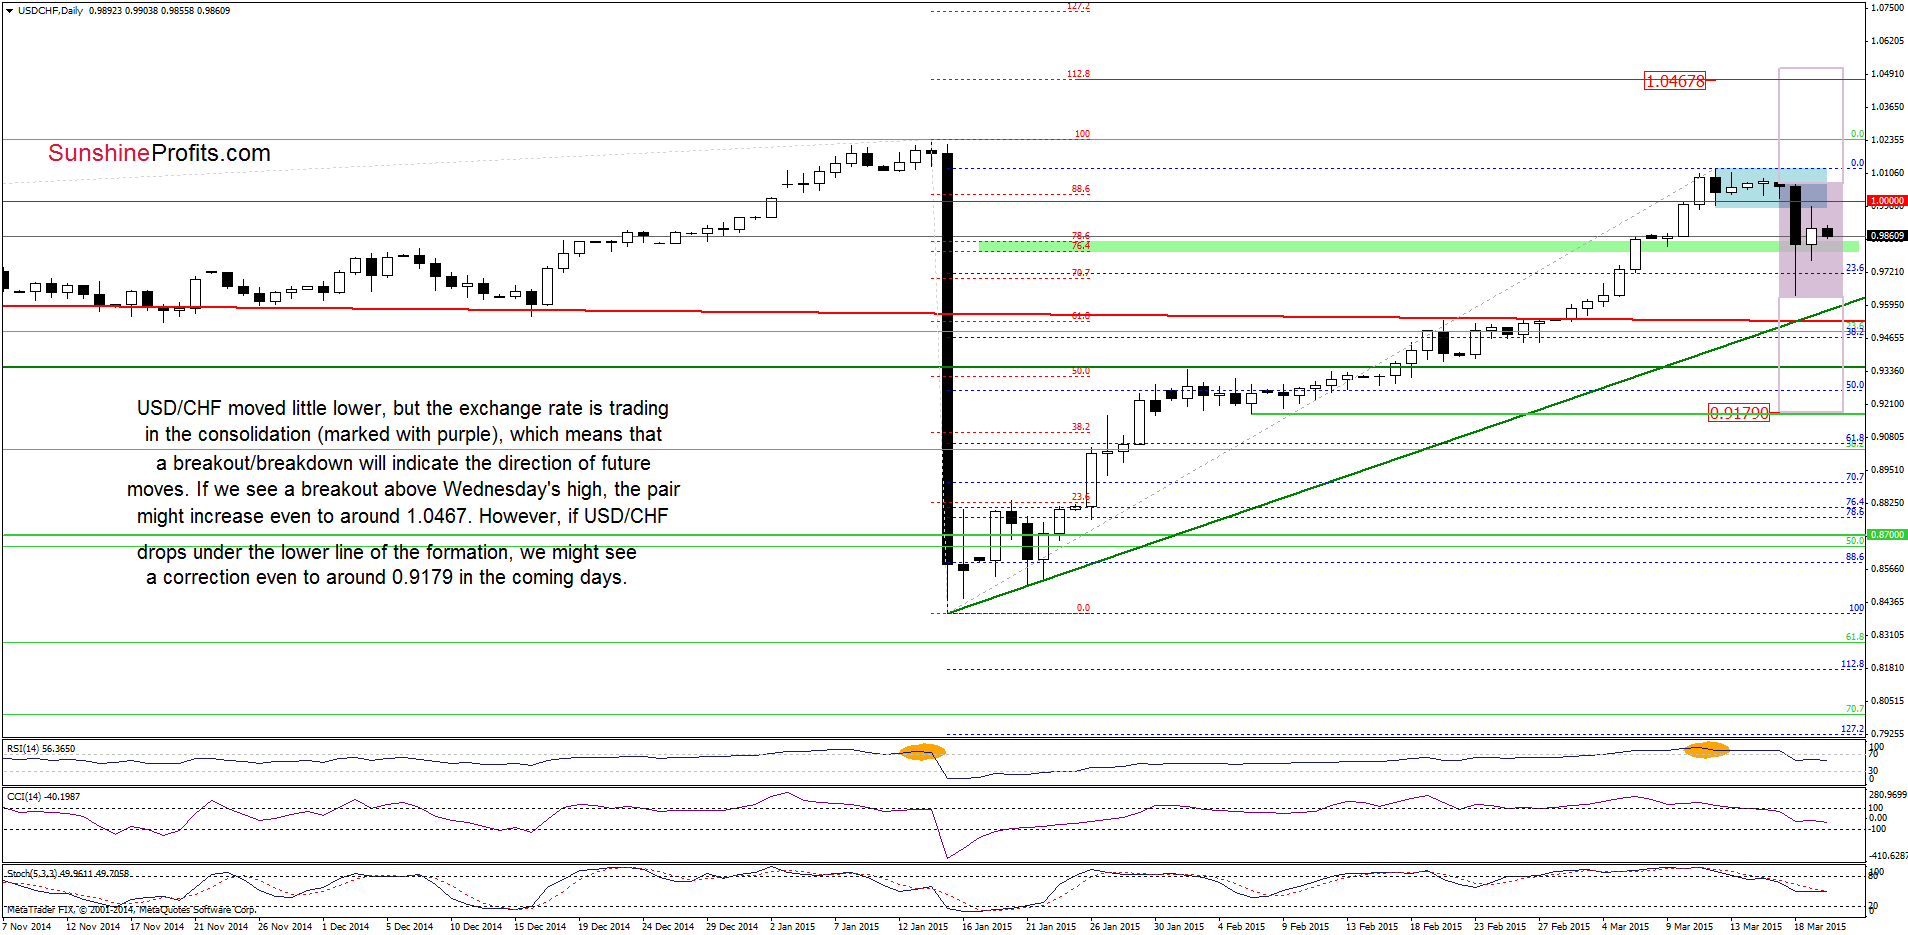
On the above chart we see that USD/CHF moved little lower once again, but the exchange rate is trading in the consolidation (marked with purple), which means that a breakout/breakdown will indicate the direction of future moves. What is the bullish scenario? If USD/CHF breaks above the Wednesday’s high of 1.0067, the pair might increase even to around 1.0467, where the 112.8% Fibonacci extension (based on the entire Jan decline) is. Nevertheless, taking into account the current position of the indicators, and the medium-term picture, it seems to us that the next move will be to the downside. At this point, it is also worth mentioning that the RSI generated a sell signal, which is a bearish signal. The reason? When we take a closer look at the daily chart, we see that we saw such price action in Jan. Back then, similar signal preceded one of the sharpest declines in forex market. Therefore, we think that further correction of the recent rally is more likely than not. If this is the case, USD/CHF will test the strength of the green support line based on the Jan lows. If it s broken (and additionally we’ll see a breakdown under the lower line of the consolidation), the next target for currency bears would be around the previously-broken long-term support line or even the level of 0.9180, where the size of the downward move will correspond to the height of the consolidation.
Very short-term outlook: mixed with bearish bias
Short-term outlook: mixed
MT outlook: mixed
LT outlook: bearish
Trading position (short-term; our opinion): No positions are justified from the risk/reward perspective at the moment. We will keep you informed should anything change, or should we see a confirmation/invalidation of the above.
AUD/USD
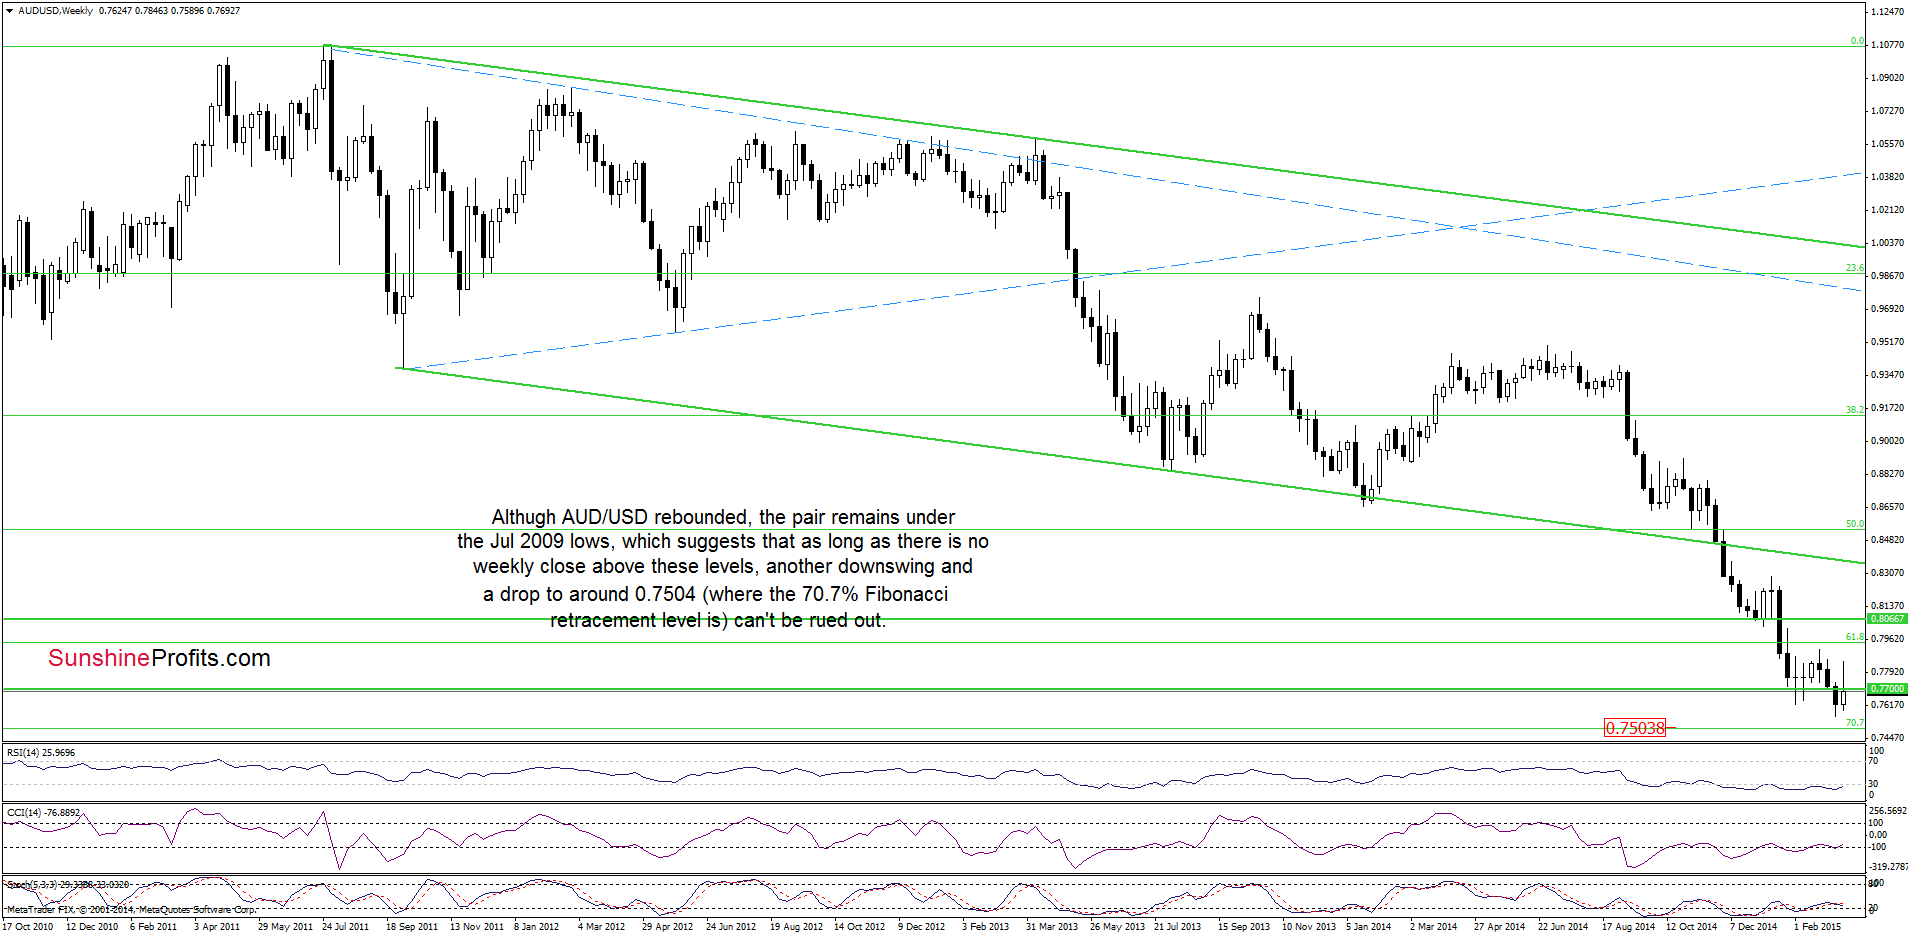
Although AUD/USD rebounded, the pair remains under the Jul 2009 lows, which suggests that as long as there is no weekly close above these levels another downswing and a drop even to 0.7504 (where the 70.7% Fibonacci retracement is) can’t be ruled out.
Having said that, let’s focus on the very short-term changes.
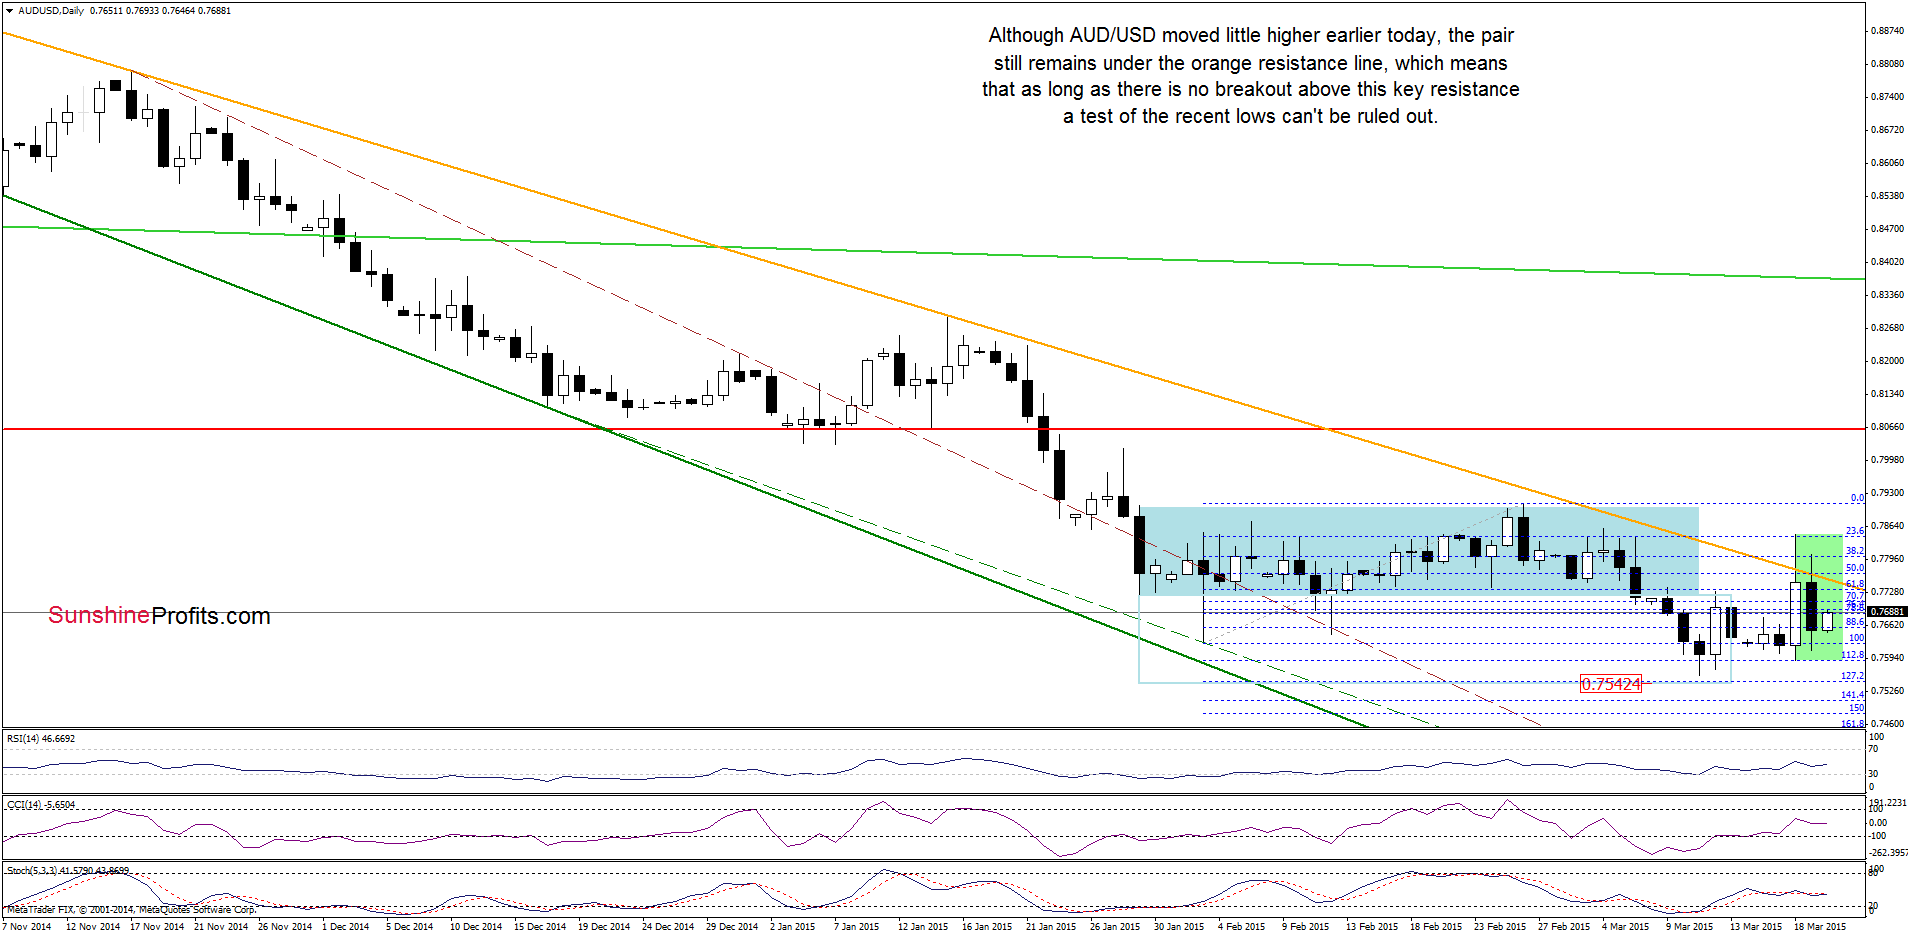
Although AUD/USD increased slightly earlier today, the pair still remains under the declining orange line, whch means that as long as there is no breakout above this key resistance line a test of the recent lows is likely. Please note that if these levels are broken, the initial downside target for currency bears would be around 0.7542, where the 127.2% Fibonacci extension is.
Before we finish today’s Forex Trading Alert, we consider also the bullish scenario as buy signals generated by the indicators remain in place. In our opinion, if AUD/USD breaks above its key resistance line, we’ll see an increase to at least Wednesday’s high of 0.7846. If this resistance is broken, the next upside target would be the Feb 26 high of 0.7911 or even the Jan lows around 0.8033.
Very short-term outlook: mixed
Short-term outlook: mixed
MT outlook: mixed
LT outlook: mixed
Trading position (short-term; our opinion): No positions are justified from the risk/reward perspective at the moment. We will keep you informed should anything change, or should we see a confirmation/invalidation of the above.
On an administrative note, please note that there will be no Forex Trading Alerts next week, but the alerts will be posted normally the week after (beginning Monday, March 30). Thank you for your understanding.
Thank you.
Nadia Simmons
Forex & Oil Trading Strategist
Przemyslaw Radomski, CFA
Founder, Editor-in-chief
Gold & Silver Trading Alerts
Forex Trading Alerts
Oil Investment Updates
Oil Trading Alerts

