

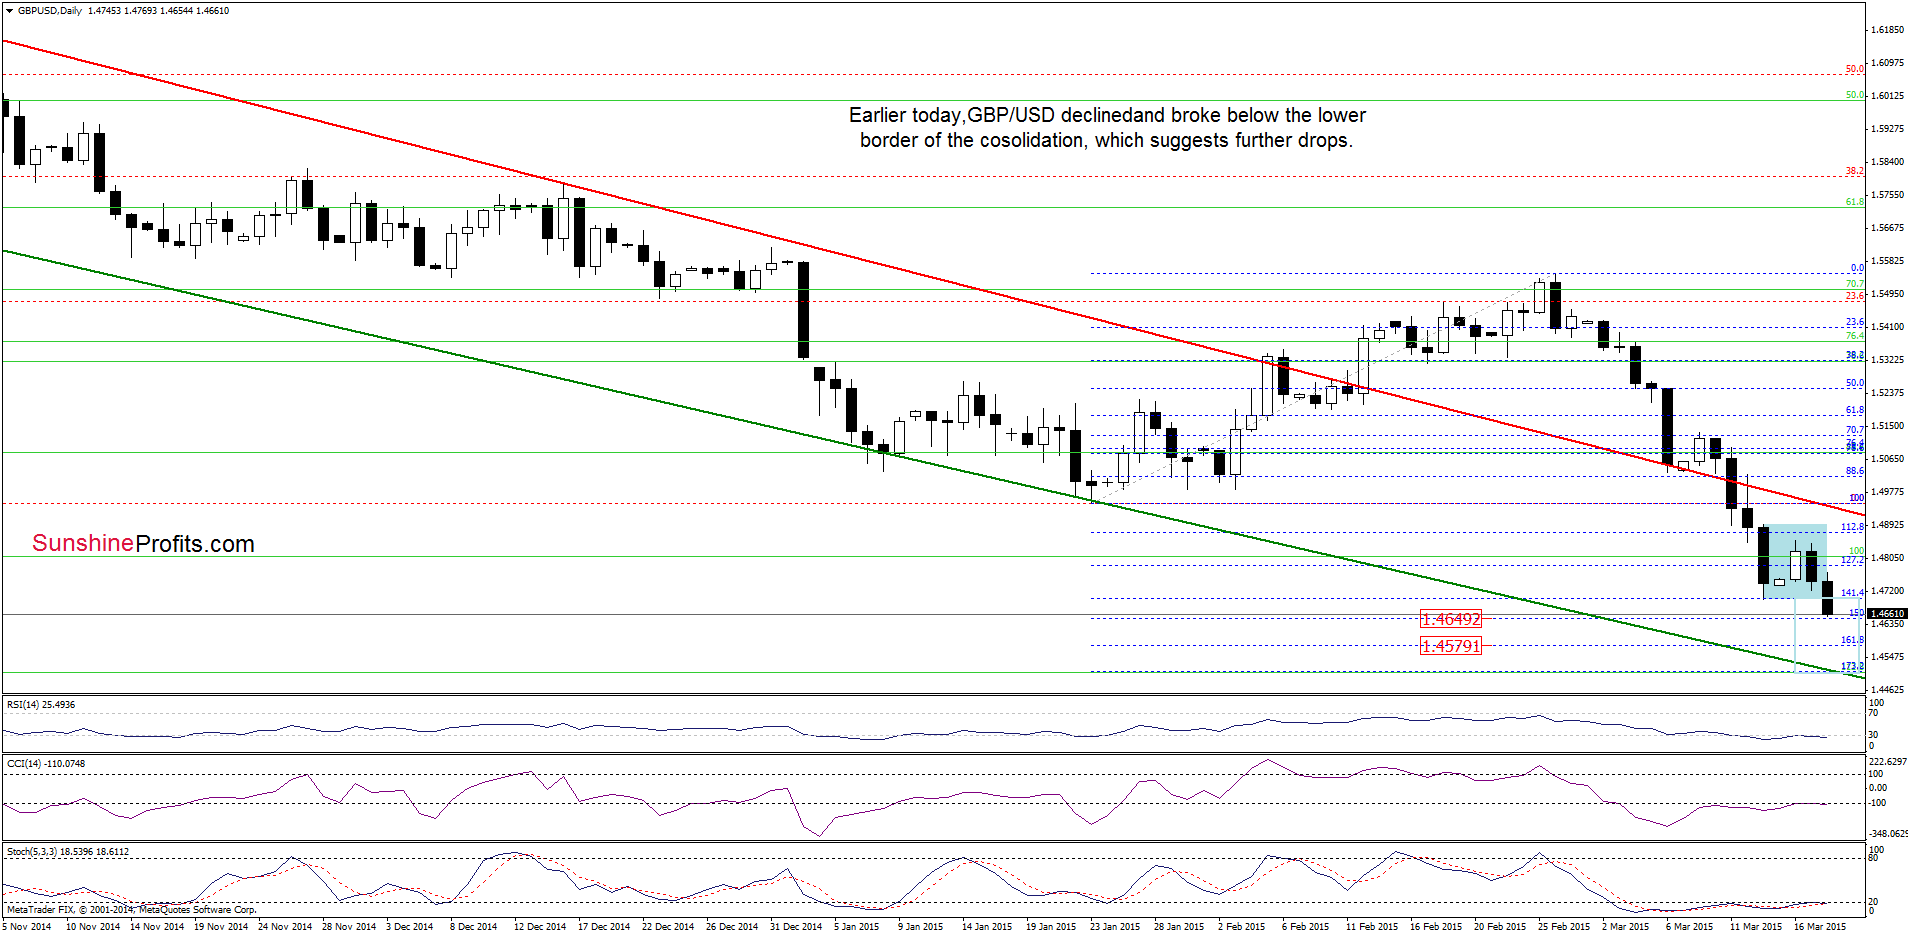
Earlier today, the U.K. Office for National Statistics showed that the rate of unemployment was unchanged at 5.7% in the fourth quarter of 2014, missing analysts’ expectations. Additionally, the claimant count decreased by 31,000 in the previous month, also disappointing expectations. Thanks to these bearish numbers GBP/USD declined sharply, slipping below 1.4700. How low could the exchange rate go in the coming days?
In our opinion the following forex trading positions are justified - summary:
- EUR/USD: none
- GBP/USD: none
- USD/JPY: none
- USD/CAD: short (stop loss order at 1.2876)
- USD/CHF: none
- AUD/USD: none
EUR/USD
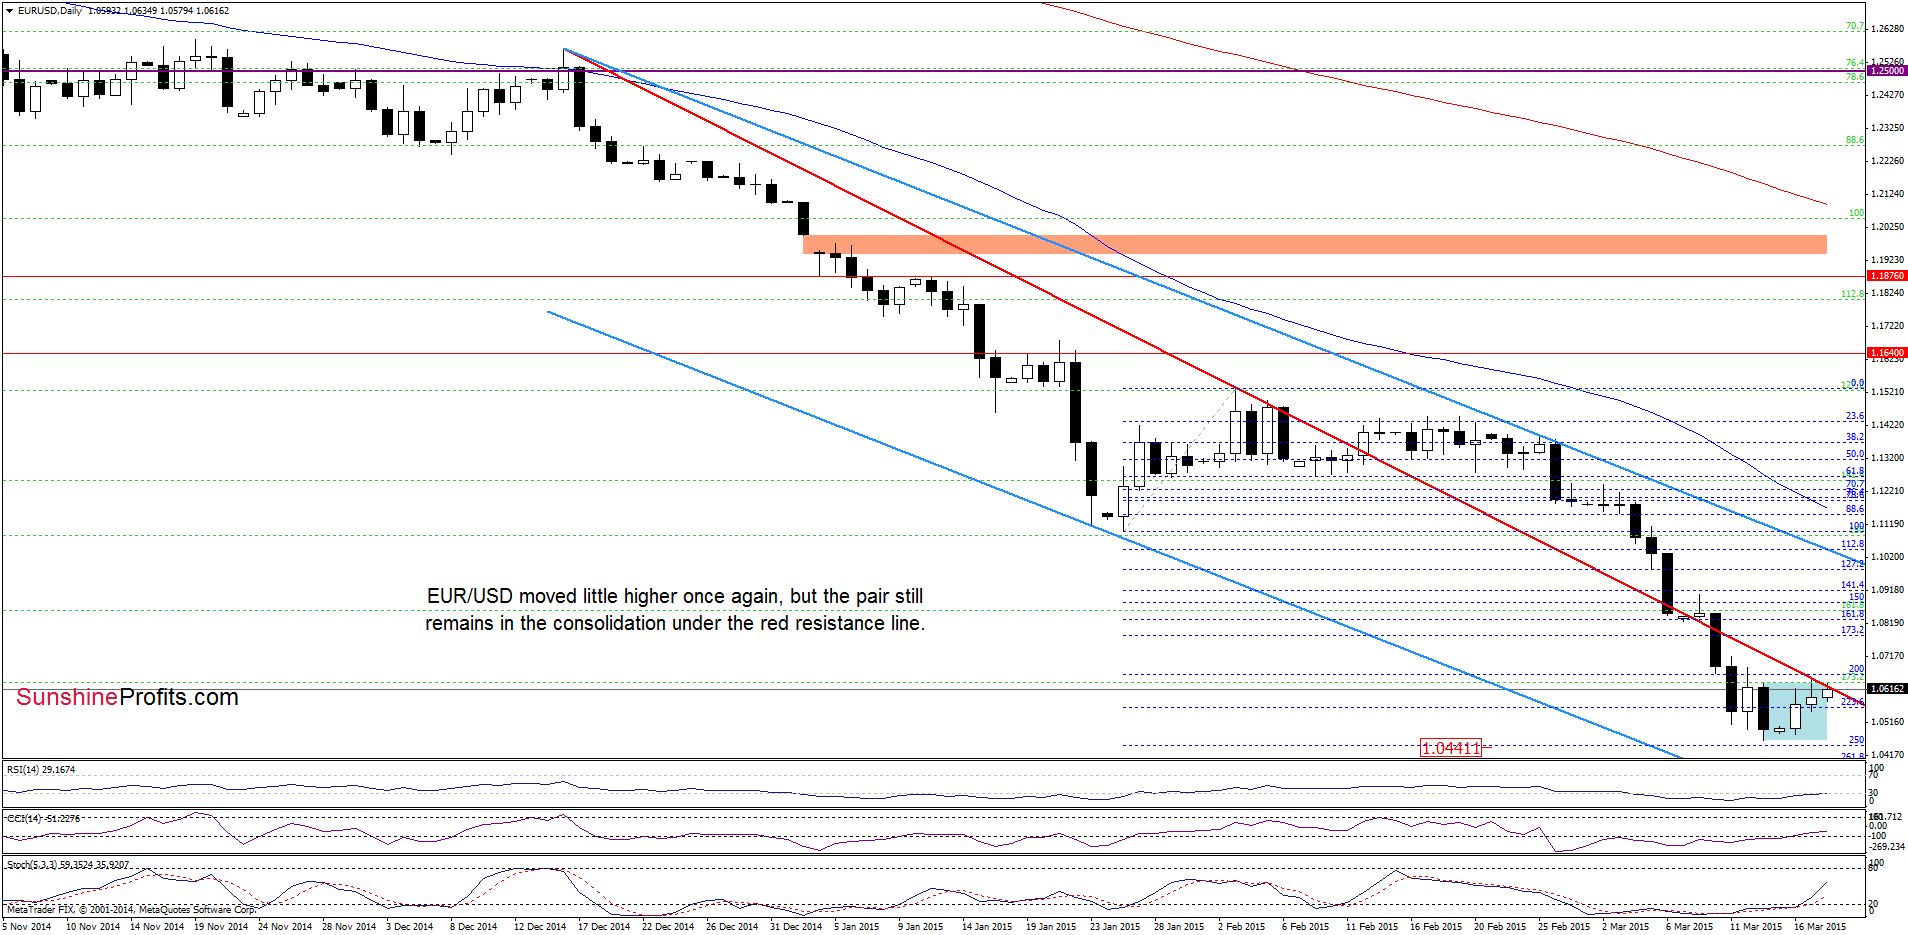
Looking at the charts, we see that although EUR/USD moved little higher earlier today, the overall situation hasn’t changed much as the pair still remains in the consolidation between Friday’s high and low under the red declining resistance line. Therefore, what we wrote yesterday is up-to-date:
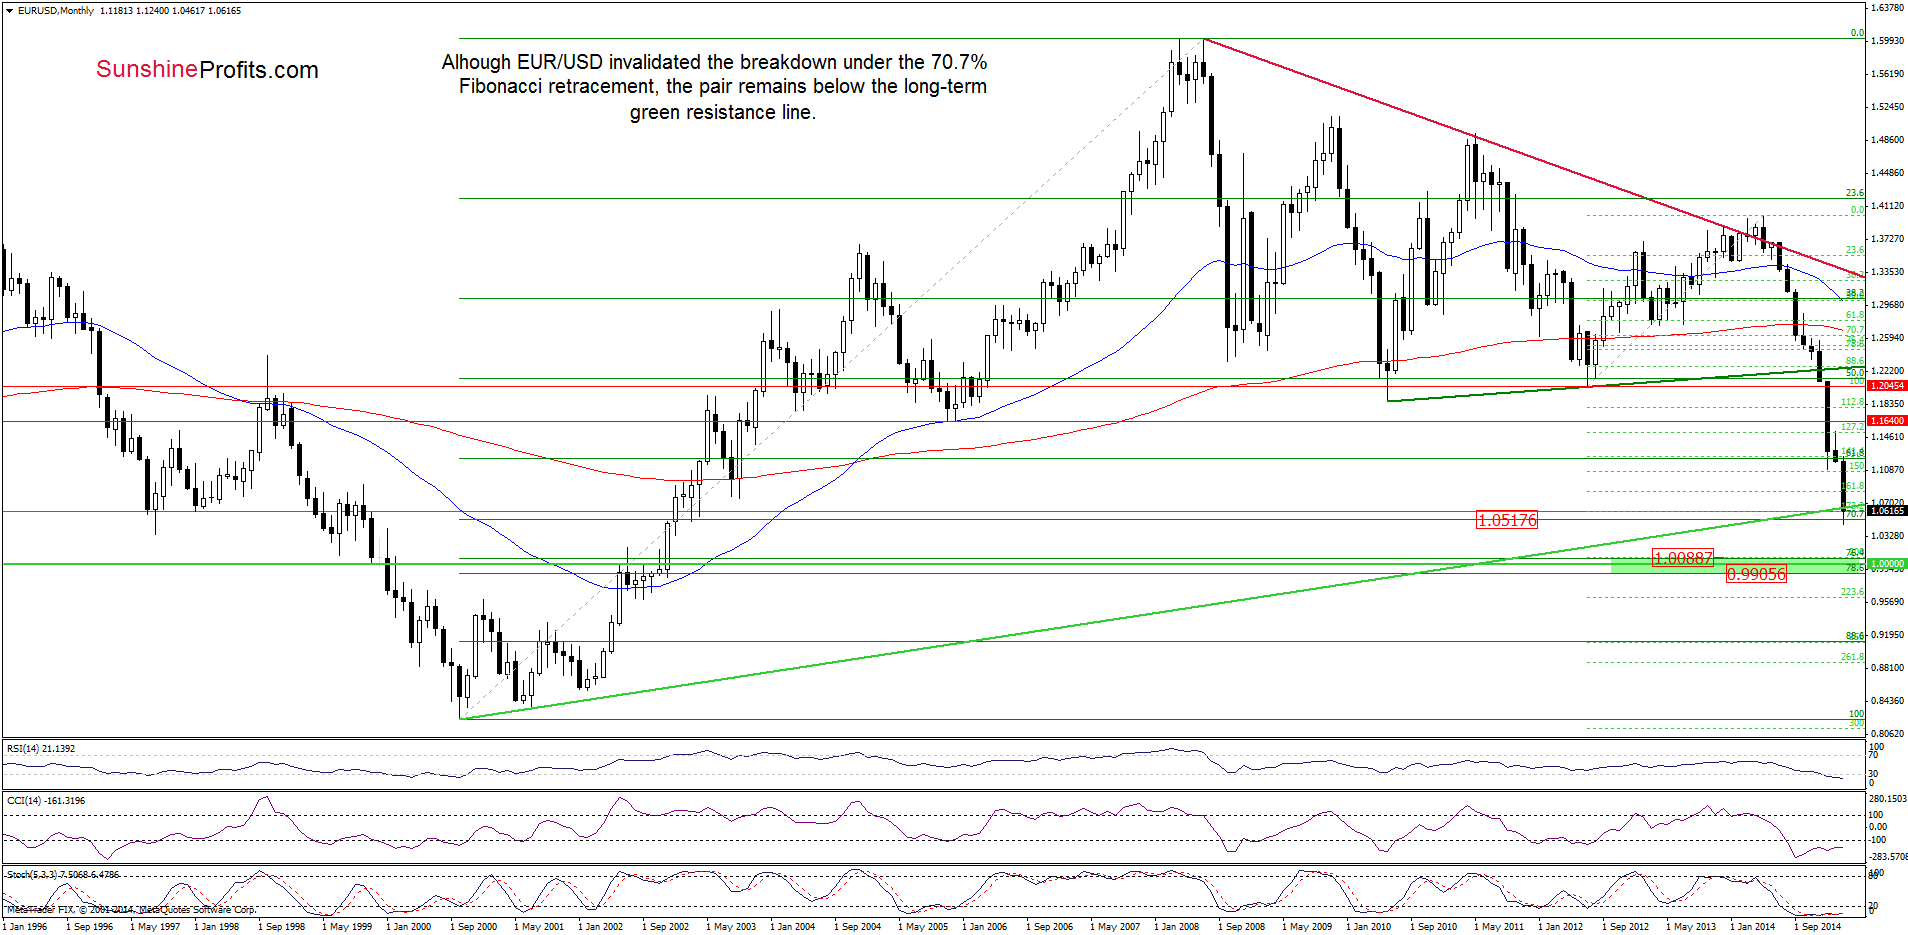
(…) EUR/USD came back above the 70.7% Fibonacci retracement, invalidating Friday’s breakdown. Although this is a positive signal, we should keep in mind that the exchange rate still remains under the previously-broken long-term green and medium-term red resistance lines. In our opinion, as long as there is no comeback above them further improvement is questionable and another downswing should not surprise us.
Very short-term outlook: mixed
Short-term outlook: mixed
MT outlook: mixed
LT outlook: mixed
Trading position (short-term; our opinion): No positions are justified from the risk/reward perspective at the moment. We will keep you informed should anything change, or should we see a confirmation/invalidation of the above.
GBP/USD
Quoting our Monday’s Forex Trading Alert:
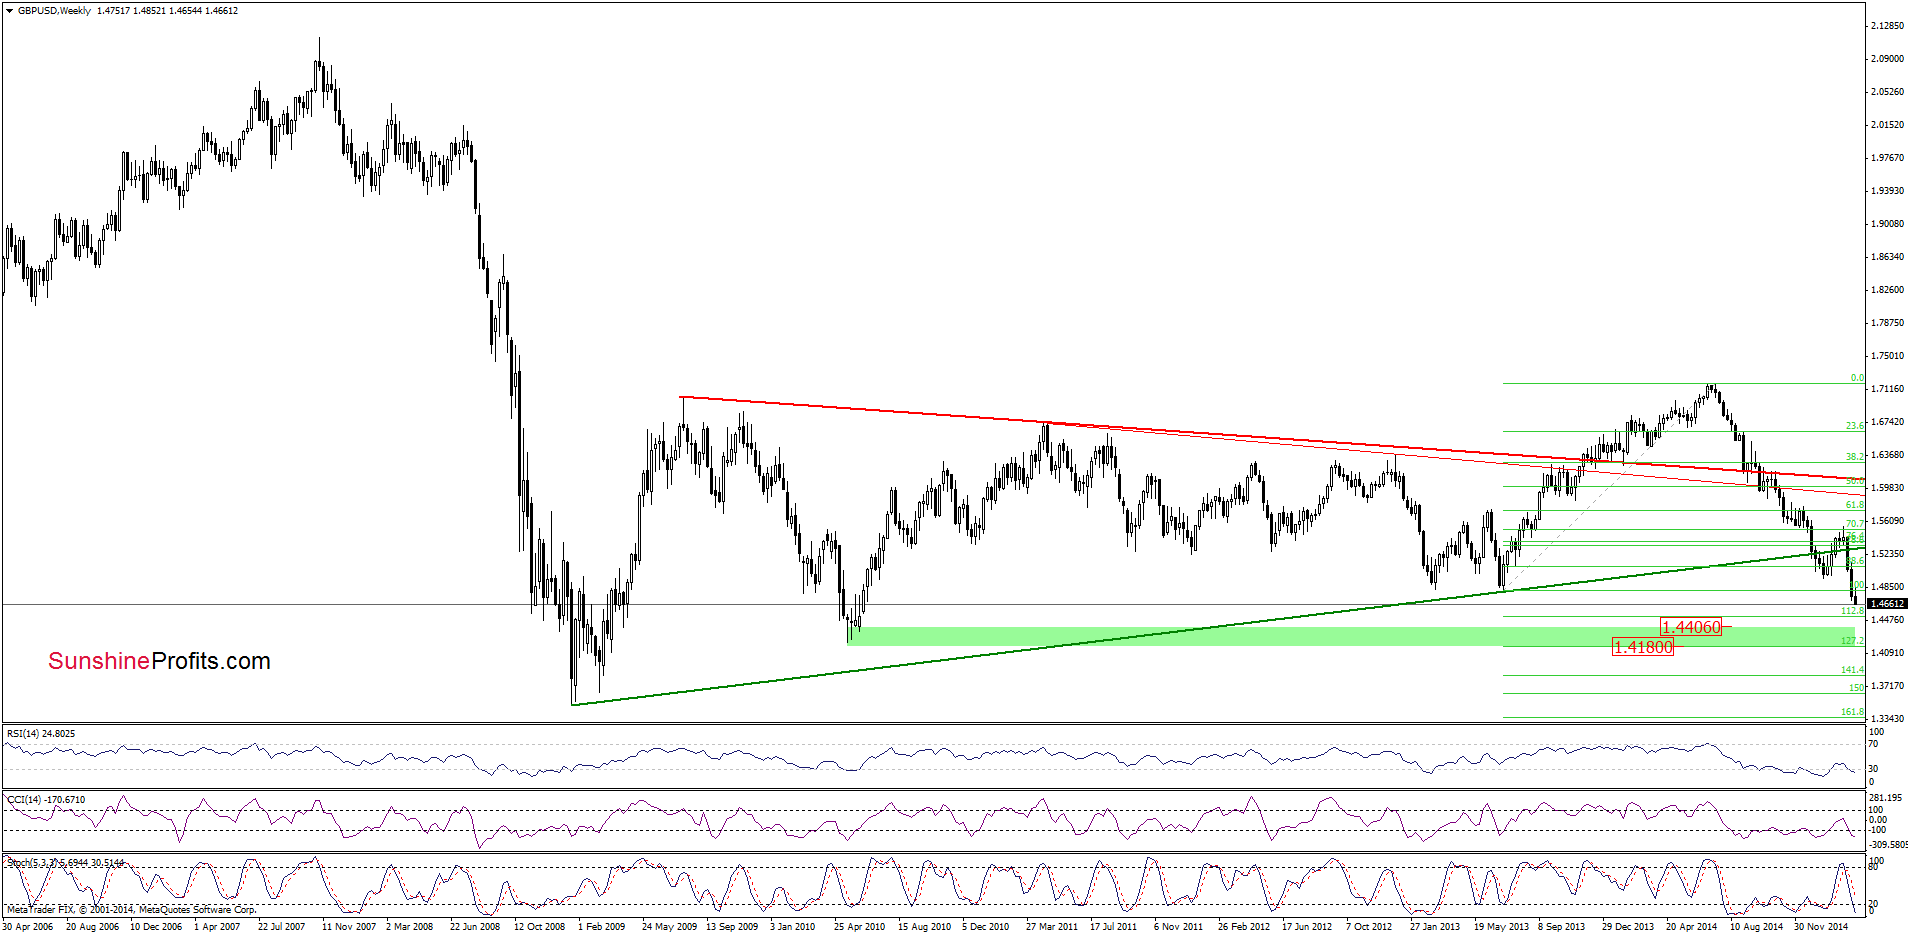
(…) the pair still remains under the previously-broken Jul 2013 low. Additionally, the sell signal generated by the weekly Stochastic Oscillator is still in play, supporting the bearish case at the moment. Therefore, (…) another downswing is likely. (…) If (…) the pair moves lower once again, the initial downside target would be around 1.4649, where the 150% extension is.
As you see on the charts, the situation developed in line with the above-mentioned scenario and GBP/USD reached our downside target earlier today. Although the pair could rebound from here, we should keep in mind that today’s downswing took the exchange rate below the lower border of the consolidation (marked with blue). Taking this bearish fact into account, and combining it with the medium-term picture, we believe that lower values of GBP/USD are still ahead us. If this is the case, our bearish scenario from the last commentary will be in play:
If this support is broken, we could see a decline to 1.4579 (161.8% extension). Nevertheless, taking into account the medium-term picture, it seems that GBP/USD could drop even to around 1.4180-1.4406, where the green support zone (marked on the weekly chart) created by the 2010 lows and the 127.2% Fibonacci extension (based on the entire 2013-2014 rally) is.
Very short-term outlook: bearish
Short-term outlook: mixed
MT outlook: mixed
LT outlook: mixed
Trading position (short-term; our opinion): No positions are justified from the risk/reward perspective at the moment. We will keep you informed should anything change, or should we see a confirmation/invalidation of the above.
USD/CHF
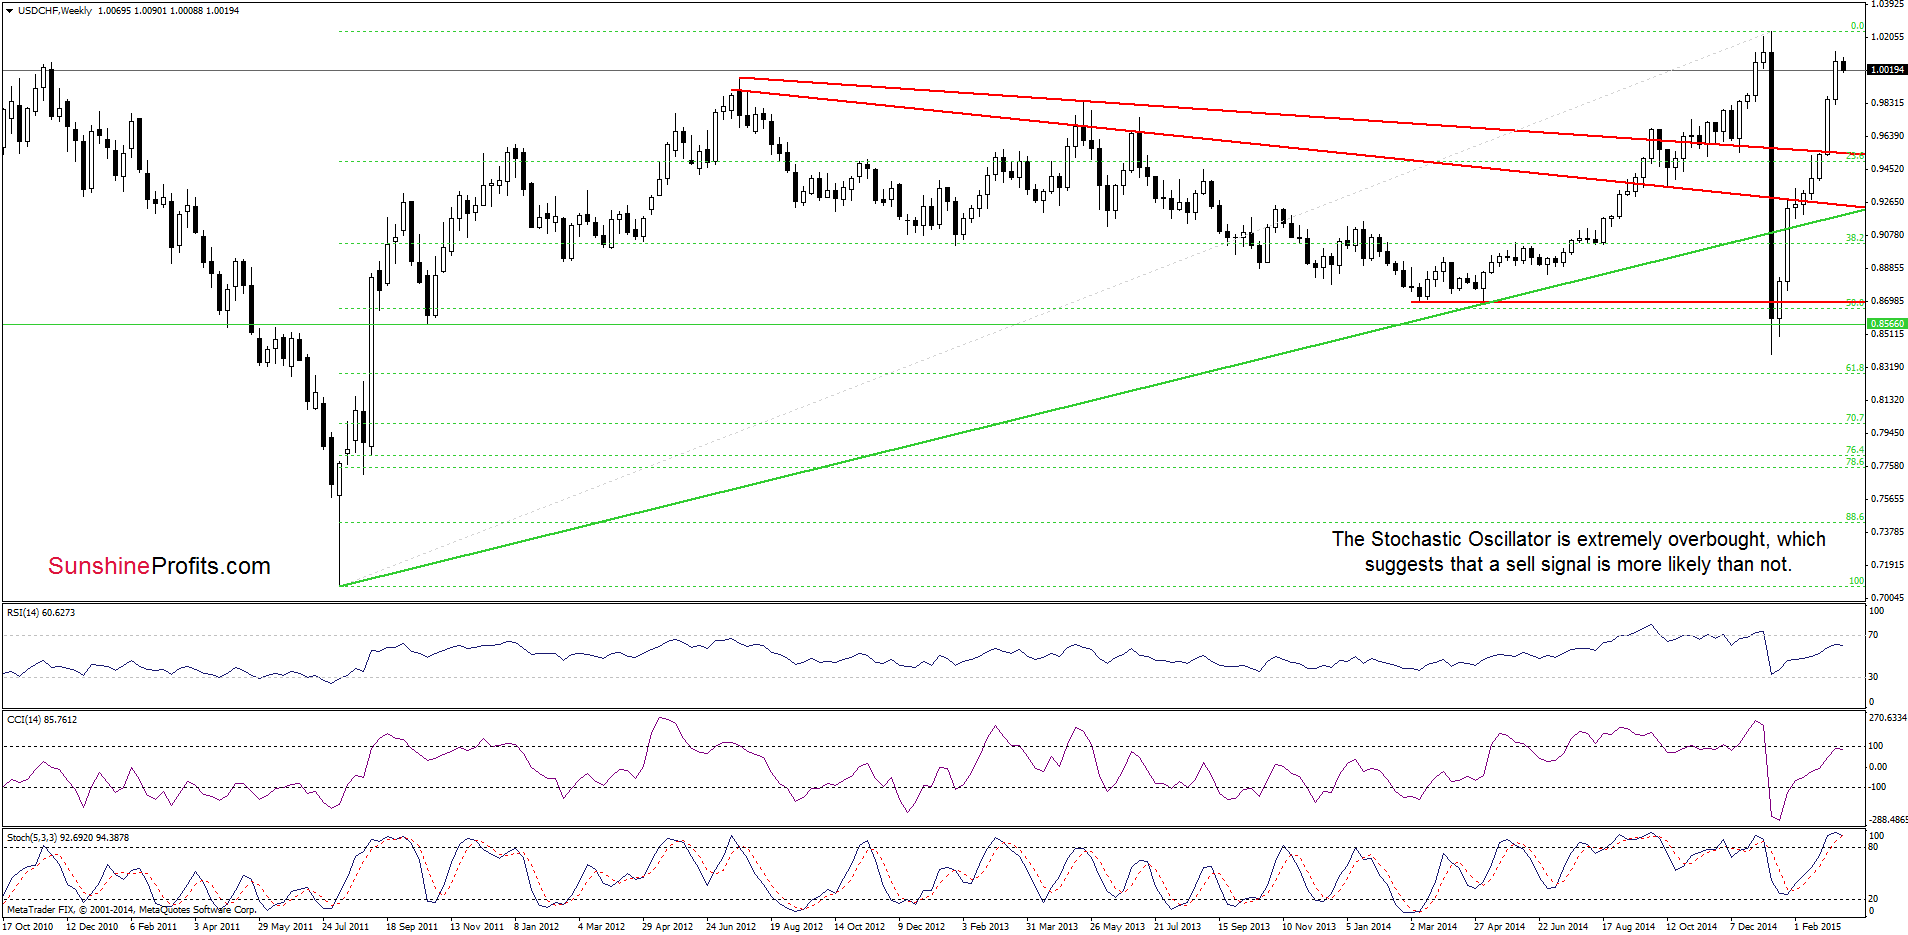
The medium-term picture hasn’t changed much as USD/CHF still remains quite close to the last week’s high. Nevertheless, we should keep in mind that the Stochastic Oscillator is extremely overbought, which suggests that we’ll see a sell signal in the coming week. In this case, the probability of a correction will increase.
Having said that, let’s check what we can infer from the daily chart.
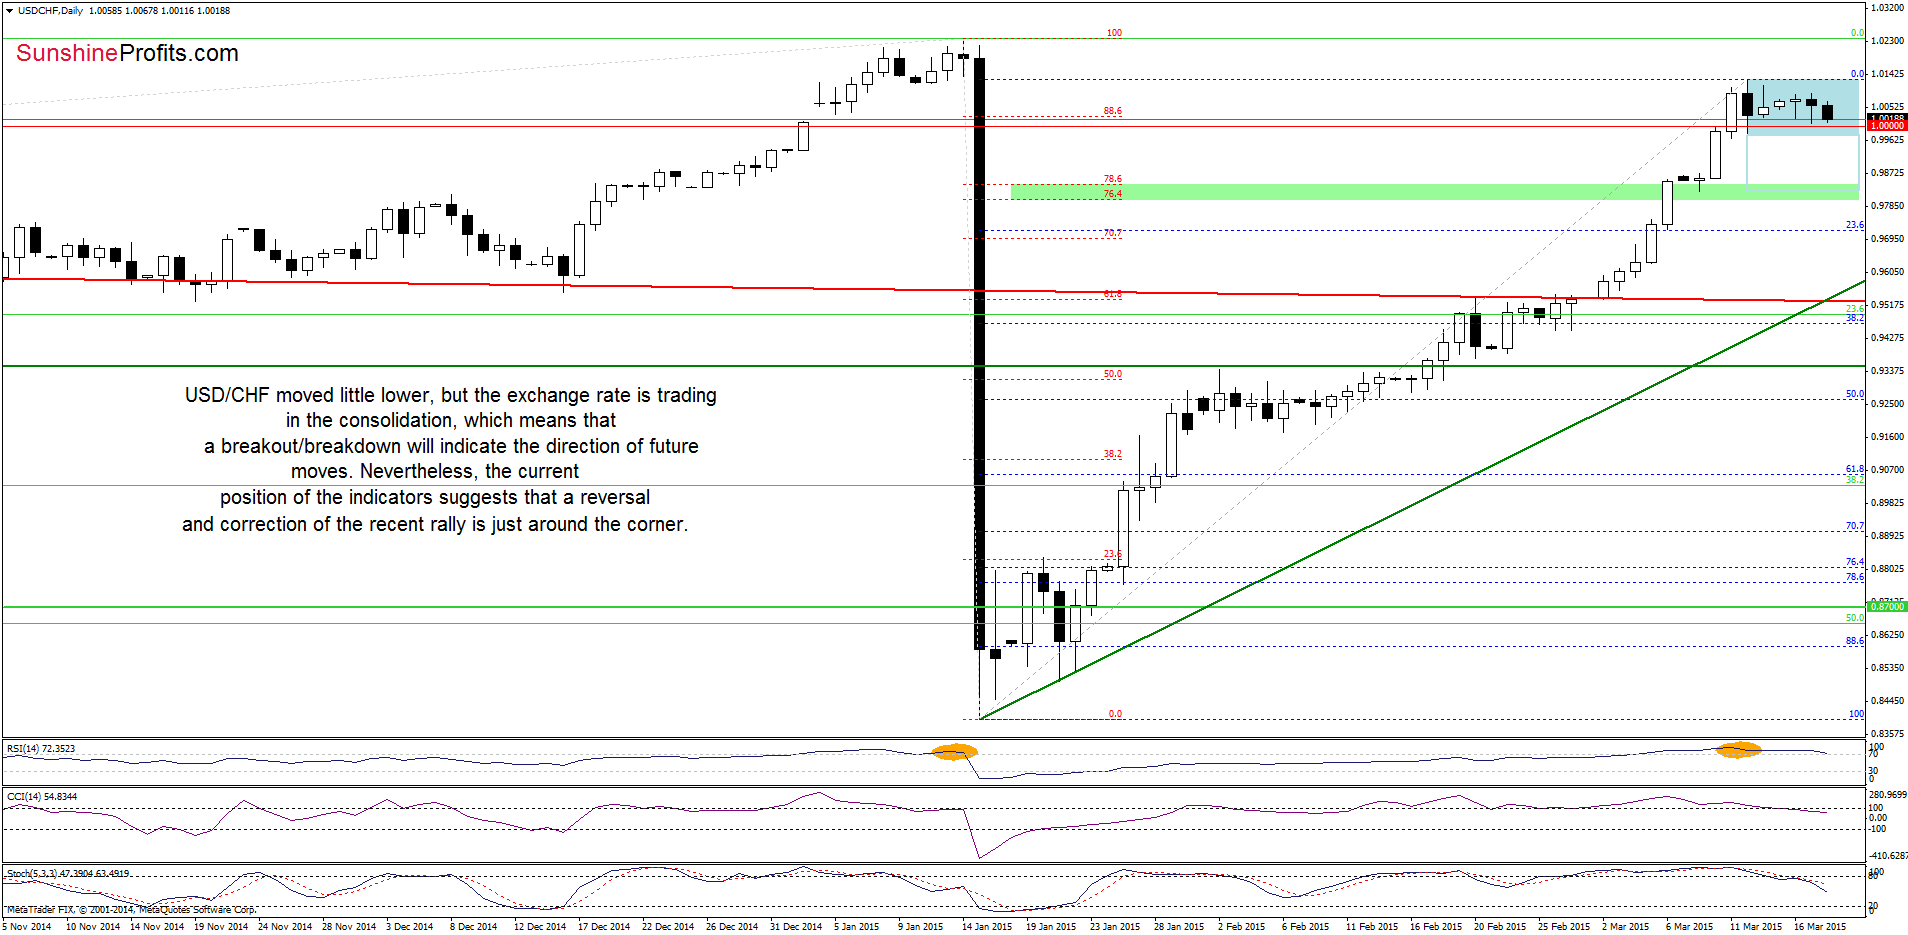
On the above chart we see that USD/CHF moved little lower once again, but the exchange rate is trading in the consolidation (marked with blue), which means that a breakout/breakdown will indicate the direction of future moves. Nevertheless, taking into account the current position of the indicators, it seems to us that the next move will be to the downside. Why this direction is more likely at the moment? We think that the best answer to this question will be a quote from our Monday’s alert:
(…) the RSI remains above the level of 70, which is a negative sign. The reason? As you see on the daily chart, in Jan such high reading of the indicator preceded one of the sharpest declines in forex market. Taking this fact into account, and combining it with a sell signal generated by the Stochastic Oscillator (…), it seems that a reversal and correction of the recent rally is just around the corner. (…) the CCI generated a sell signal earlier today, supporting the bearish case.
Very short-term outlook: mixed with bearish bias
Short-term outlook: mixed
MT outlook: mixed
LT outlook: bearish
Trading position (short-term; our opinion): No positions are justified from the risk/reward perspective at the moment. We will keep you informed should anything change, or should we see a confirmation/invalidation of the above.
Thank you.
Nadia Simmons
Forex & Oil Trading Strategist
Przemyslaw Radomski, CFA
Founder, Editor-in-chief
Gold & Silver Trading Alerts
Forex Trading Alerts
Oil Investment Updates
Oil Trading Alerts

