
Earlier today, the Office of National Statistics showed that the annual rate of consumer inflation dropped to 0.5% in Dec (to its lowest level in 14 years), underlining expectations that the Bank of England will keep interest rates on hold later this year. As a result, GBP/USD moved lower, bouncing down the medium-term resistance line. Does it mean that we’ll lower values of the exchange rate in the coming week?
In our opinion the following forex trading positions are justified - summary:
- EUR/USD: none
- GBP/USD: none
- USD/JPY: none
- USD/CAD: none
- USD/CHF: none
- AUD/USD: long (stop loss: 0.7940; initial upside target: 0.8230)
EUR/USD
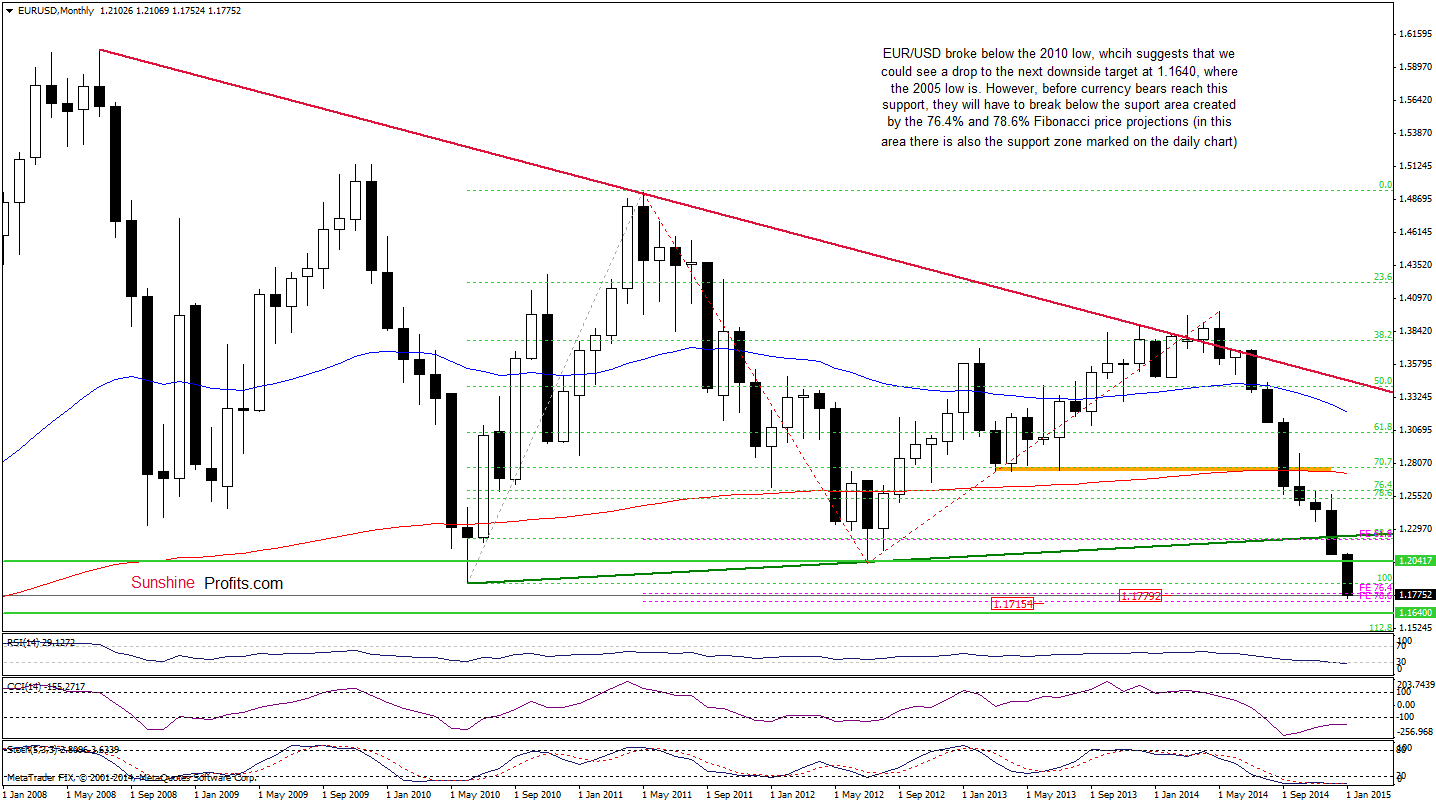
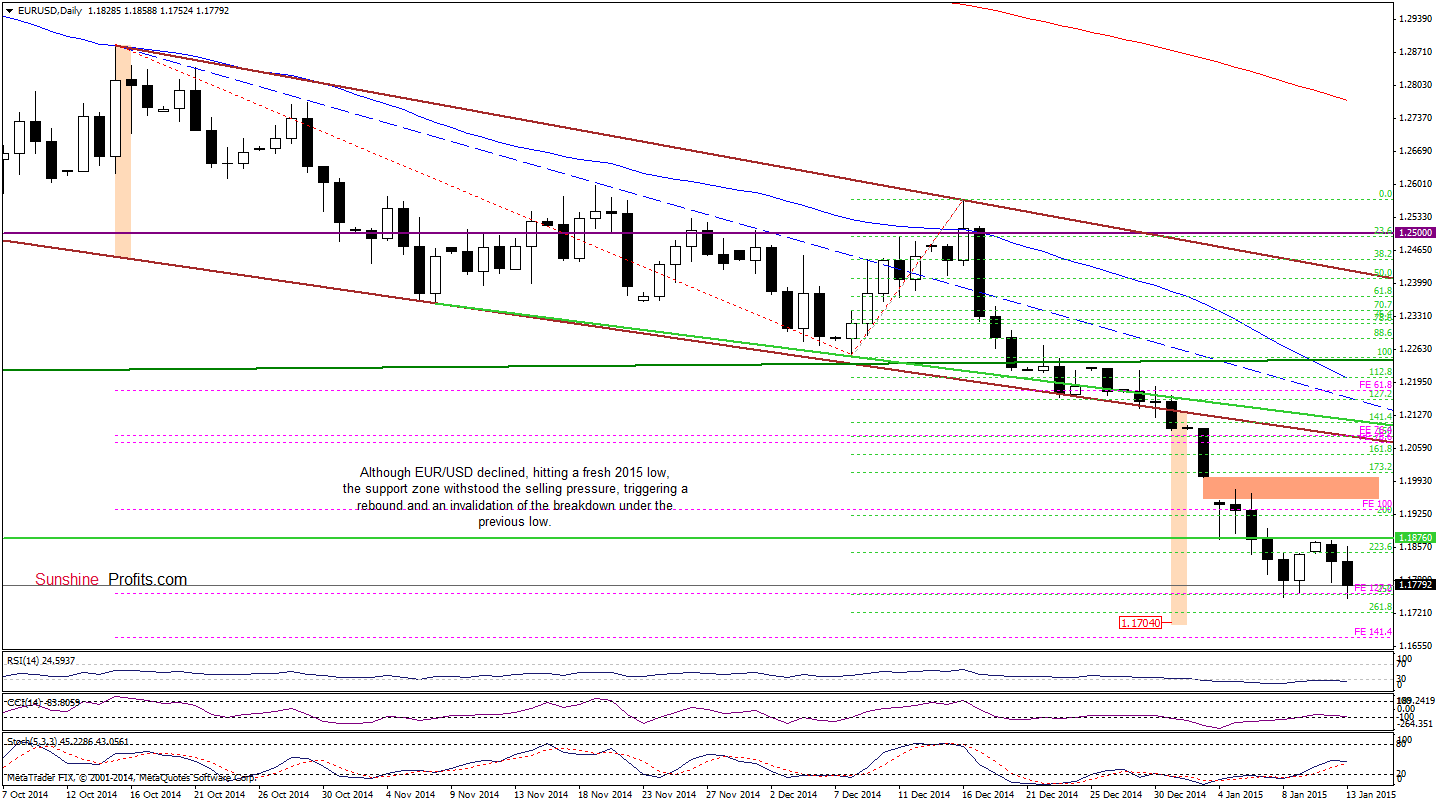
The first thing that catches the eye on the daily chart is a drop to a fresh 2015 low. Despite this deterioration, the support zone (created by the 127.2% Fibonacci price projection and the 250% Fibonacci extension) withstood the selling pressure, triggering a rebound and an invalidation of the breakdown below the previous low (at this point, it’s worth noting that the pair is still trading in the support area created by the 76.4% and 78.6% Fibonacci price projections marked on the weekly chart). Although this is a bullish signal, which suggests further improvement, we should keep in mind that the overall situation hasn’t changed much as EUR/USD still remains under the previously-broken 2010 low (which serves as the key resistance at the moment). What does it mean for the exchange rate? We think that the best answer to this question will be our last commentary on this currency pair:
(…) as long as there is no invalidation of the breakdown below this important level higher values of the exchange rate are not likely to be seen. Nevertheless, the current position of the indicators (…) suggests that currency bulls will try to push the pair higher in the coming day(s).
Very short-term outlook: mixed with bullish bias
Short-term outlook: mixed
MT outlook: mixed
LT outlook: mixed
Trading position (short-term): In our opinion, no positions are justified from the risk/reward perspective at the moment. We will keep you informed should anything change, or should we see a confirmation/invalidation of the above.
GBP/USD
On Friday, we wrote the following:
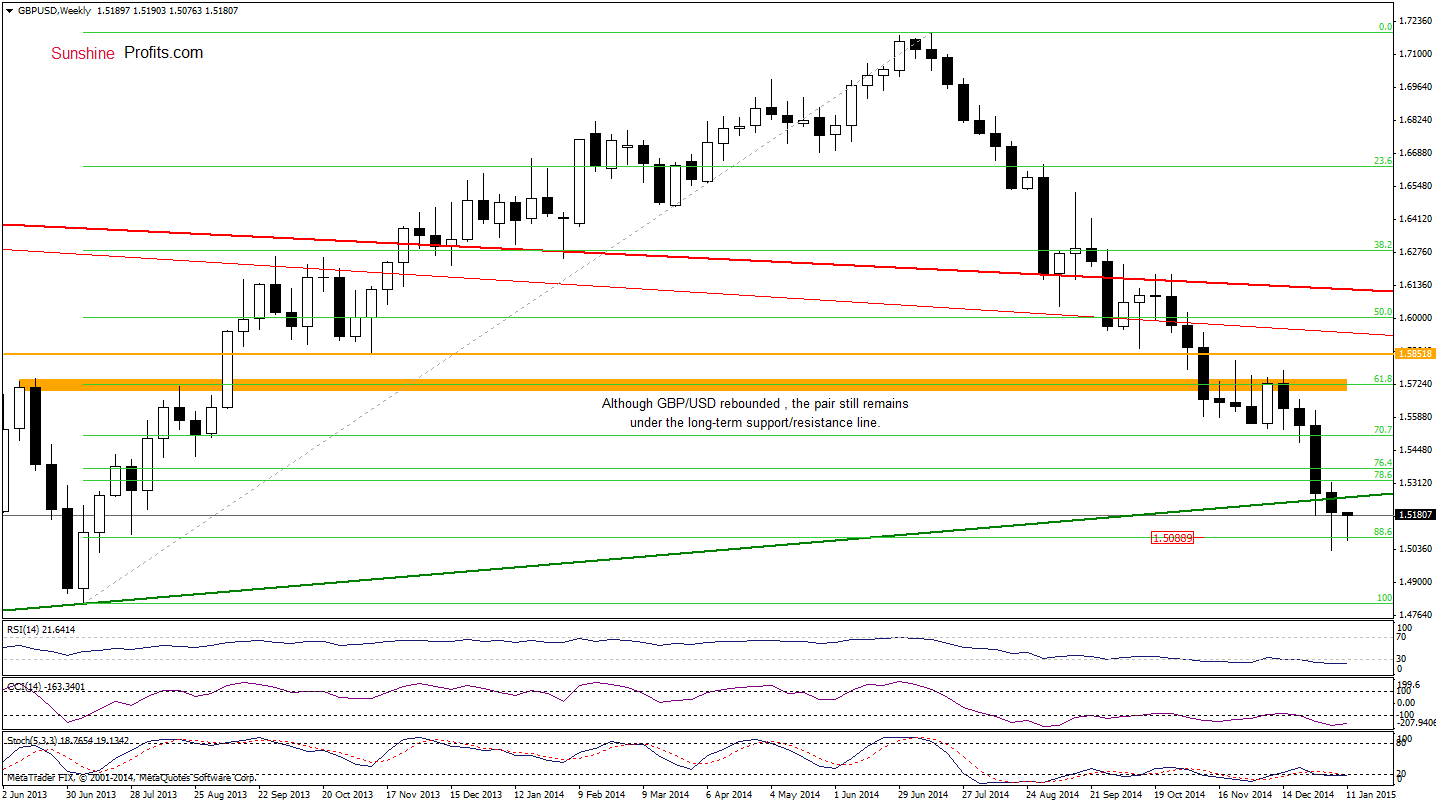
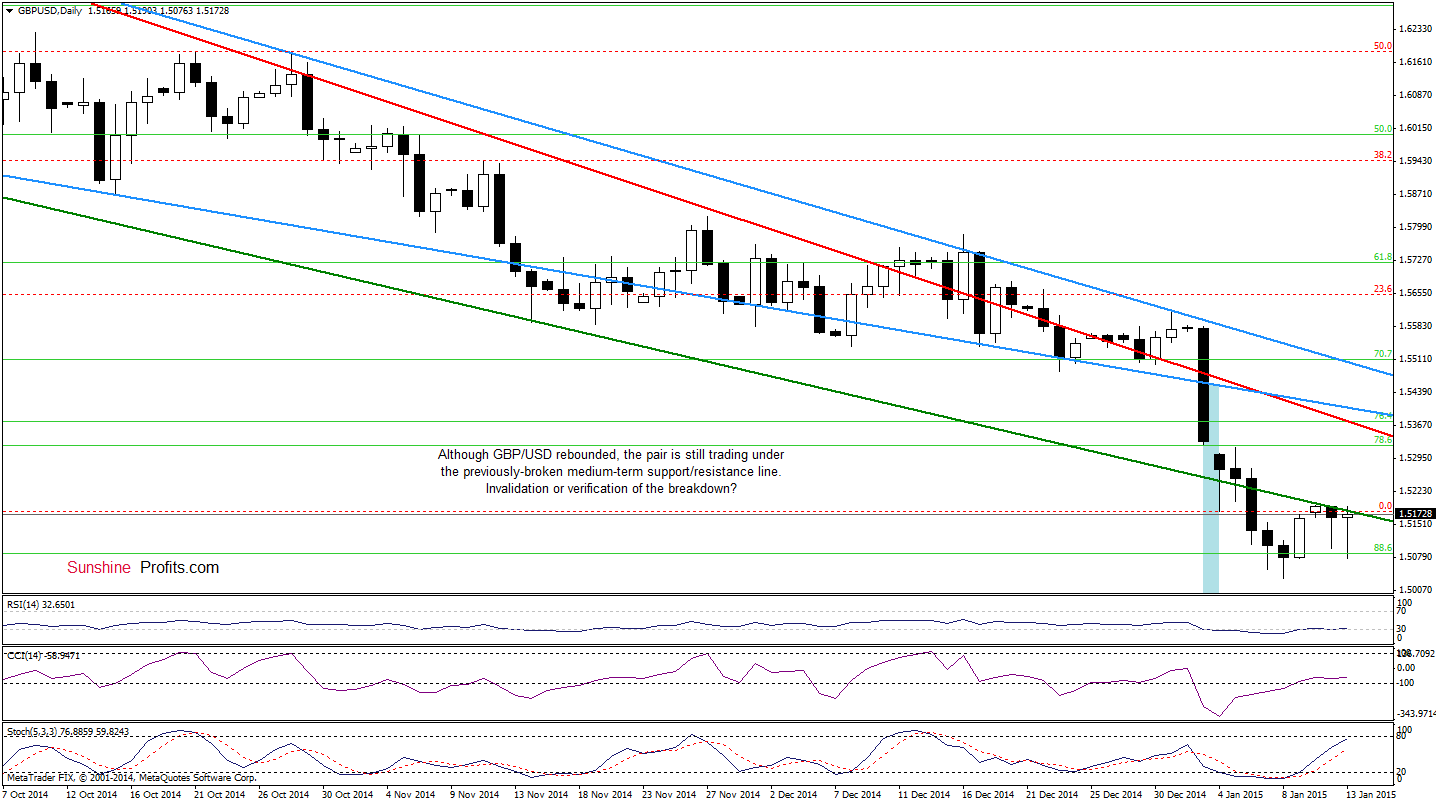
(…) the current position of the daily indicators (the CCI generated a buy signal, while the RSI and Stochastic Oscillator are very close to doing it) suggests that currency bulls will try to push the pair higher in the coming week.
From the daily perspective, we see that the situation developed in line with the above-mentioned scenario as GBP/USD bounced off the 88.6% Fibonacci retracement and climbed to the medium-term green support/resistance line. Although this is a positive signal, the exchange rate still remains under the previously-broken long- term resistance line, which means that as long as there is no invalidation of the breakdown below these lines, further improvement and a sizable upward move is questionable. Nevertheless, if we see such price action, we’ll consider opening long positions. Until this time, waiting on the sidelines for a profitable opportunity is the best choice.
Very short-term outlook: mixed
Short-term outlook: mixed
MT outlook: mixed
LT outlook: mixed
Trading position (short-term): In our opinion, no positions are justified from the risk/reward perspective at the moment. We will keep you informed should anything change, or should we see a confirmation/invalidation of the above.
USD/CHF
The situation in the medium term hasn’t changed much as USD/CHF is still trading above the 112.8% Fibonacci extension.
What can we infer from the daily chart? Let’s take a look.
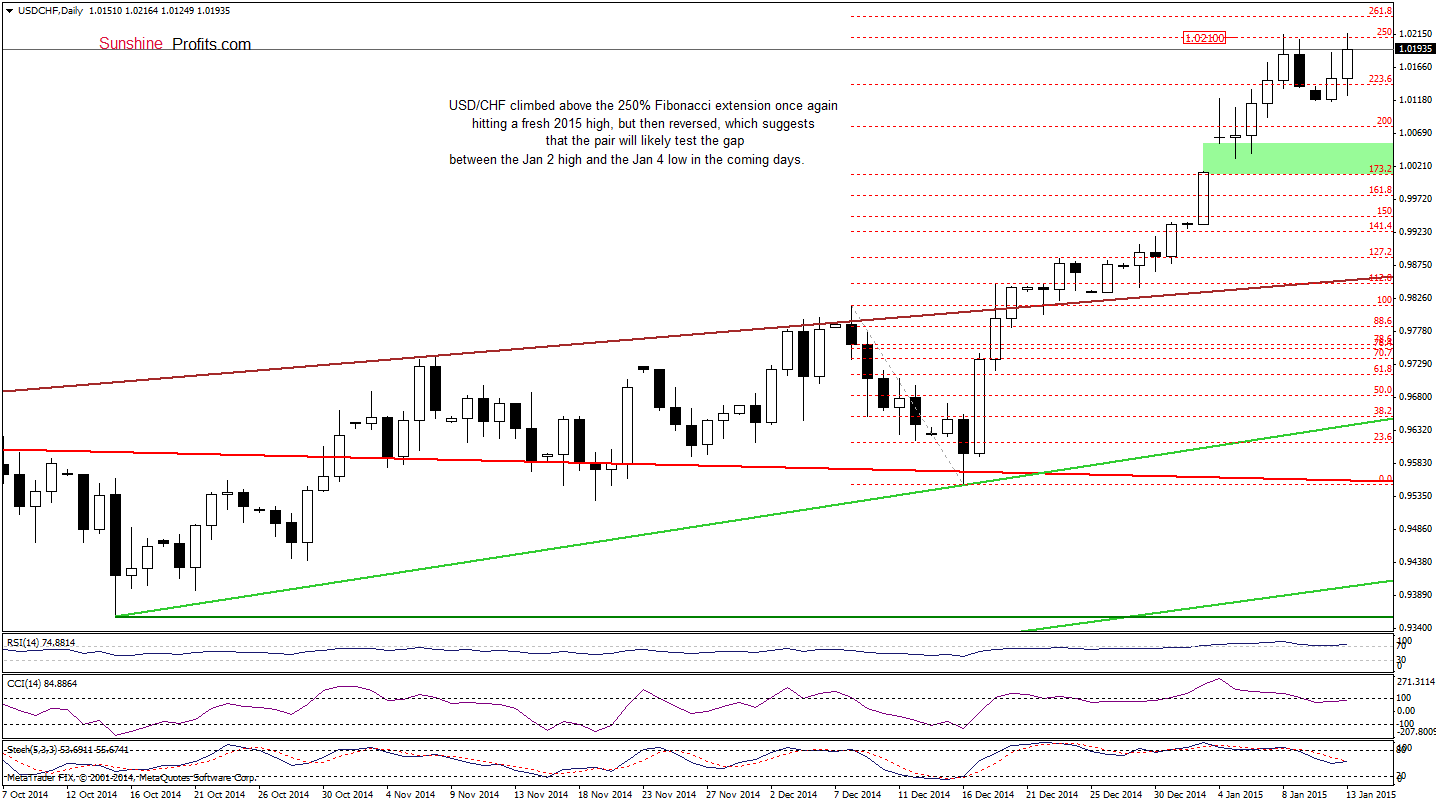
As you see on the daily chart, USD/CHF climbed slightly above the 250% Fibonacci extension once again, hitting a fresh 2015 high. Although this is a bullish signal, the pair reversed (similarly to what we saw on Thursday), which suggests that we could see a pullback from here in the coming days. If this is the case, the initial downside target for currency bears would be the gap between the Jan 2 high and the Jan 4 low. In our opinion, this scenario will be even more likely of the pair invalidates the breakout above the 112.8% Fibonacci extension.
Very short-term outlook: mixed with bearish bias
Short-term outlook: mixed
MT outlook: mixed
LT outlook: bearish
Trading position (short-term; our opinion): No positions are justified from the risk/reward perspective at the moment. We will keep you informed should anything change, or should we see a confirmation/invalidation of the above.
Thank you.
Nadia Simmons
Forex & Oil Trading Strategist
Forex Trading Alerts
Oil Investment Updates
Oil Trading Alerts

