
Although USD/CHF successfully broke above its important resistance line on Friday, the pair didn’t hit a fresh 2014 high in contrast to the USD Index, which climbed to its highest level since March 2006. Earlier today, we saw another unsuccessful attempt to move higher. Does it mean that the rally is getting out of steam and we’ll see a trend reversal in the coming week?
In our opinion the following forex trading positions are justified - summary:
EUR/USD
In our previous Forex Trading Alert, we wrote the following:
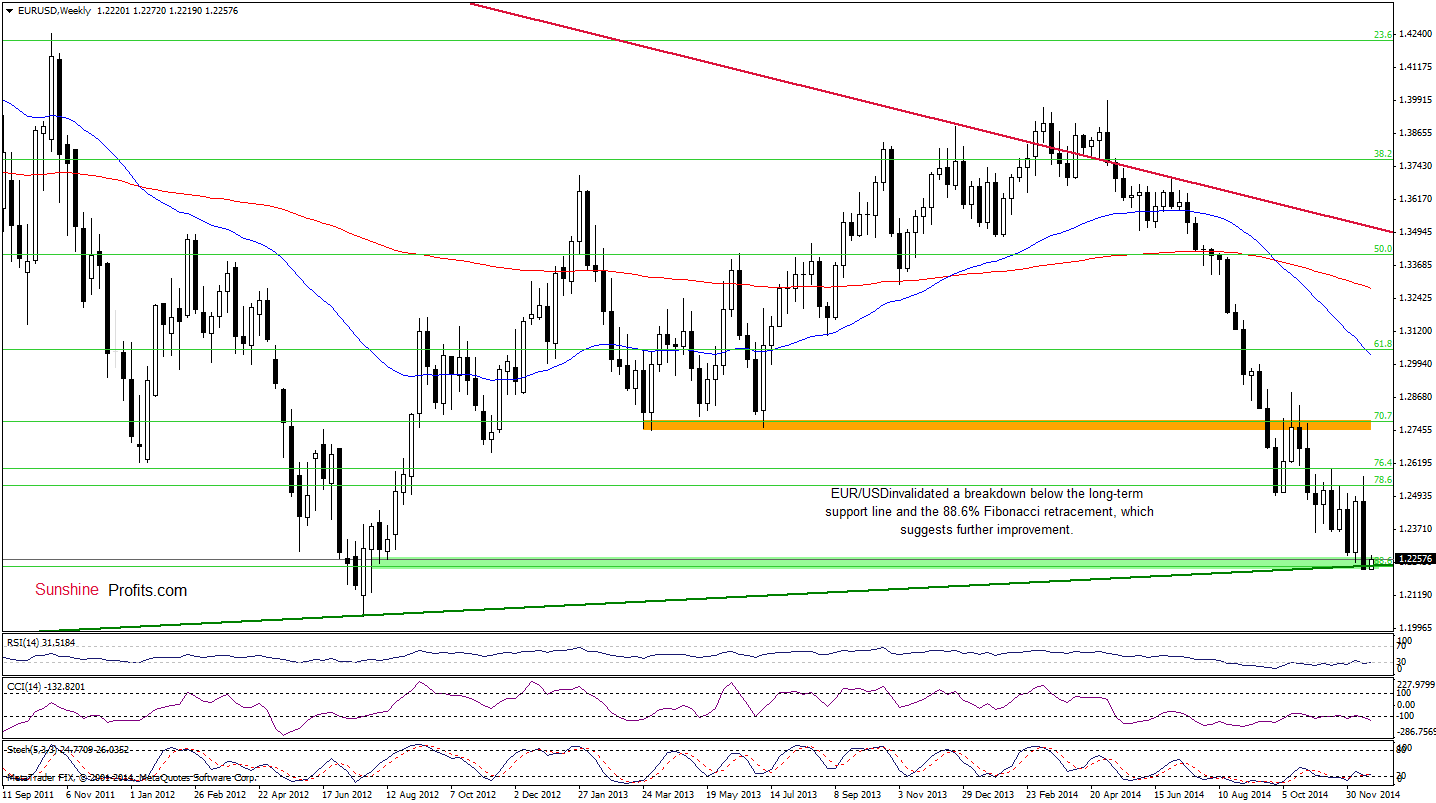
(...) the exchange rate reached the support zone created by the long-term green support line and the 88.6% Fibonacci retracement. In the previous week, this support area was strong enough to pause further deterioration and trigger a corrective upward move. Taking this fact ino account, it seems to us that we’ll see a similar price action and the pair will rebound in the coming days.
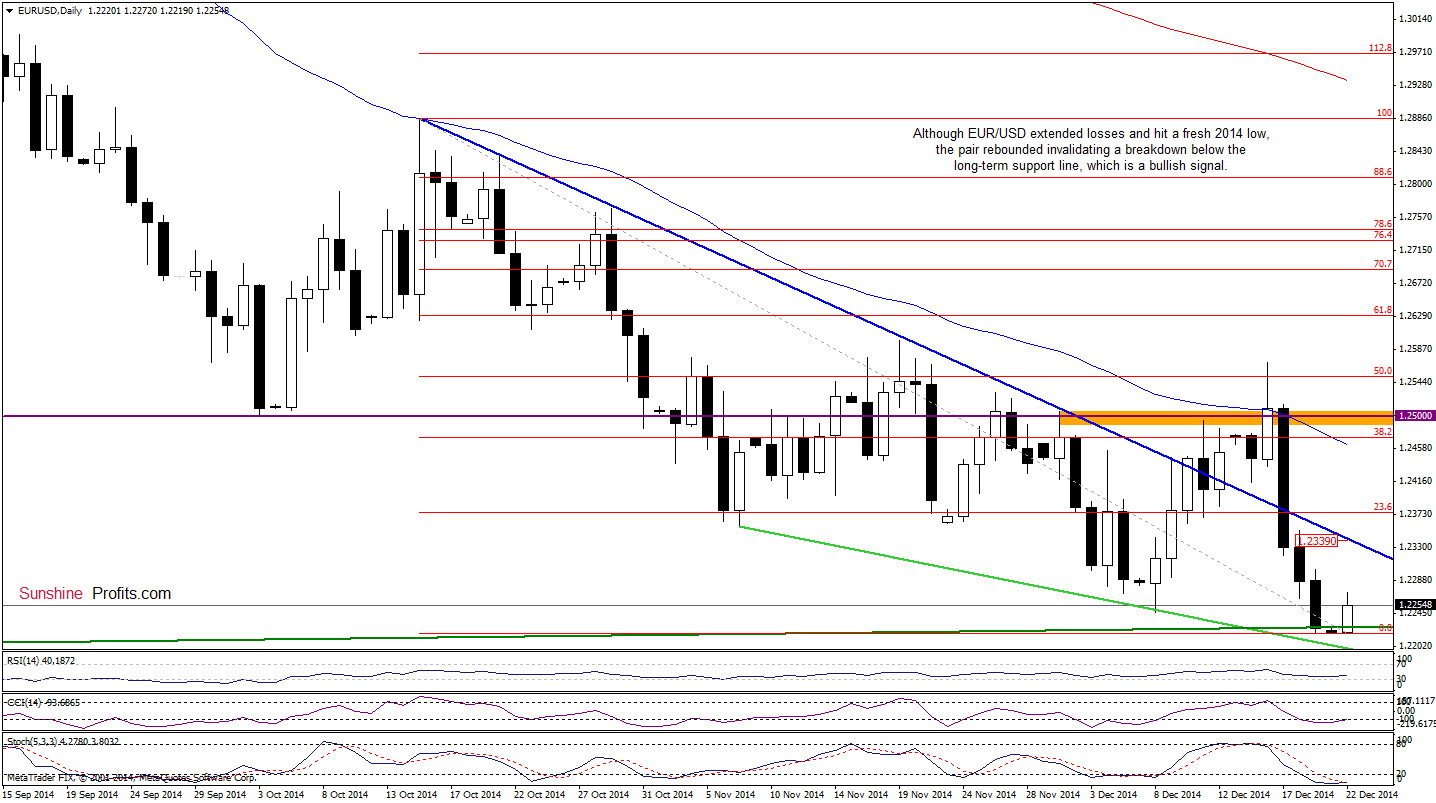
Looking at the above charts, we see that although EUR/USD moved lower, hitting a fresh 2014 low, currency bulls didn’t give up as we expected. As a result, the exchange rate rebounded, invalidating small breakdown below the above-mentioned support zone. This is a positive signal, which suggests further improvement and an increase to at lest the blue declining resistance line (marked on the daily chart) around 1.2339. At this point, it’s worth noting that the current position of the indicators (the CCI generated a buy signal, while the Stochastic Oscillator is extremely oversold) supports this pro growth scenario.
Very short-term outlook: bullish
Short-term outlook: mixed with bullish bias
MT outlook: mixed
LT outlook: bearish
Trading position (short-term): In our opinion, no positions are justified from the risk/reward perspective at the moment. We will keep you informed should anything change, or should we see a confirmation/invalidation of the above.
USD/CAD
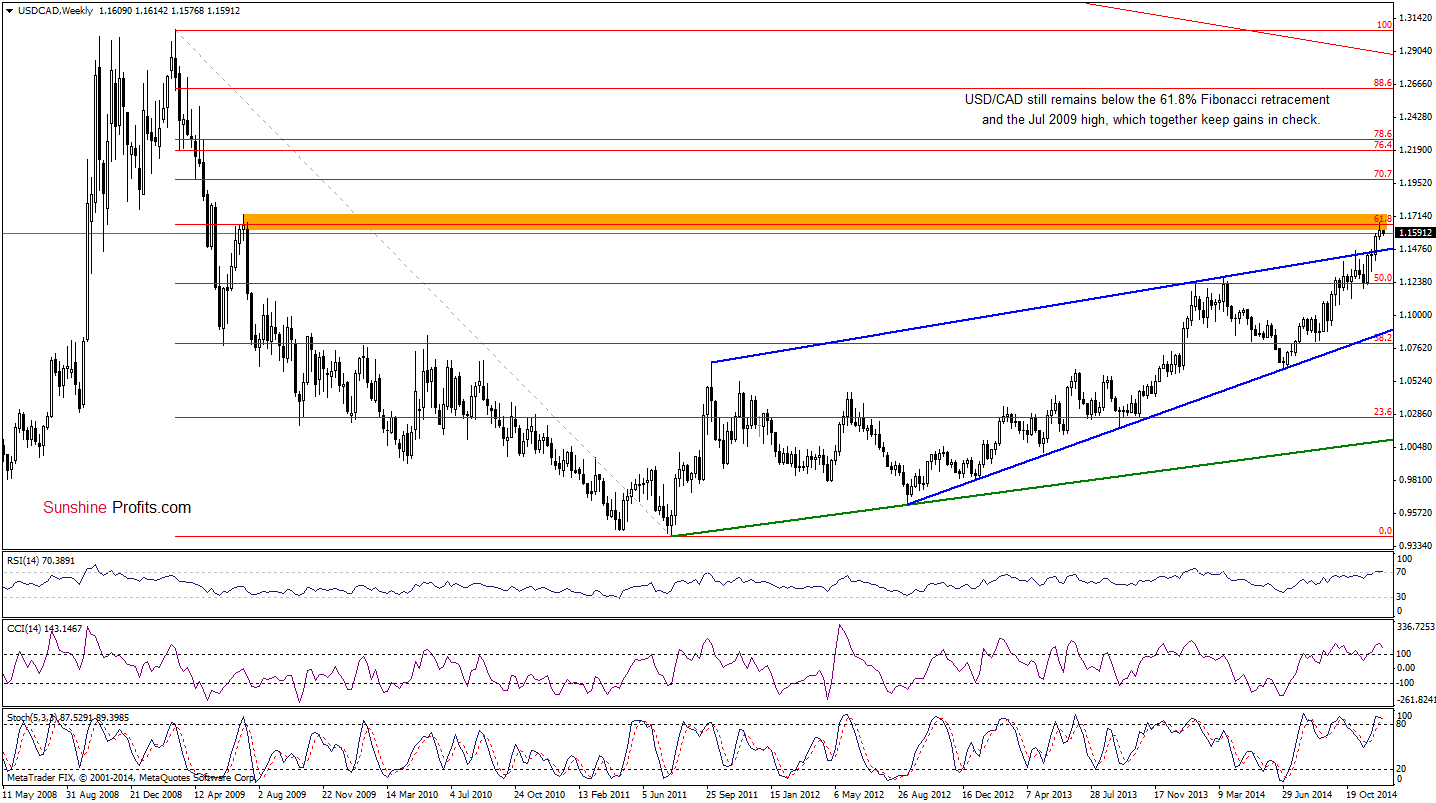
The situation in the medium term hasn’t changed much since our last commentary on this currency pair was posted as USD/CAD is still trading below the orange resistance zone (created by the 61.8% Fibonacci retracement and the Jul 2009 high), which keeps gains in check.
Having say that, let’s examine the daily chart.
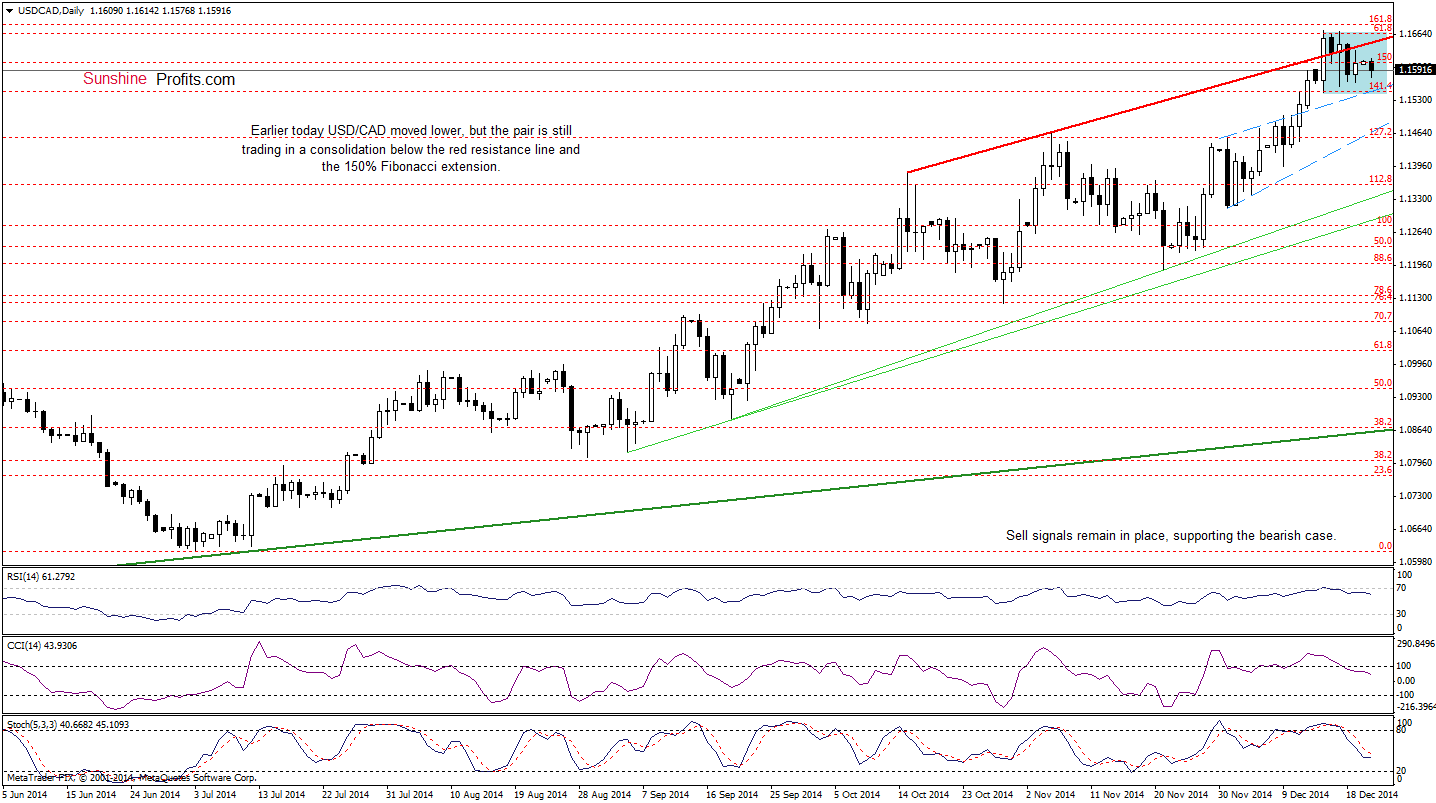
From this perspective, we see that although USD/CAD moved little lower earlier today, the pair is still trading in a consolidation below the previously-broken red resistance line. Therefore, our last commentary on this currency pair is up-to-date:
(…) the pair declined, invalidating earlier breakout, which is a bearish signal that suggests lower values of the exchange rate (especially when we factor in sell signals generated by the indicators). Nevertheless, we think that further declines will be more likely if USD/CAD breaks below the lower border of the consolidation (marked with blue) at 1.1547.
Very short-term outlook: mixed with bearish bias
Short-term outlook: mixed
MT outlook: mixed
LT outlook: mixed
Trading position (short-term; our opinion): No positions are justified from the risk/reward perspective at the moment. We will keep you informed should anything change, or should we see a confirmation/invalidation of the above.
USD/CHF
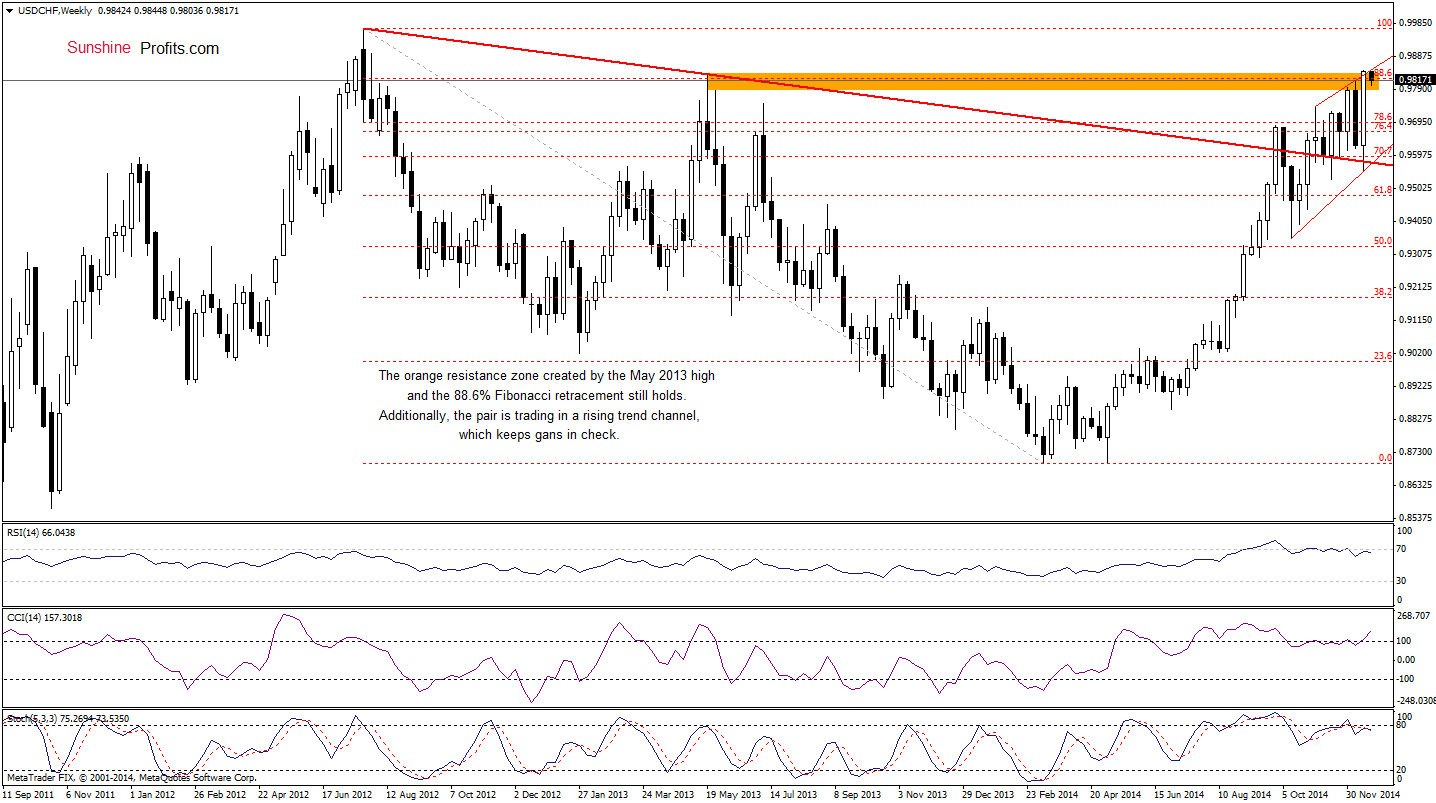
From the medium-term perspective, we see that the orange resistance zone in combination with the upper line of the rising trend channel (marked with red) triggered a pullback, which took the pair below the 88.6% Fibonacci retracement. This is a bearish signal, which suggests that we’ll likely see further deterioration in the coming week. Are there any short-term factor that could support currency bears? Let’s check.
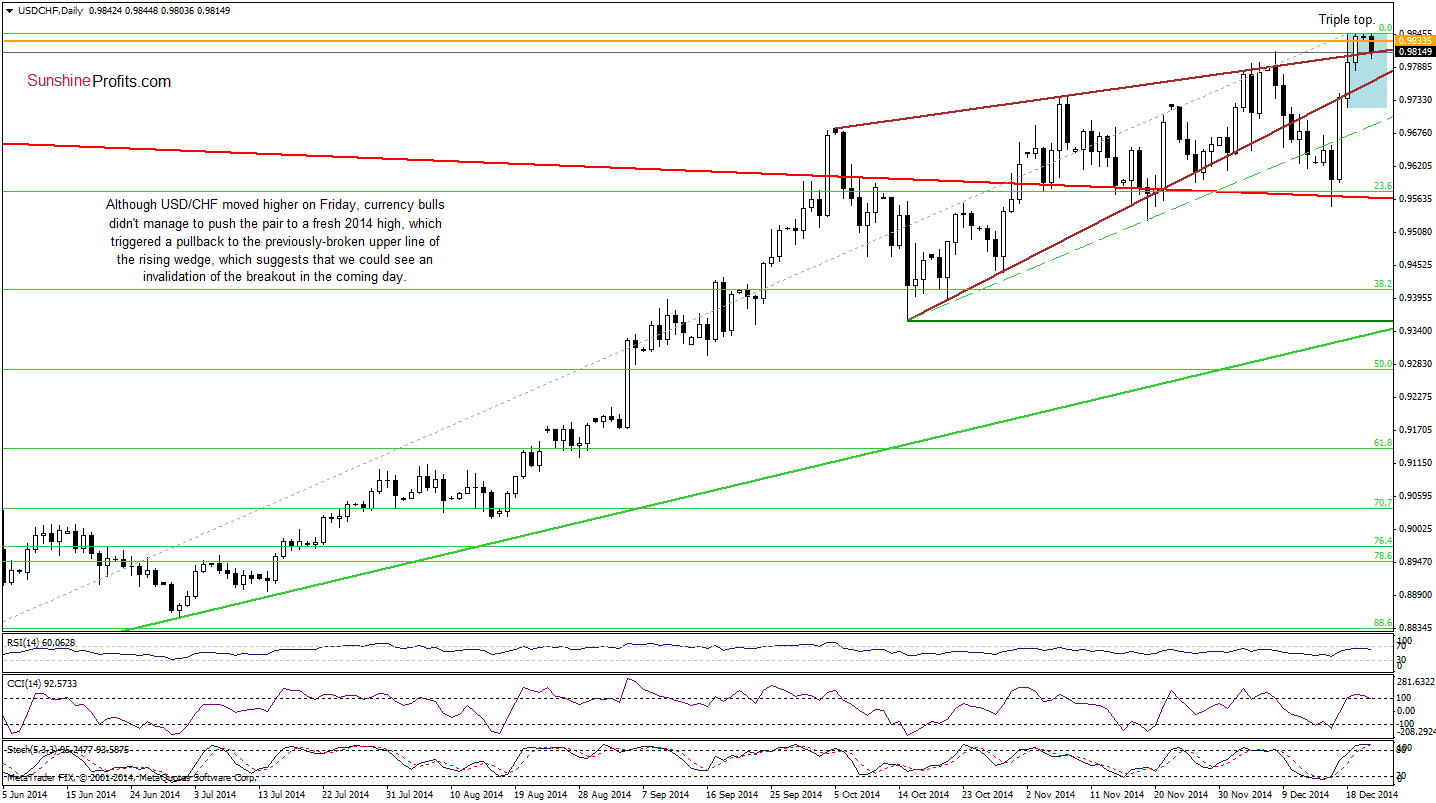
On the above chart, we see that although USD/CHF moved higher on Friday, currency bulls didn’t manage to push the pair to a fresh 2014 high. Earlier today, another attempt to climb higher also failed, which triggered a pullback to the previously-broken upper line of the rising wedge. Taking this fact into account and combining it with the double (or even triple) top and the medium-term picture, we think that the next move will be to the downside. If this is the case, we’ll see an invalidation of the breakout above the upper border of the rising wedge and a test of the lower border of the formation (currently around 0.9765). Finishing today’s commentary on this currency pair, please note that the CCI generated a sell signal, while the Stochastic Oscillator is extremely overbought (over the level of 90), which suggests that a trend reversal is just around the corner.
Very short-term outlook: mixed with bearish bias
Short-term outlook: mixed
MT outlook: mixed
LT outlook: bearish
Trading position (short-term; our opinion): No positions are justified from the risk/reward perspective at the moment. We will keep you informed should anything change, or should we see a confirmation/invalidation of the above.
Thank you.
Nadia Simmons
Forex & Oil Trading Strategist
Przemyslaw Radomski, CFA
Founder, Editor-in-chief
Gold & Silver Trading Alerts
Forex Trading Alerts
Oil Investment Updates
Oil Trading Alerts

