
Yesterday, the USD Index (which tracks the performance of the U.S. currency against a basket of six major currencies) declined, moving away from Monday’s high of $89.56. As a result, USD/CHF extended losses and tested the strength of the key support line. Earlier today, we saw a similar price action. Will it withstand the selling pressure?
In our opinion the following forex trading positions are justified - summary:
EUR/USD
The situation in the medium term hasn’t changed much as EUR/USD is still trading well above the long-term support line and the 88.6% Fibonacci retracement. An invalidation of the breakdown below the latter and its positive impact on the exchange rate is still in effect. Today, we’ll focus on the daily chart.
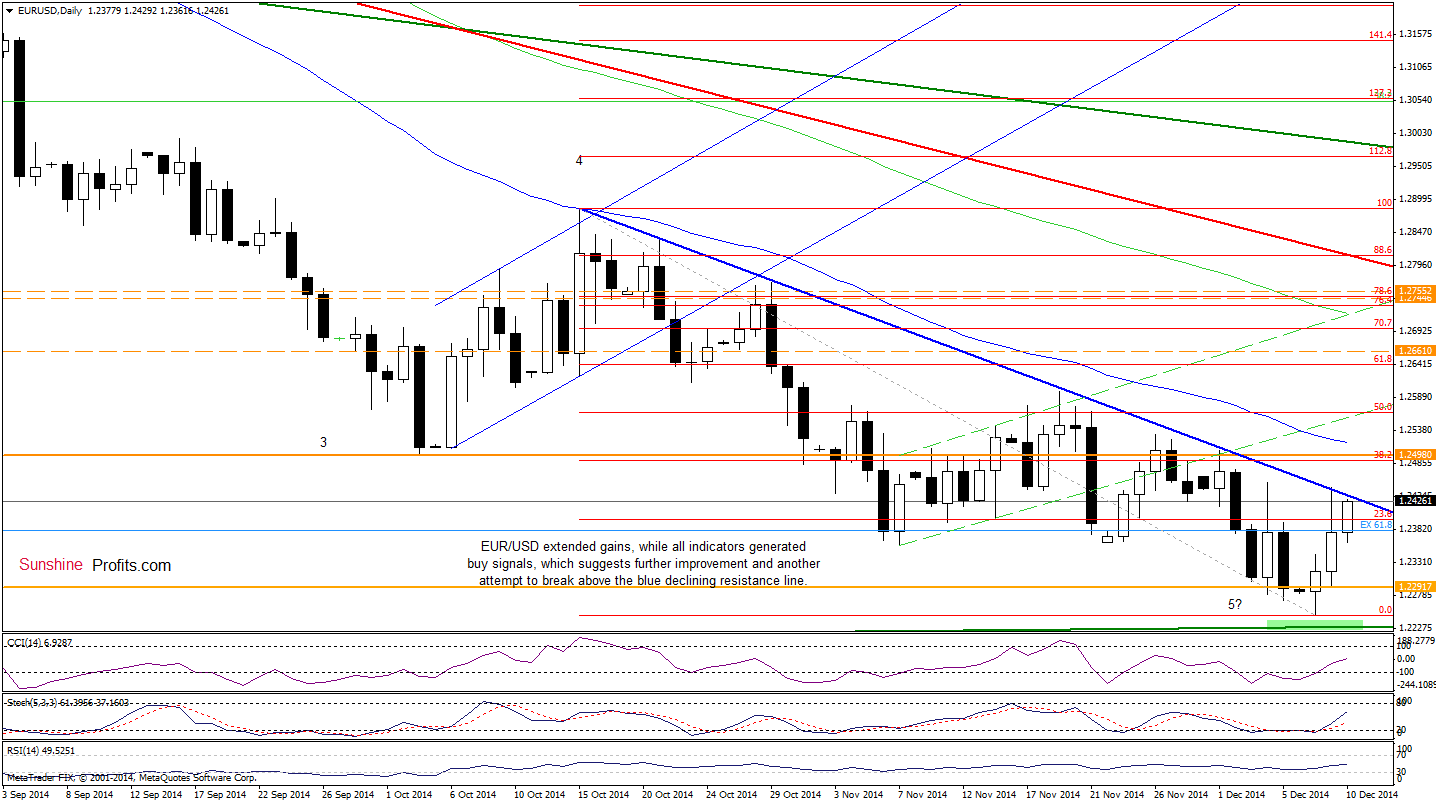
On Monday, we wrote the following:
(…) the breakdown below the previous low and the 127.2% Fibonacci extension was invalidated, which is a positive signal. Additionally, as we mentioned earlier, the long-term support line still holds, which will likely stop further deterioration in the coming week. If this is the case, we’ll see a trend reversal and an increase to (at least) the previously-broken blue declining resistance line, which stopped upswing several times in the recent weeks.
As you see on the above chart, EUR/USD reached our upside target yesterday. Despite this improvement, the blue declining resistance line paused gains – similarly to what we saw in the previous weeks. Although the exchange rate declined in the following hours, currency bulls didn’t give up, which translated to the next upswing to the key resistance line. This means that the chance for a breakout increased, however, as long as there is no daily close above the blue line, another attempt to move lower can’t be ruled out.
Very short-term outlook: bullish
Short-term outlook: mixed with bullish bias
MT outlook: mixed
LT outlook: bearish
Trading position (short-term): In our opinion, no positions are justified from the risk/reward perspective at the moment. However, we’ll consider opening long positions if we see a successful breakout above the key resistance line. We will keep you informed should anything change, or should we see a confirmation/invalidation of the above.
USD/CHF
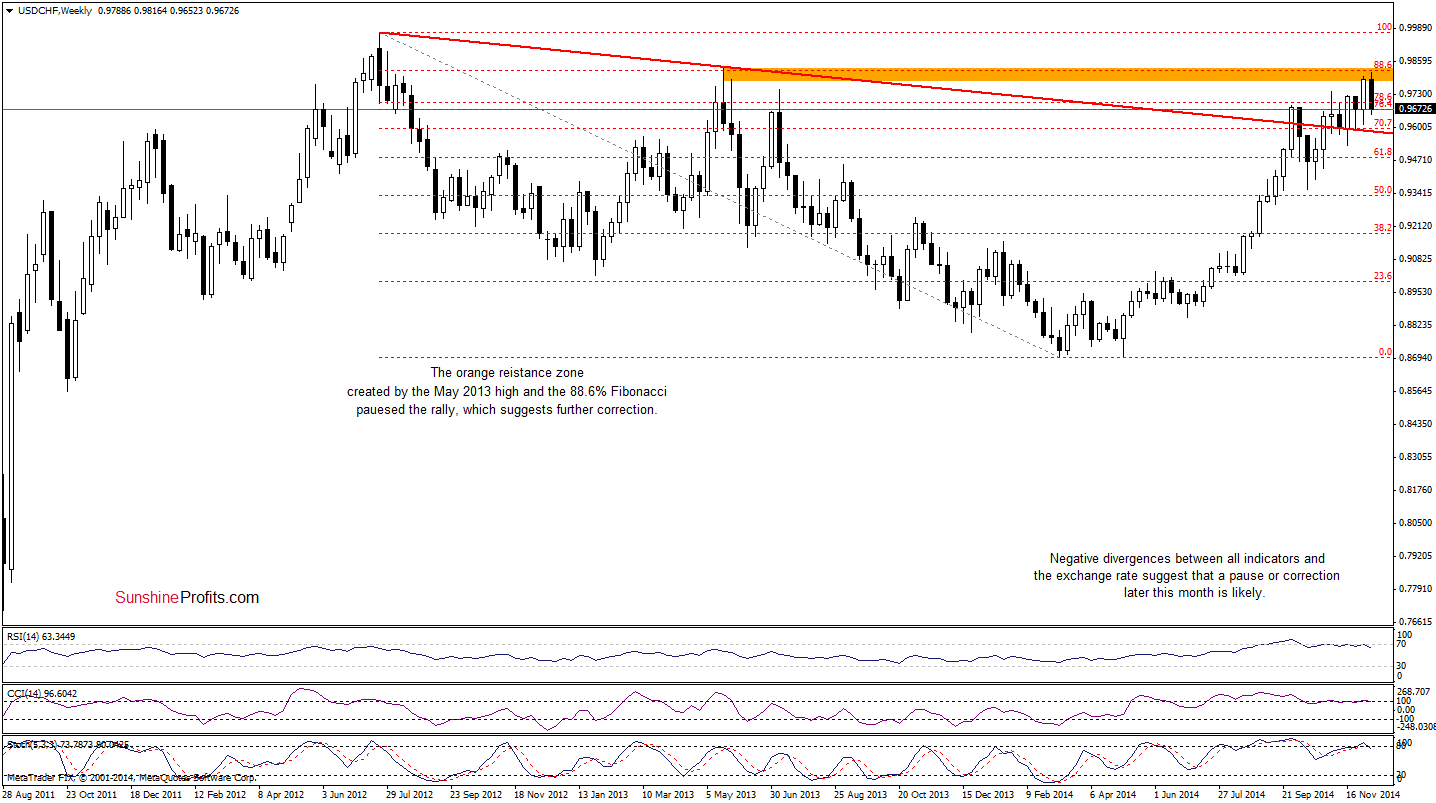
Quoting our Monday’s Forex Trading Alert:
(…) USD/CHF reached our upside target, hitting an intraday high of 0.9816. Although this is a bullish signal, it seems to us that the (…) negative divergences in combination with the very short-term picture, will be strong enough to (at least) pause further improvement.
Looking at the above chart, we see that the USD/CHF reversed and declined as we expected. With this downward move, the pair slipped not only below the Nov high, but also under the 78.6% Fibonacci retracement, which suggests a drop to the long-term red declining support line. However, we think that this scenario will be more likely if the pair drops below the short-term key support line. Let’s move on to the daily chart, to see it more clearly.
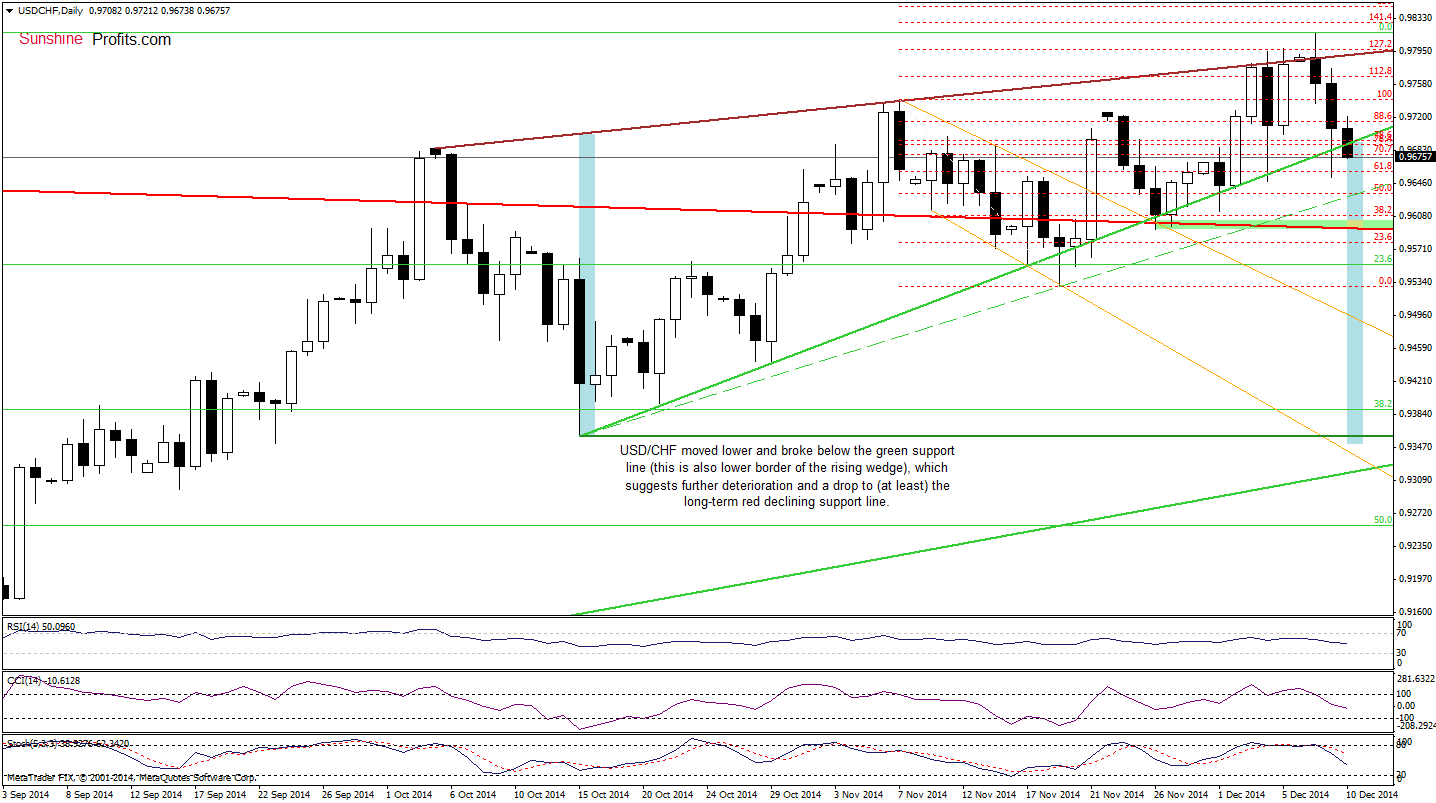
In our last commentary on this currency pair we wrote:
(…) although USD/CHF increased and hit a fresh 2014 high, the pair reversed and declined below the 127.2% Fibonacci extension and the brown resistance line, invalidating earlier breakout above these levels. This is a bearish signal, which suggests further deterioration. If this is the case, the initial downside target would be the green support line (currently around 0.9676).
From this perspective, we see that currency bears realized the above-mentioned scenario and USD/CHF declined to our downside target yesterday. Despite this drop, the pair didn’t move much lower, which resulted in a rebound and invalidation of this small breakdown. Although this is a bullish signal, currency bears didn’t give up and today we saw a similar situation. At the moment when these words are written, the exchange rate is trading below its key support (a bearish sign), however, we think that as long as there is no daily close below this line further deterioration it's not a sure bet. Nevertheless, if we see such price action (this scenario us currently reinforced by the position of the indicators), the next downside target will be the above-mentioned long-term red support line.
Before we move to the next currency pair, we would like to draw your attention to the fact that the green support line is also the lower border of the rising wedge. Therefore, a breakdown below this line suggests that we could see a drop even to around the Oct low of 0.9358. The reason? Slightly below this support, the size of the downward move will correspond to the height of the formation. However, before we see a realization of this potential scenario, currency bears will have to push the pair below 0.9595, where the long-term red support line is.
Very short-term outlook: mixed with bearish bias
Short-term outlook: mixed
MT outlook: mixed
LT outlook: bearish
Trading position (short-term; our opinion): No positions are justified from the risk/reward perspective at the moment. However, we’ll consider opening short positions if we see a confirmation of the above. We will keep you informed should anything change, or should we see a confirmation/invalidation of the above.
AUD/USD
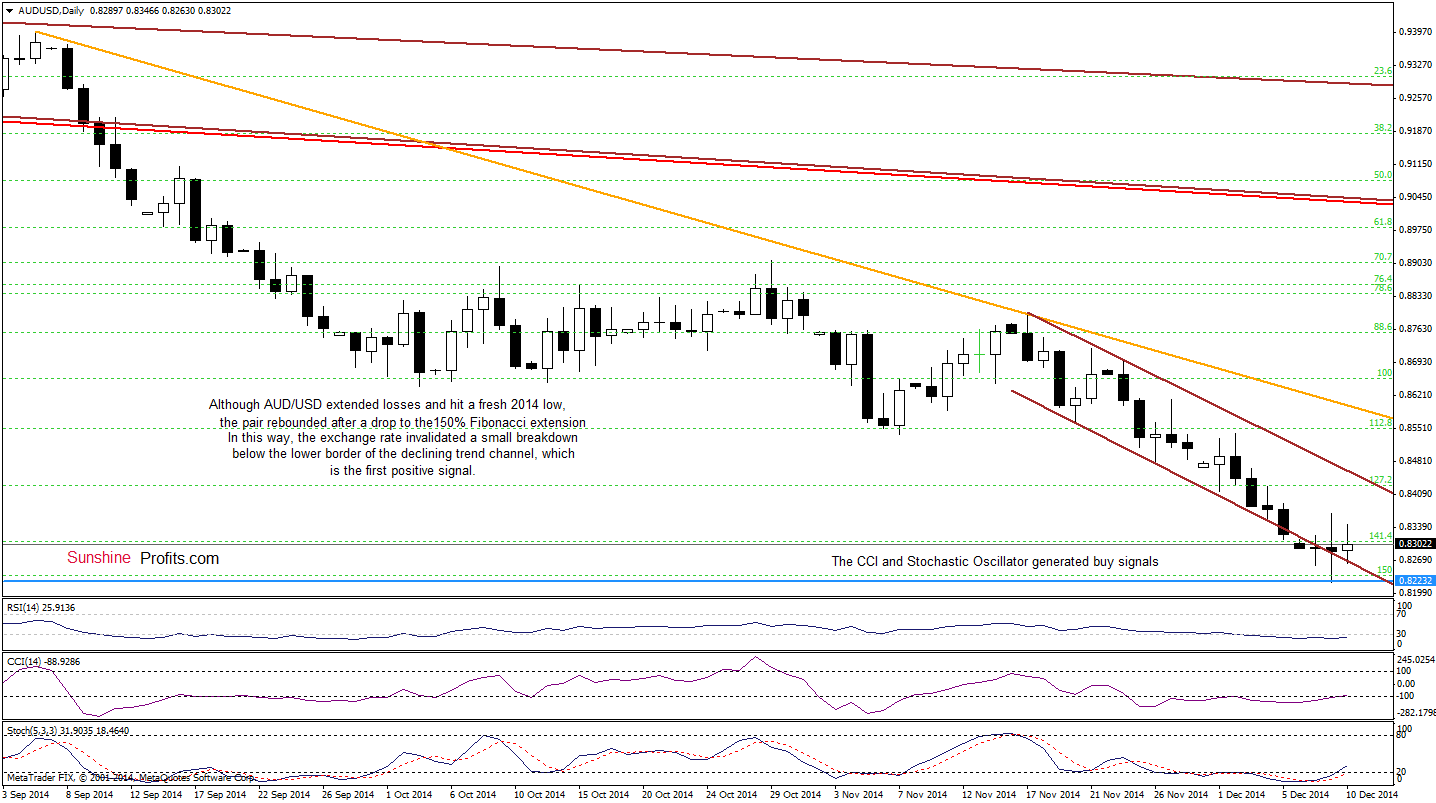
From this perspective, we see that although AUD/USD extended losses and hit a fresh 2014 low, the pair rebounded after a drop to the 150% Fibonacci extension. In this way, the exchange rate invalidated a small breakdown below the lower border of the declining trend channel (the first positive signal), which triggered further improvement (not much, but still). When we take a closer look at the current position of the indicators, we see that the CCI and Stochastic Oscillator generated buy signals (while the RSI is very close to doing this), supporting the bullish case.
Despite all these positive signs, we should keep in mind that the exchange rate is still trading below the previously-broken lower border of the long-term trend channel, which is much stronger signal. However, if there are any factors that could support a rebound from here? Let’s examine the weekly chart and find out.
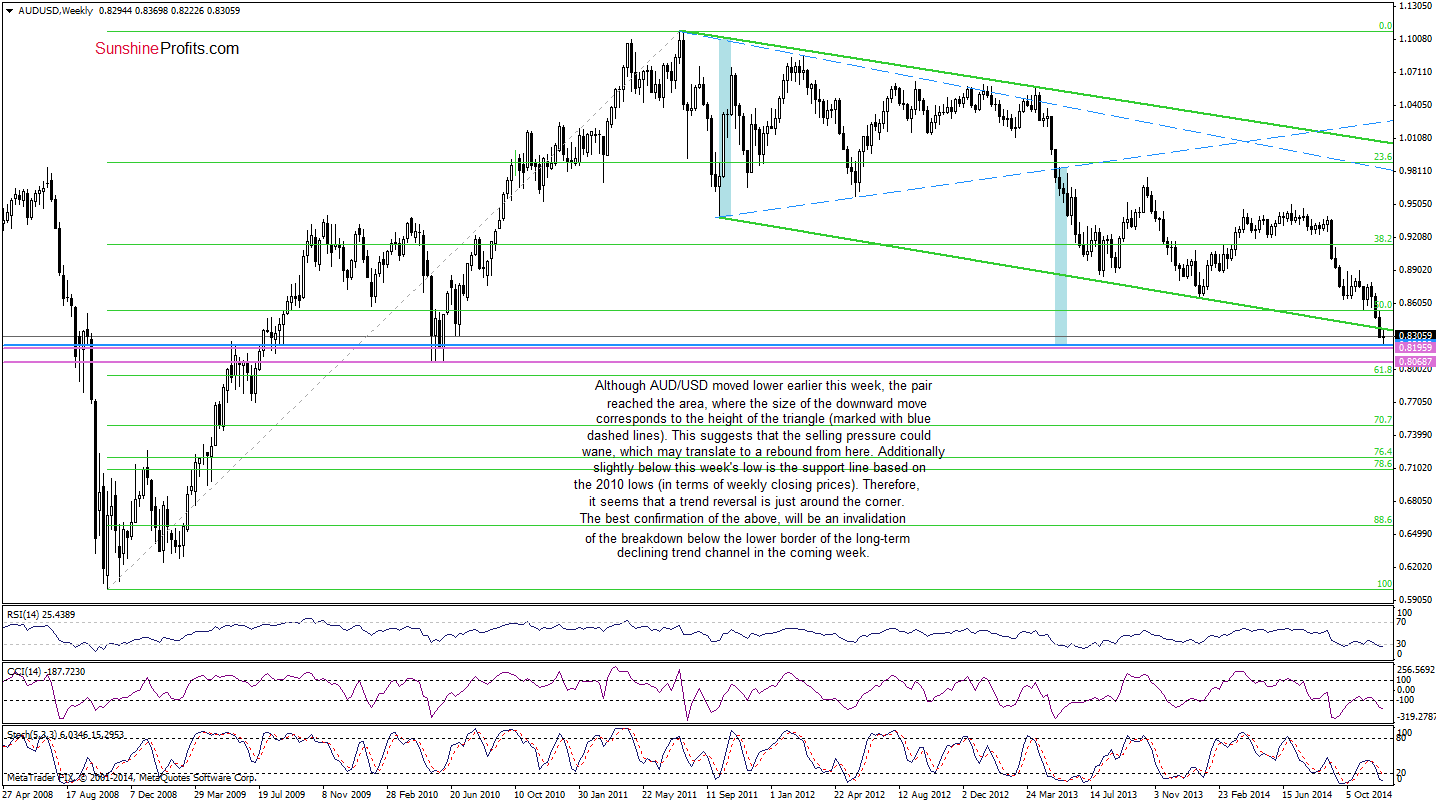
Looking at the above chart, we see that although AUD/USD moved lower earlier this week, the pair reached the area, where the size of the downward move corresponds to the height of the triangle (marked with blue dashed lines). This suggests that the selling pressure could wane, which may translate to a rebound from here. Additionally, slightly below this week’s low is the support line based on the 2010 lows (in terms of weekly closing prices). Therefore, it seems to us that the space for further declines is limited and a trend reversal is just around the corner. Nevertheless, we should keep in mind that the best confirmation of the above will be an invalidation of the breakdown below the lower border of the trend channel. In our opinion, if we see such price action, a sizable upward move will be more likely and reliable. Until this time, waiting on the sidelines for the confirmation that the final bottom is in is the best choice at the moment.
Very short-term outlook: mixed with bullish bias
Short-term outlook: mixed
MT outlook: mixed
LT outlook: mixed
Trading position (short-term): In our opinion, no positions are justified from the risk/reward perspective at the moment. We will keep you informed should anything change, or should we see a confirmation/invalidation of the above.
Thank you.
Nadia Simmons
Forex & Oil Trading Strategist
Przemyslaw Radomski, CFA
Founder, Editor-in-chief
Gold & Silver Trading Alerts
Forex Trading Alerts
Oil Investment Updates
Oil Trading Alerts

