
The Australian Bureau of Statistics reported that construction work done declined by 2.2% in the third quarter, missing analysts’ expectations for a 1.7% fall. In response to this disappointing numbers, AUD/USD moved lower, hitting a fresh 2014 low. Is this event as bearish as it seems at the first glance?
In our opinion the following forex trading positions are justified - summary:
EUR/USD
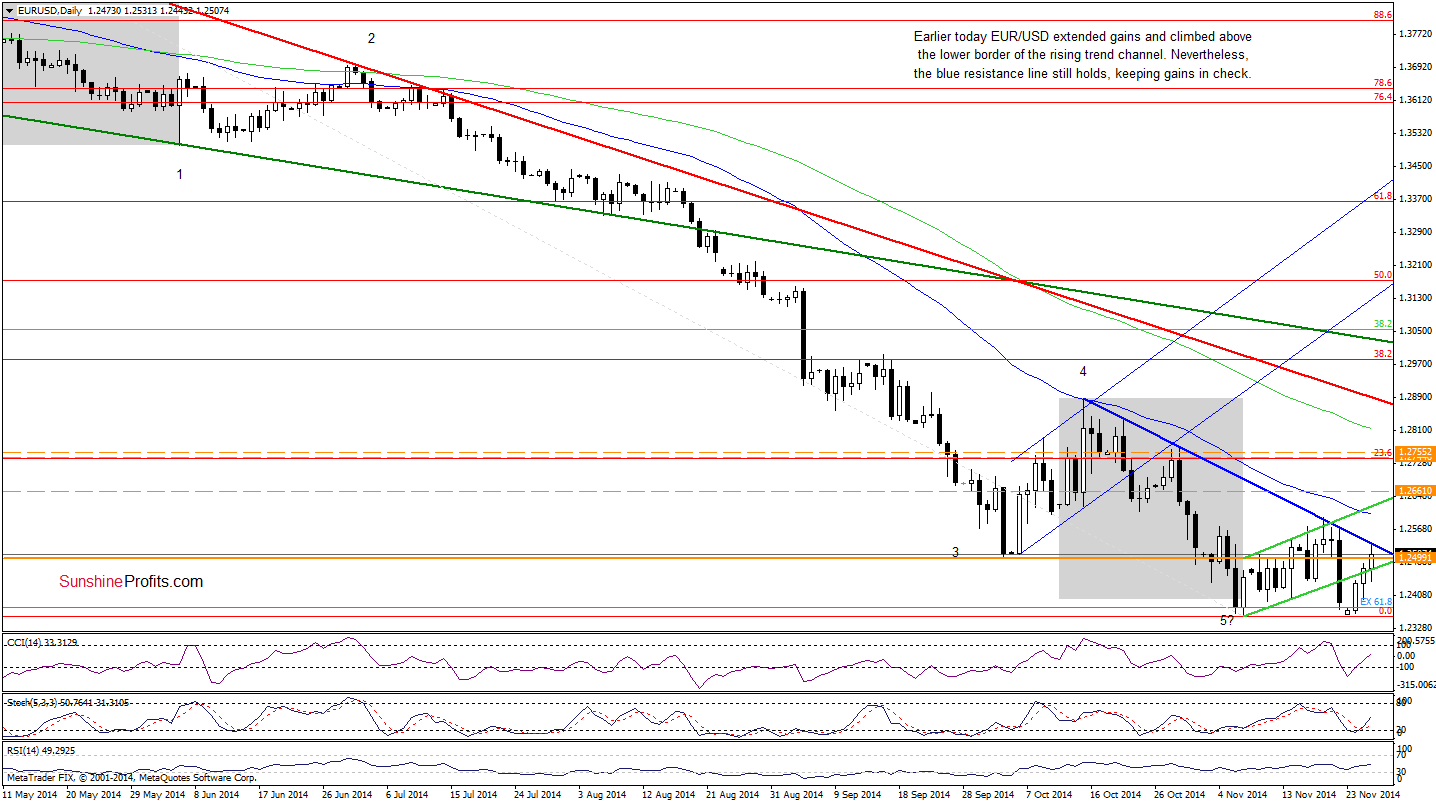
The medium-term picture has improved slightly as EUR/USD bounced off the Nov and last week’s low. Today we’ll focus on the very short-term changes.
On Monday, we wrote the following:
(…) we could see a post double-bottom rally in the coming days (especially when we factor in the current position of the indicators). In our opinion, this scenario will be even more likely if the exchange rate invalidates the breakdown below the previously-broken lower line of the trend channel (currently around 1.2457). If this is the case, the next upside target would be the barrier of 1.2500 and the blue declining resistance line (around 1.2550), which stopped the rally in the previous week.
As you see on the daily chart, the situation developed in line with the above-mentioned scenario as EUR/USD extended gains and reached our upside target. In the previous week (and also in Oct), the blue declining resistance line was strong enough to trigger pullbacks, which suggests that we could see a similar price action in the coming days. However, taking into account the current position of the indicators, it seems to us that this time currency bulls will push the exchange rate higher and the next upside target would be around 1.2600, where the Nov 19 high and the 50-day moving average are.
Very short-term outlook: mixed with bullish bias
Short-term outlook: mixed
MT outlook: mixed
LT outlook: bearish
Trading position (short-term): In our opinion, no positions are justified from the risk/reward perspective at the moment. We will keep you informed should anything change, or should we see a confirmation/invalidation of the above.
USD/CAD
The medium-term outlook remains unchanged as the strong resistance zone created by the upper line of the rising trend channel and the 127.2% Fibonacci extension still holds.
Has anything changed in the very short-term picture? Let’s check.
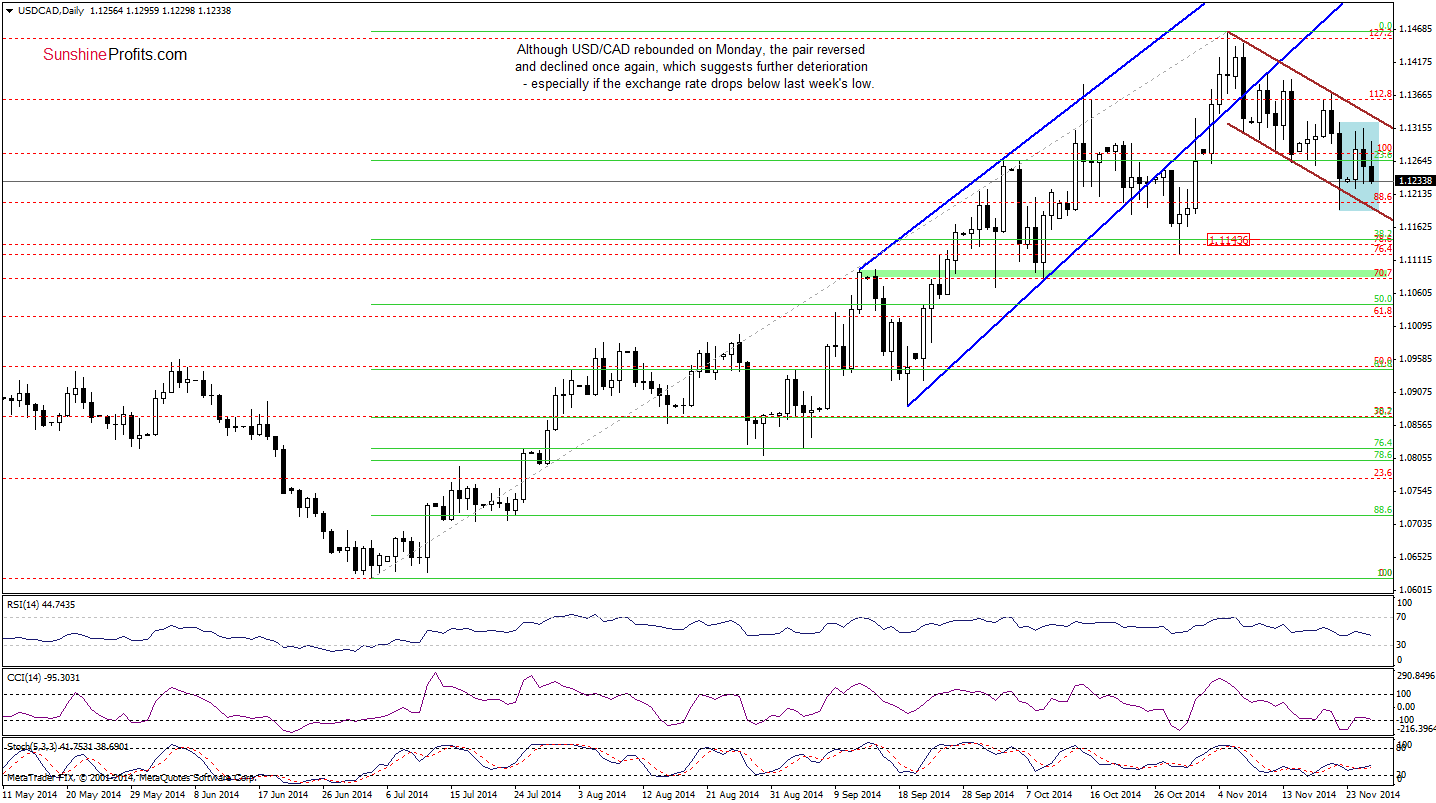
From this perspective, we see that although USD/CAD moved higher on Monday, the proximity to the upper line of the consolidation (marked with blue) and the upper border of the declining trend channel triggered a pullback. In this way, the pair erased almost all Monday’s gains, which suggests further deterioration and a test of the strength of the lower line of the trend channel in the coming days. Please note that even if we see such price action, we think that as long as the exchange rate remains in the trend channel, a bigger upswing or downswing is not likely to be seen. Nevertheless, if the pair drops below its key support, the next downside target would be around 1.1143, where the 38.2% Fibonacci retracement is.
Very short-term outlook: mixed
Short-term outlook: mixed
MT outlook: mixed with bearish bias
LT outlook: bearish
Trading position (short-term; our opinion): No positions are justified from the risk/reward perspective at the moment. We will keep you informed should anything change, or should we see a confirmation/invalidation of the above.
AUD/USD
In our last commentary on this currency pair, we wrote the following:
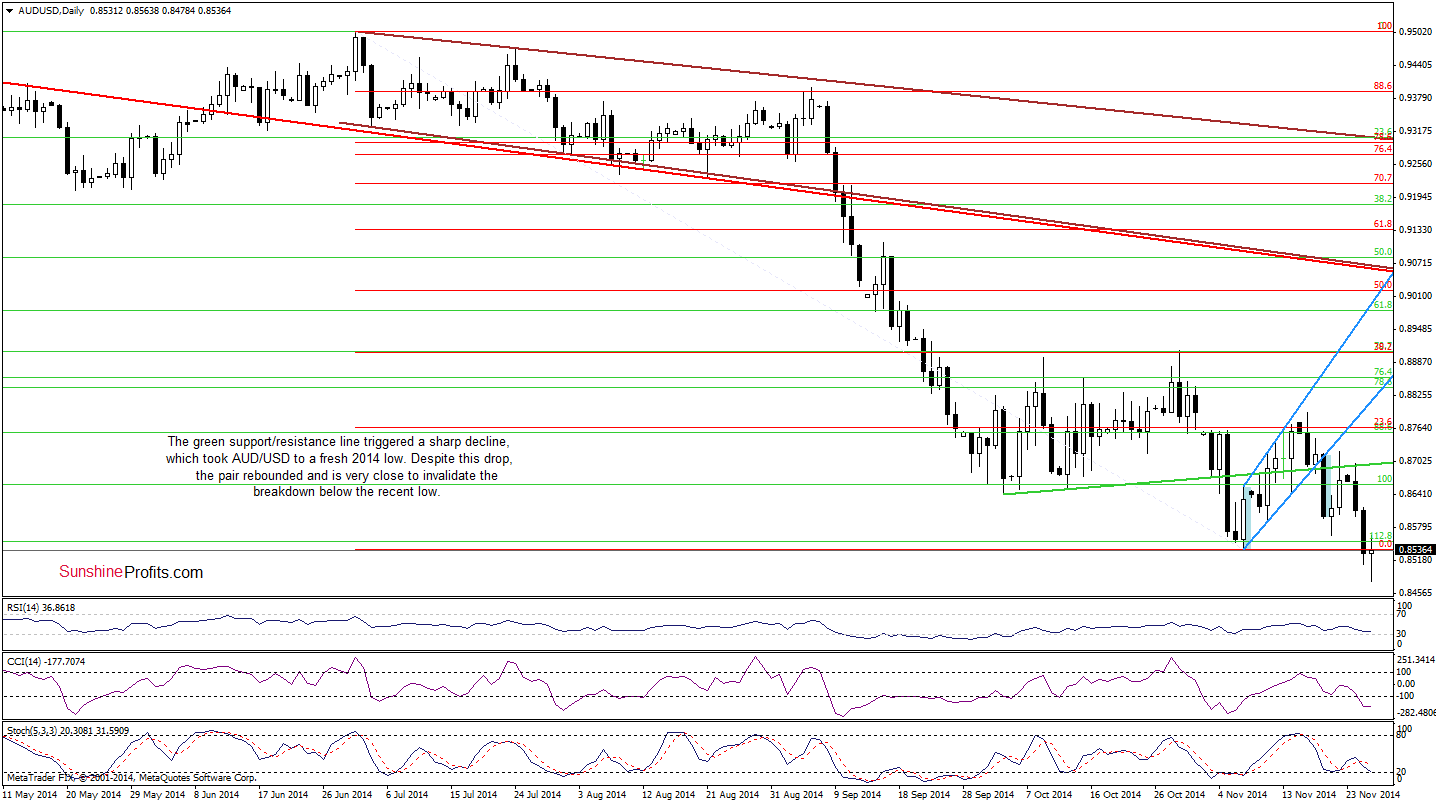
(…) although currency bulls tried to push AUD/USD above the previously-broken green support/resistance line earlier today, they failed once again (similarly to what we saw on Friday). This bearish signal triggered a pullback, which approached the pair to the Friday’s low. At this point, it’s worth noting that the recent days have formed a consolidation, which means that if the exchange rate drops below the lower line of the formation (0.8604), we’ll see a test of the strength of the last week’s low of 0.8565 or even the Nov low in the coming days.
Looking at the daily chart, we see that currency bears not only realized the above-mentioned scenario, but also managed to push the pair to a fresh 2014 low. Although this is a strong negative signal, we should still keep in mind the medium-term picture.
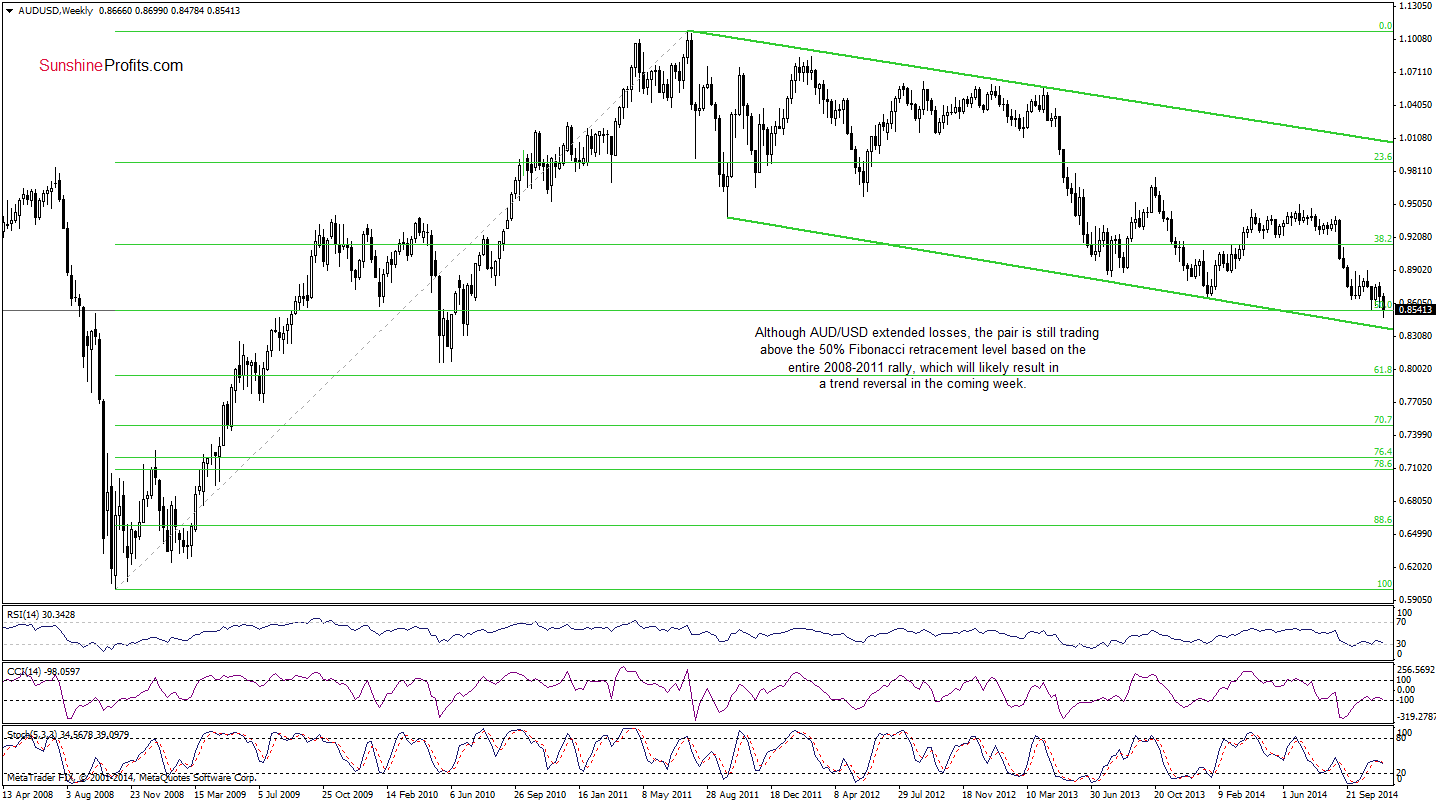
From this perspective, we see that currency bulls have a reliable ally – the 50% Fibonacci retracement based on the entire 2008-2011rally, which means that as long as this key support is in play, further deterioration is not likely. Therefore, despite today’s decline, the exchange rate rebounded sharply and is very close to invalidate the breakdown below the recent lows. If we see an invalidation, it would be a strong positive signal, which will trigger an increase to at least the green key resistance line (currently around 0.8693).
Very short-term outlook: bullish
Short-term outlook: mixed with bullish bias
MT outlook: mixed
LT outlook: mixed
Trading position (short-term): In our opinion, no positions are justified from the risk/reward perspective at the moment. We will keep you informed should anything change, or should we see a confirmation/invalidation of the above.
Thank you.
Nadia Simmons
Forex & Oil Trading Strategist
Przemyslaw Radomski, CFA
Founder, Editor-in-chief
Gold & Silver Trading Alerts
Forex Trading Alerts
Oil Investment Updates
Oil Trading Alerts

