
Earlier today, official data showed that retail sales in Australia increased by 1.2% in September, beating expectations for a 0.4% rise. As a result, AUD/USD bounced off a one-month low and came back above the short-term support. Will we see a post-double bottom rally?
In our opinion the following forex trading positions are justified - summary:
- EUR/USD: none
- GBP/USD: none
- USD/JPY: none
- USD/CAD: none
- USD/CHF: none
- AUD/USD: long (stop-loss order: 0.8587; initial price target: 0.8943)
EUR/USD
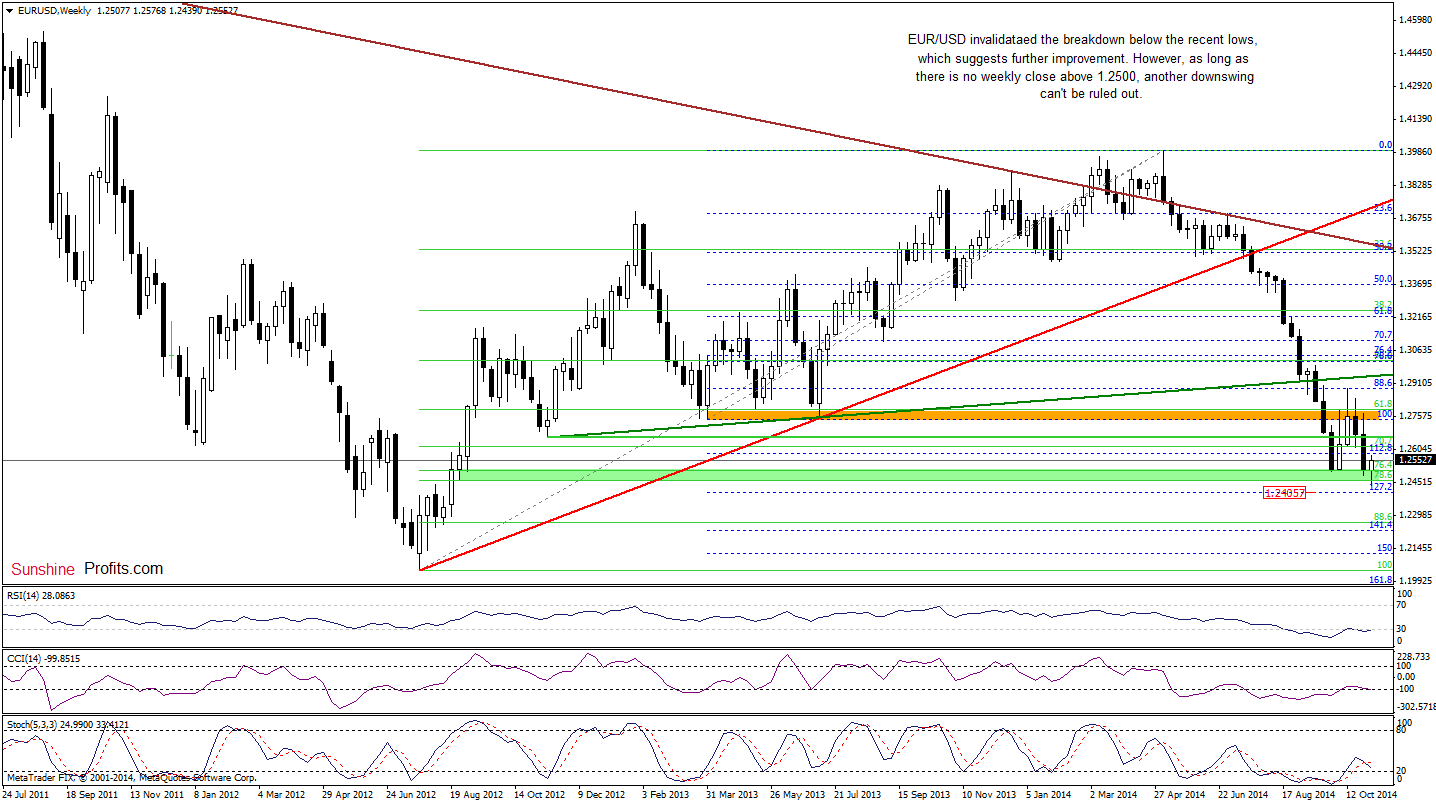
The situation in the medium term has improved slightly as EUR/USD bounced off a multi-month low, invalidating the breakdown below the recent lows. Although this is a bullish signal that suggests further improvement and an increase to at least the orange resistance zone, we should keep in mind that as long as there is no weekly close above 1.2500, another downswing can’t be ruled out.
Once we know the above, let’s move on to the daily chart.
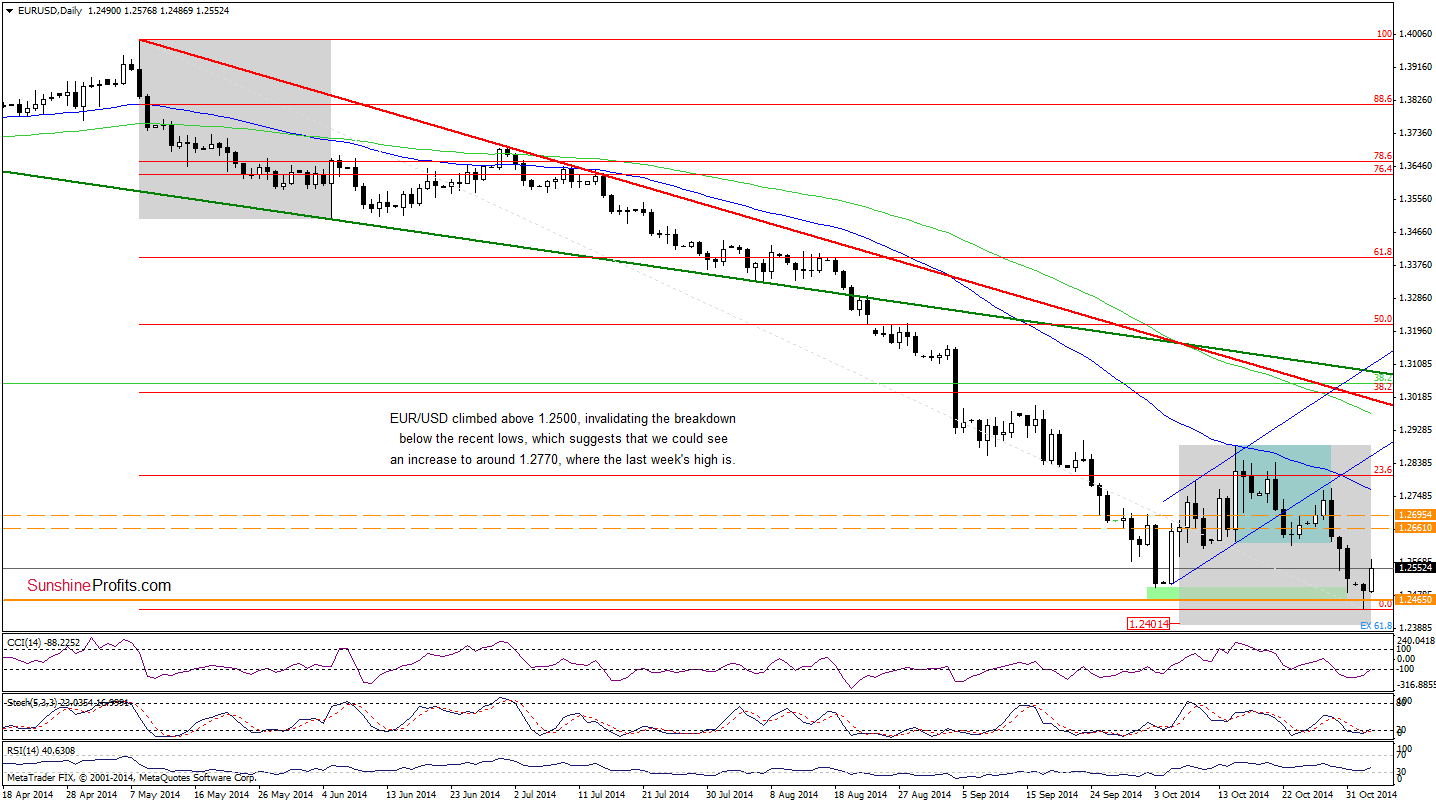
The first thing that catches the eye on the above chart is an invalidation of the breakdown below the recent lows and the barrier of 1.2500. As we mentioned earlier, this is a bullish signal that suggests further increase. If this is the case, the initial upside target would be around 1.2624, where the previously-broken lower border of the consolidation and the 38.2% Fibonacci retracement (based on the Oct 15-Nov 3 decline) are. This scenario is currently reinforced by the position of the indicators, which generated buy signals, supporting the bullish case.
Very short-term outlook: mixed with bullish bias
Short-term outlook: mixed
MT outlook: mixed
LT outlook: bearish
Trading position (short-term): In our opinion, no positions are justified from the risk/reward perspective at the moment. We will keep you informed should anything change, or should we see a confirmation/invalidation of the above.
USD/CHF
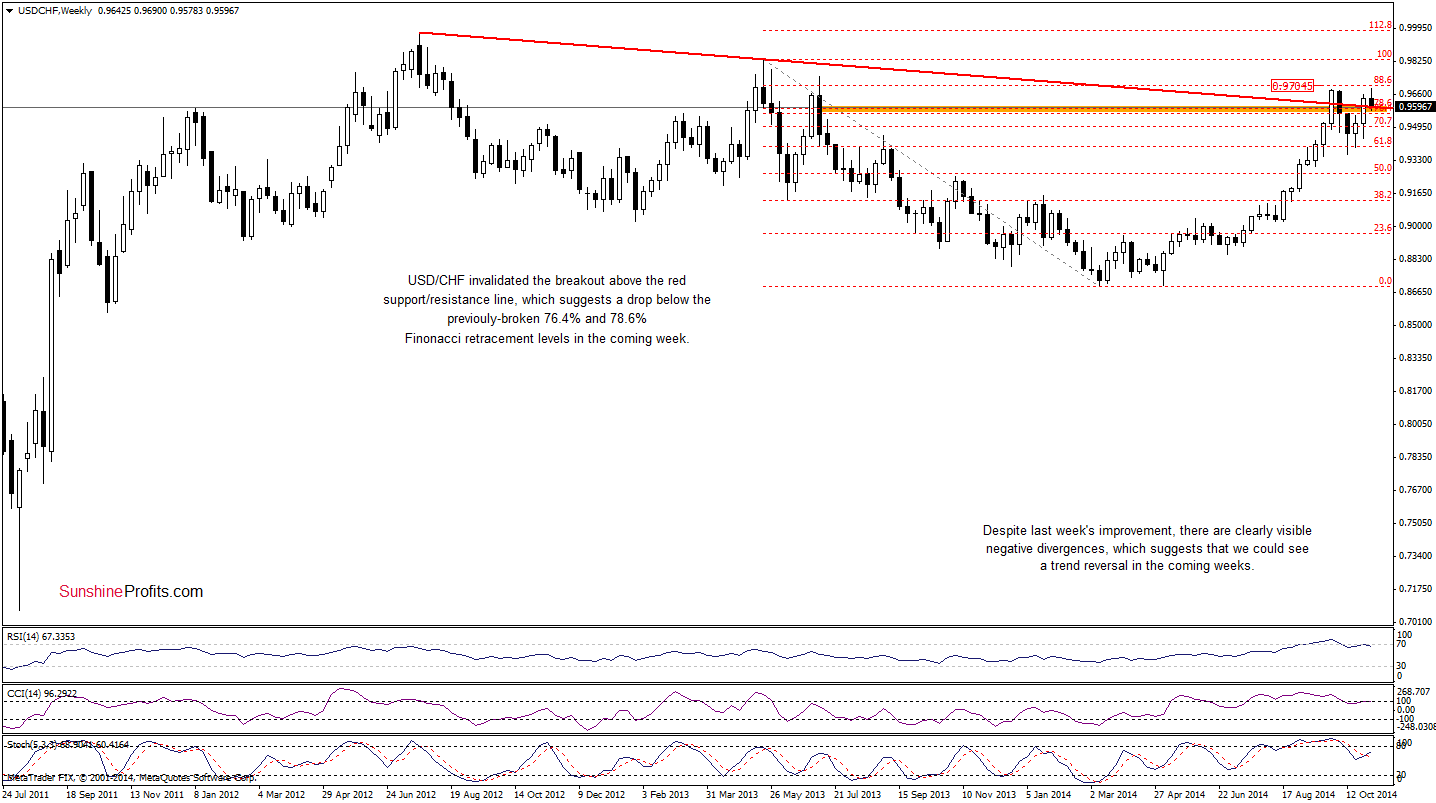
Quoting our last commentary on this currency pair:
(…) USD/CHF (…) climbed above the long-term declining resistance line. Although the pair gave up some gains, the exchange rate is still trading slightly below this line, which suggests that we may see another attempt to move higher. If this is the case, the next upside target would be the Oct 5 high of 0.9686.
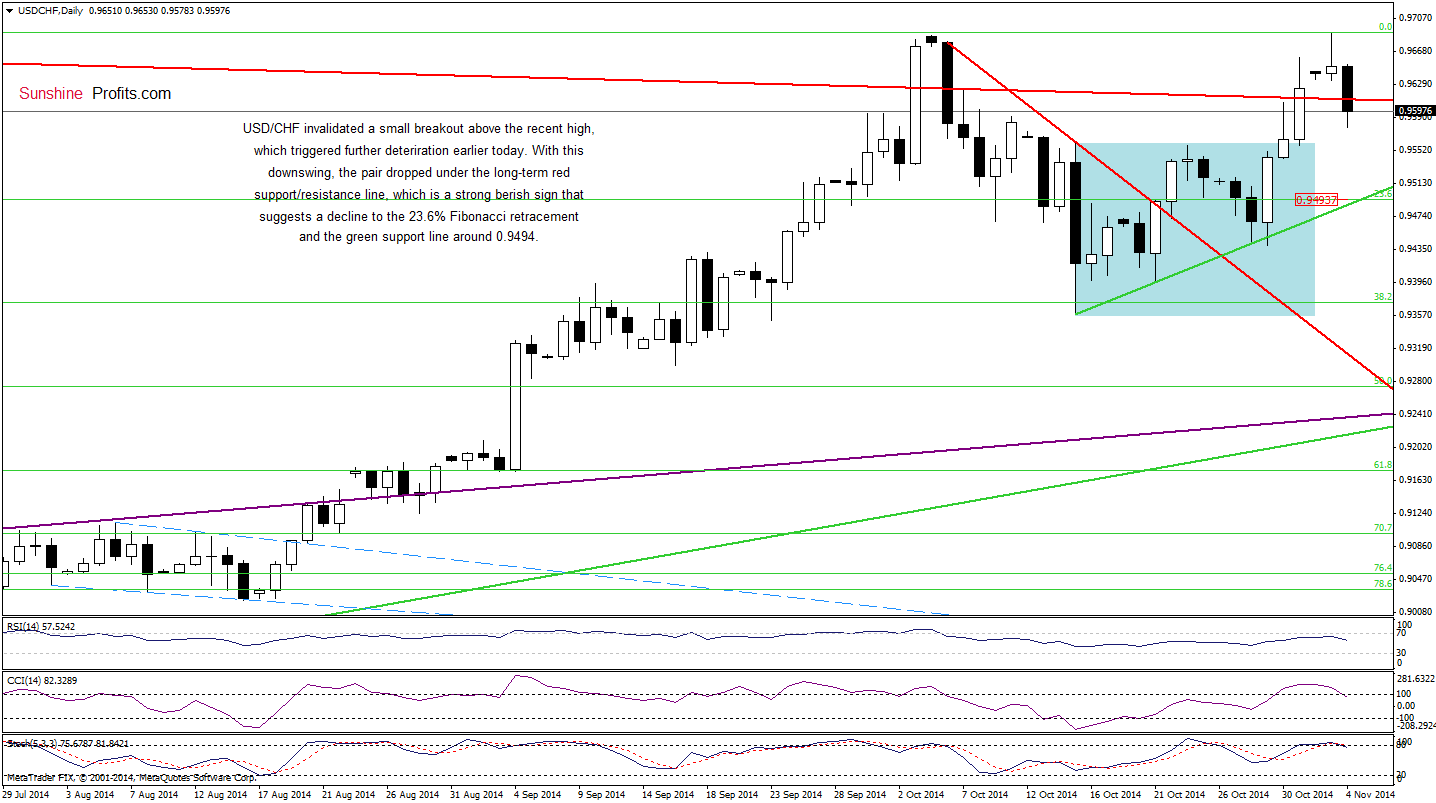
Looking at the above charts, we see that currency bulls not only realized the above-mentioned scenario as we expected, but also pushed the pair to a fresh 2014 high. With this upswing, the exchange rate climbed above the resistance zone (marked on the weekly chart with orange) created by the long-term declining resistance line (based on the Jul 2012 and May 2013 highs) and the 76.4% and 78.6% Fibonacci retracement levels. Despite this solid improvement, USD/CHF reversed and closed yesterday’s session below the previous high. Earlier today, this bearish signal triggered further deterioration and the exchange rate slipped below the long-term support/resistance line (marked with red), invalidating earlier breakout. Additionally, daily indicators (the CCI and stochastic Oscillator) generated sell signals. Taking all the above into account, we think that USD/CHF will move lower in the coming days and the initial downside target will be around 0.9494, where the 23.6% Fibonacci retracement and the green support line are.
Very short-term outlook: bearish
Short-term outlook: mixed with bearish bias
MT outlook: bearish
LT outlook: bearish
Trading position (short-term; our opinion): No positions are justified from the risk/reward perspective at the moment. We will keep you informed should anything change, or should we see a confirmation/invalidation of the above.
AUD/USD
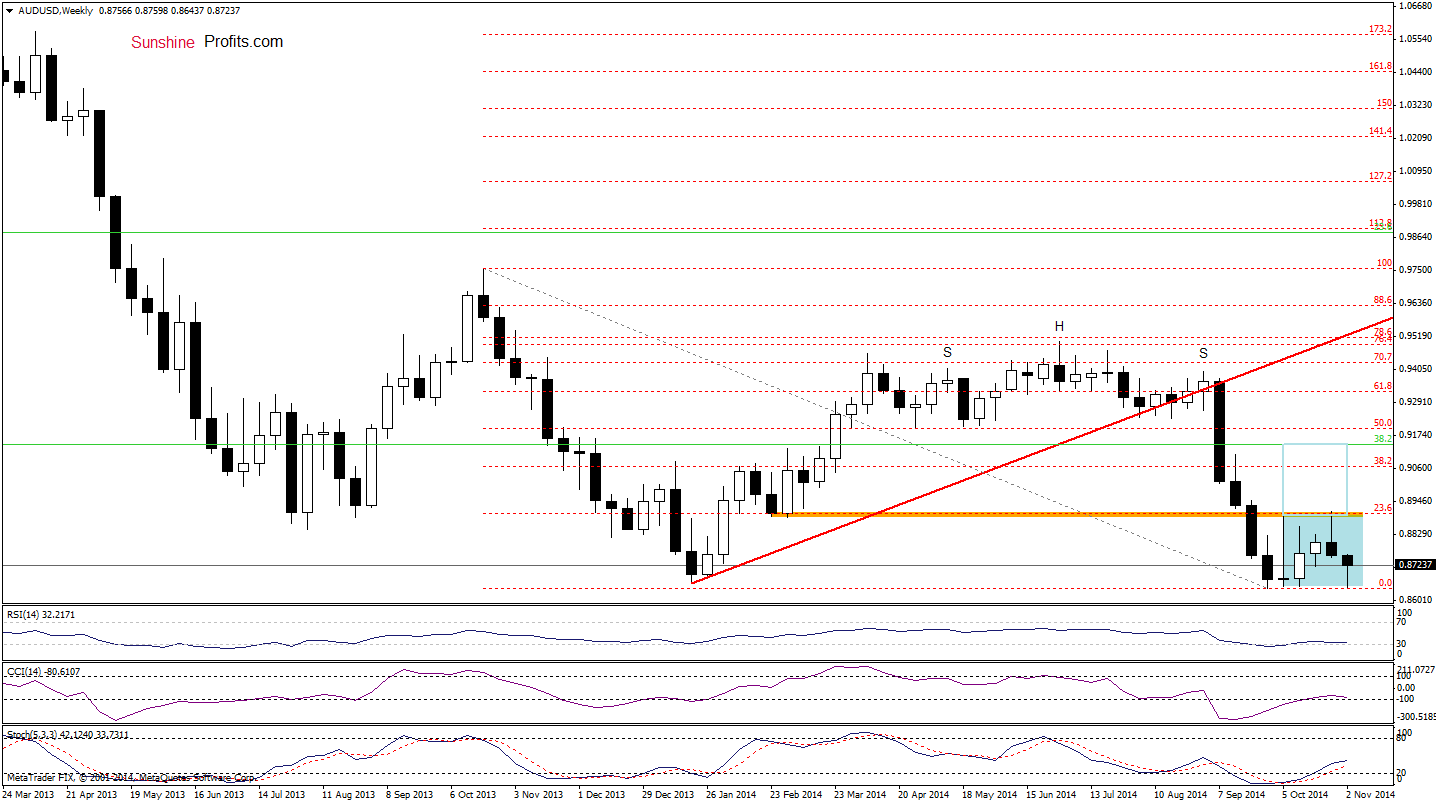
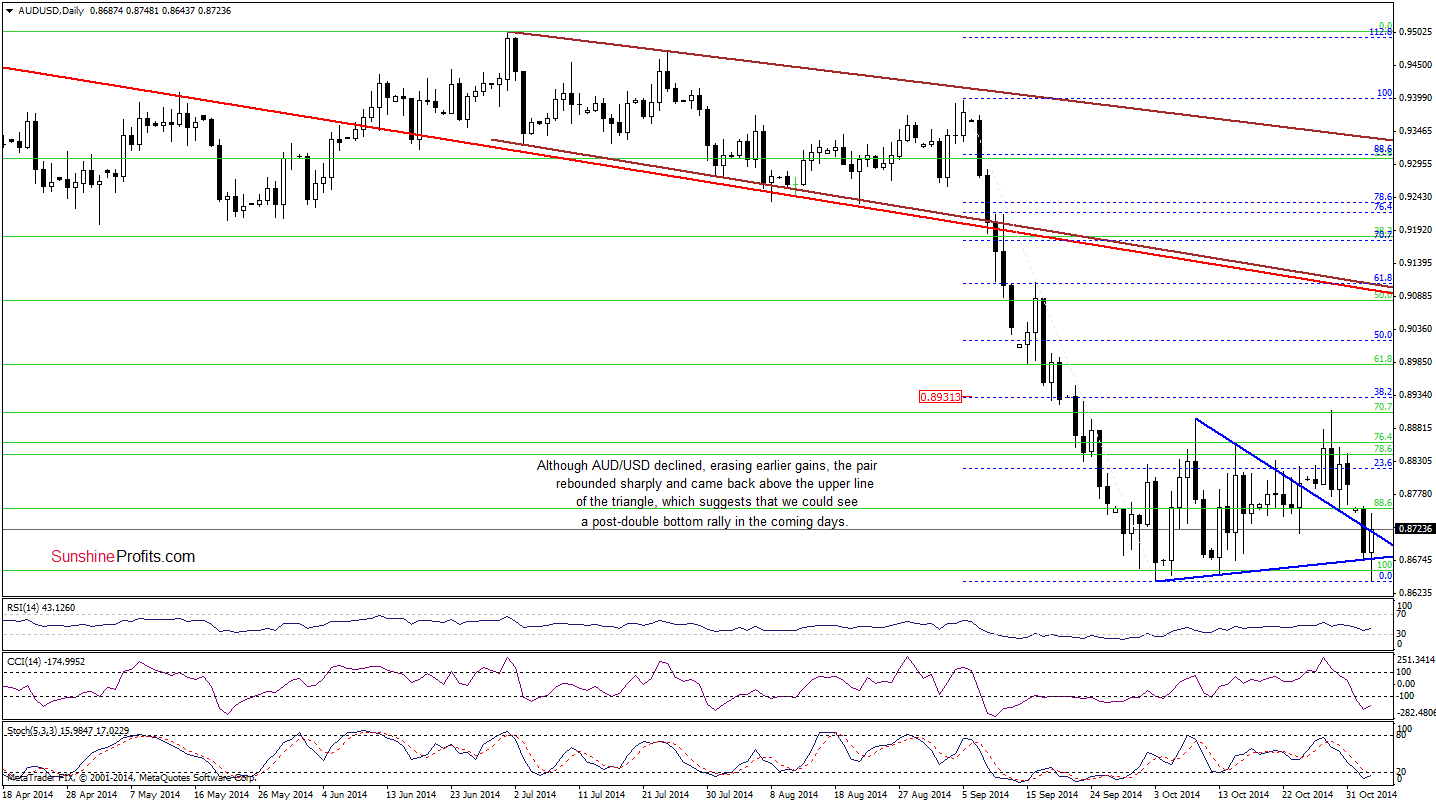
As you see on the above charts, although AUD/USD dropped to the Oct low earlier today, this solid support encouraged currency bulls to act and resulted in a sharp rebound. With this upswing, the exchange rate invalidated the breakdown below the upper line of the triange. This is a bullish signal (it will be even more bullish if the pair closes the day above this support/resistance line), which suggests that we could see a post-double bottom rally in the coming days. If this is the case, the initial upside target will be around 0.8909, where the last week’s high is.
Very short-term outlook: bullish
Short-term outlook: bullish
MT outlook: mixed
LT outlook: bearish
Trading position (short-term; our opinion): Long positions with a stop-loss order at 0.8587 are still justified from the risk/reward perspective at the moment. We will keep you informed should anything change, or should we see a confirmation/invalidation of the above.
Thank you.
Nadia Simmons
Forex & Oil Trading Strategist
Przemyslaw Radomski, CFA
Founder, Editor-in-chief
Gold & Silver Trading Alerts
Forex Trading Alerts
Oil Investment Updates
Oil Trading Alerts

