
Earlier today, the U.K. Office for National Statistics reported that CPI slowed to 1.2% last month from 1.5% in August, while analysts had expected a drop to 1.4% in September. As a result, GBP/USD moved sharply lower, reaching the recent lows. Will we see further deterioration?
In our opinion the following forex trading positions are justified - summary:
- EUR/USD: long (stop-loss order: 1.2560; initial price target: 1.3072)
- GBP/USD: none
- USD/JPY: short (stop-loss order: 110.73; initial price target: 105.20)
- USD/CAD: short (stop-loss order: 1.1360; initial price target: 1.1021)
- USD/CHF: short (stop-loss order: 0.9711; initial price target: 0.9332)
- AUD/USD: long (stop-loss order: 0.8587; initial price target: 0.8943)
EUR/USD
The situation in the medium term hasn’t changed much as EUR/USD is still trading around the Nov 2012 low. Today, we’ll focus on the very short-term changes.
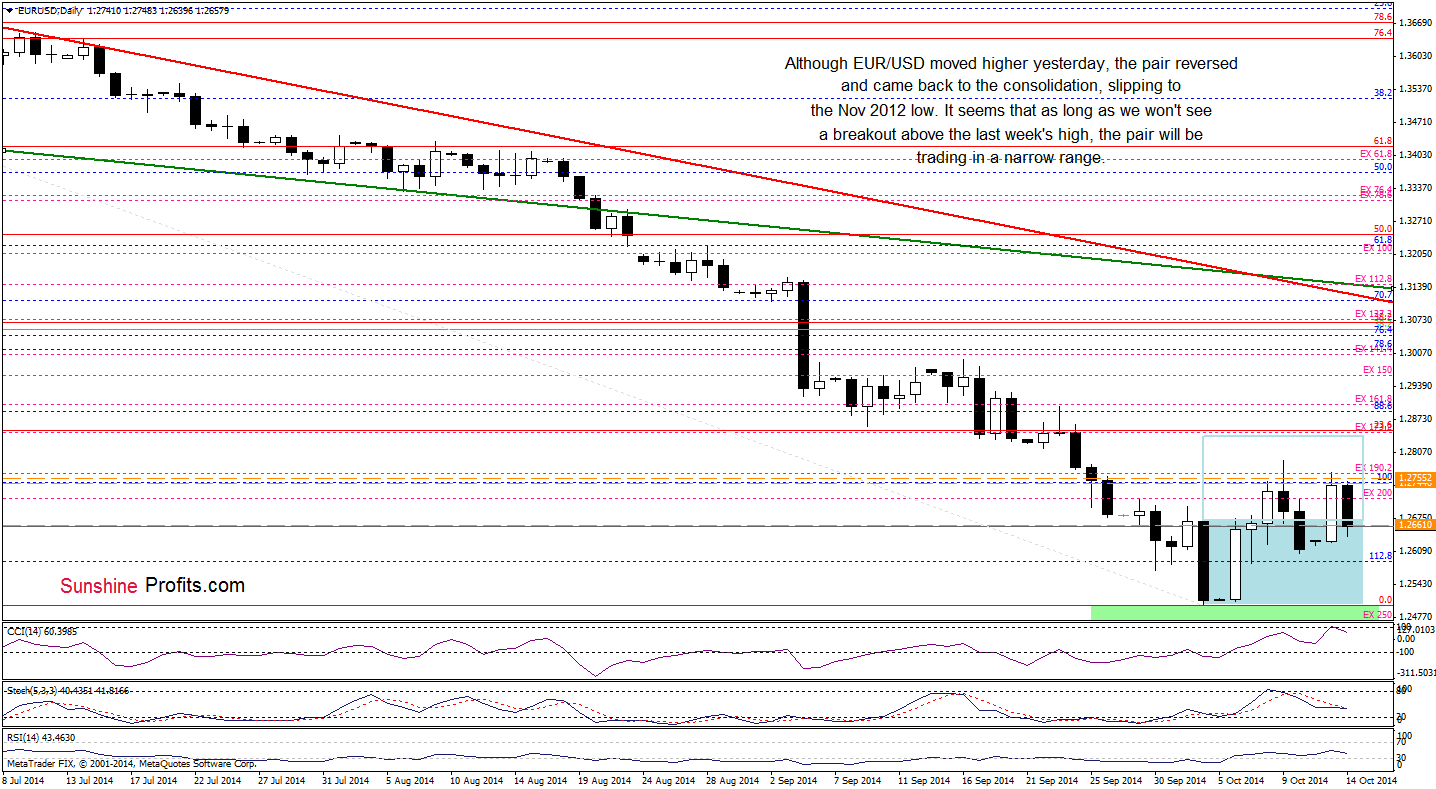
From this perspective, we see that Although EUR/USD moved lower and slipped to the consolidation once again, the very short-term picture also hasn’t changed much as the pair is still trading between the last week’s high and the Oct 10 low. Therefore, it seems that as long as we won’t see a breakout above the Oct 9 high, the exchange rate will be trading in a narrow range. Before we move to the next currency pair, we would like to draw your attention to the position of the CCI. The indicator dropped below the level of 100, generating a sell signal, which may result in a test of the Friday’s low of 1.2605 in the coming day.
Very short-term outlook: bullish
Short-term outlook:mixed with bullish bias
MT outlook: mixed
LT outlook: bearish
Trading position (short-term; in our opinion): Long positions with a stop-loss order at 1.2560 are justified from the risk/reward perspective at the moment. We will keep you informed should anything change, or should we see a confirmation/invalidation of the above.
GBP/USD
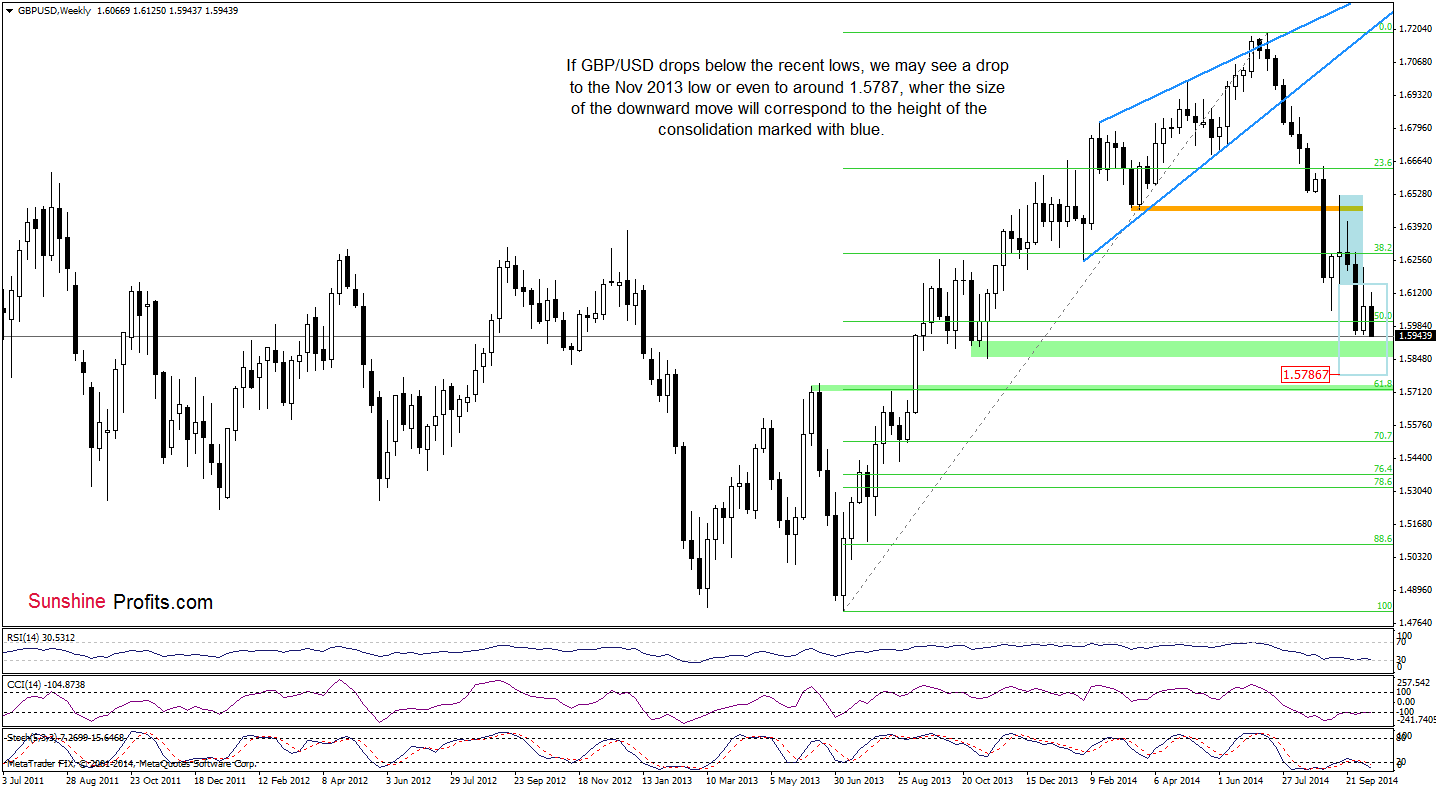
In our last commentary on this currency pair, we wrote that the pair had erased most of the rally and approached the 50% Fibonacci retracement, which was a negative sign. As you see, currency bulls failed and the pair not only dropped below this support level, but also slipped to the recent lows. If GBP/USD moves lower, we may see a drop to the Nov 2013 low or even a decline to around 1.5787, where the size of the downward move will correspond to the height of the consolidation (marked with blue).
Are there any short-term factors that could stop currency bears’ charge? Let’s examine the daily chart and find out.
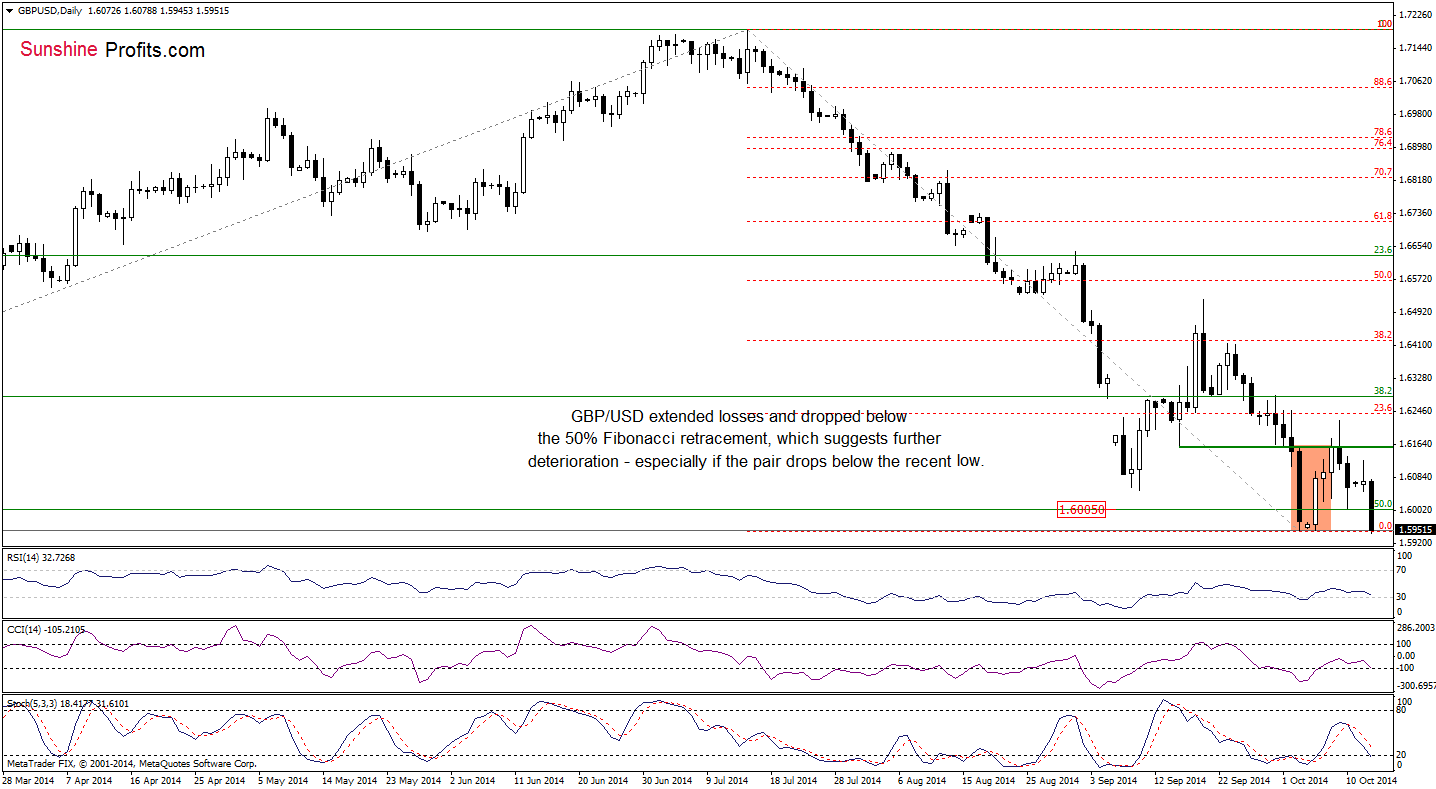
From this perspective, we see that although all indicators generated buy signals in the previous week, the RSI and CCI reversed, while the Stochastic Oscillator generated a sell signal, supporting the bearish case. Taking the above into account and combining it with the medium-term picture, it seems that we’ll see further deterioration and a drop to the one of the above-mentioned downside targets.
Very short-term outlook: bearish
Short-term outlook: mixed with bearish bias
MT outlook: mixed
LT outlook: mixed
Trading position (short-term): In our opinion, no positions are justified from the risk/reward perspective. We will keep you informed should anything change, or should we see a confirmation/invalidation of the above.
USD/JPY
The medium-term picture has deteriorated slightly as USD/JPY extended declined. Where did the exchange rate reach? Let’s take a look at the daily chart.
In our Forex Trading Alert posted on Oct 6, we wrote the following:
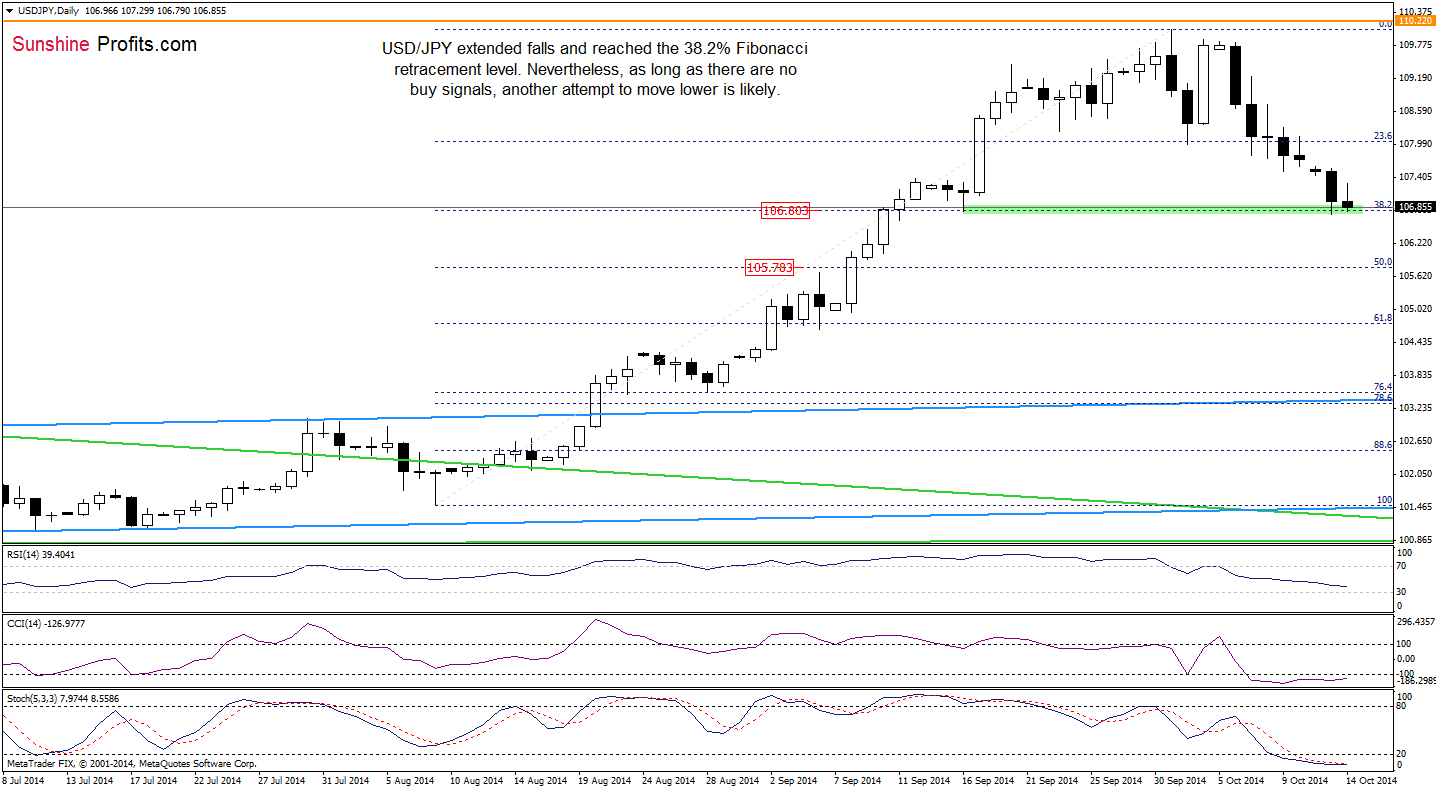
(…) the next target for currency bears will be around 106.80, where the 38.2% Fibonacci retracement and the bottom of the correction that we saw in mid-Sep is.
As you see on the daily charts, the situation developed in line with the above-mentioned scenario and the USD/JPY reached our downside target. Where the pair head next? Although the 38.2% Fibonacci retracement coud trigger an upswing from here, we still think that further deterioration is just around the corner as sell signals generated by the weekly indicators remain in place (as a reminder, a similar situation at the beginning of the year triggered a significant decline). If this is the case, and the pair moves lower, the next downside target will be around 105.78, where the 50% Fibonacci retracement level is.
Very short-term outlook: bearish
Short-term outlook: mixed with bearish bias
MT outlook: mixed
LT outlook: bearish
Trading position (short-term; our opinion): Short positions with a stop-loss order at 110.23 are justified from the risk/reward perspective at the moment. We will keep you informed should anything change, or should we see a confirmation/invalidation of the above.
Thank you.
Nadia Simmons
Forex & Oil Trading Strategist
Przemyslaw Radomski, CFA
Founder, Editor-in-chief
Gold & Silver Trading Alerts
Forex Trading Alerts
Oil Investment Updates
Oil Trading Alerts

