
Although the demand for the U.S. dollar waned as concerns over geopolitical tensions in Ukraine and the Middle East began to ease, EUR/USD is still trading below the key level of 1.3400. Will currency bulls manage to successfully push the exchange rate above it in the coming days?
In our opinion the following forex trading positions are justified - summary:
EUR/USD
The situation in the medium term hasn’t change much as EUR/USD is still trading slightly above the green support zone. Today, we’ll focus on the daily chart.
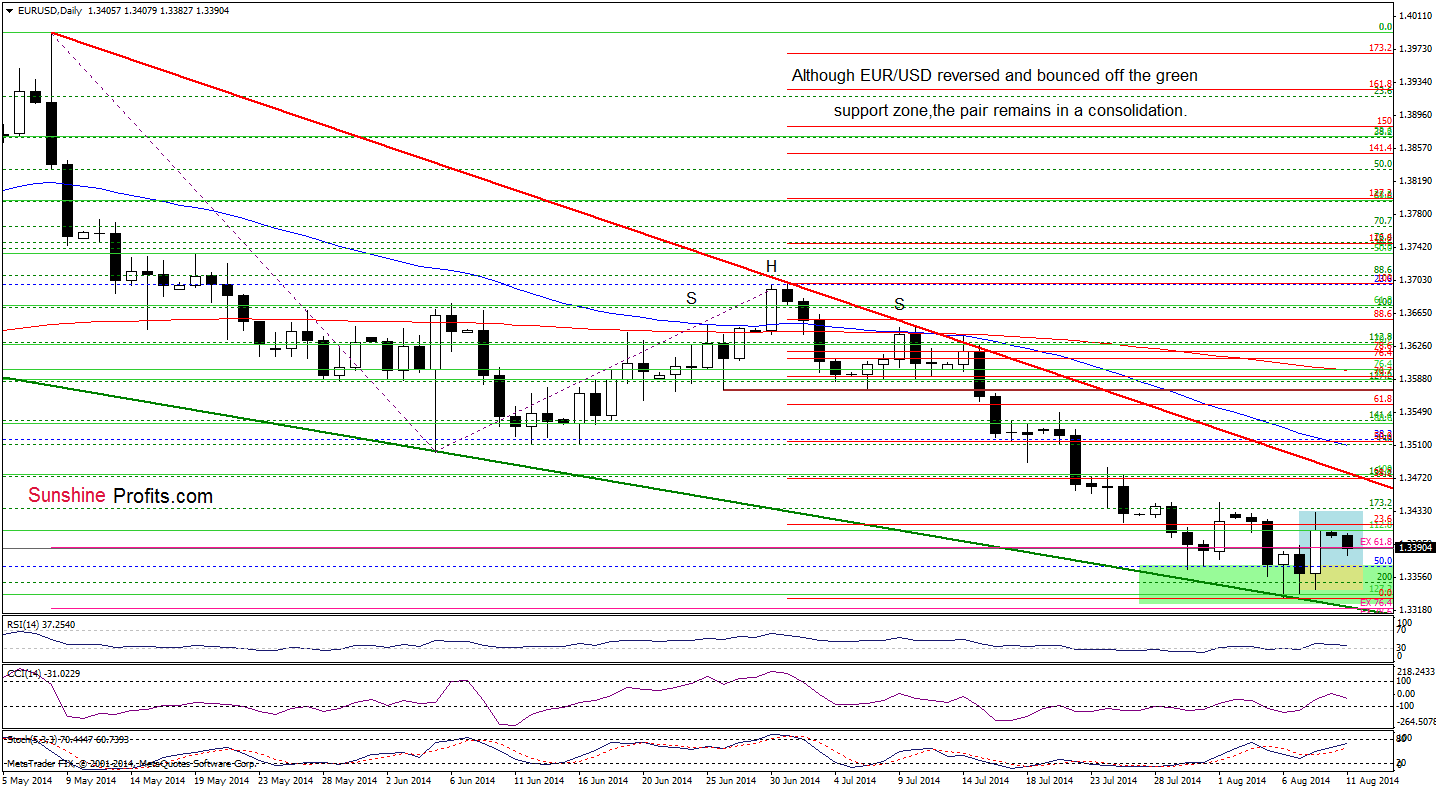
The first thing that catches the eye on the above chart is a declining wedge created by the red resistance (based on the May and July highs) and green support lines. As you see, the upper line of the formation is reinforced by the 38.2% Fibonacci retracement based on the recent declines and the lower border intersects the green support zone. Therefore, even if we see a breakout above the upper line of the consolidation (or a breakdown below the lower border), the space for further moves will be limited by one of these lines. Taking this fact into account, we are convinced that as long as there is no breakout or breakdown above/below one of these areas, another sizable move is not likely to be seen.
Very short-term outlook: mixed
Short-term outlook: mixed
MT outlook: mixed
LT outlook: bearish
Trading position (short-term): In our opinion no positions are justified from the risk/reward perspective. We will keep you informed should anything change, or should we see a confirmation/invalidation of the above.
USD/CAD
The situation in the medium term hasn’t changed much as USD/CAD remains between last week’s high and low. Today, we’ll examine the very short-term chart to look for clues about future moves.
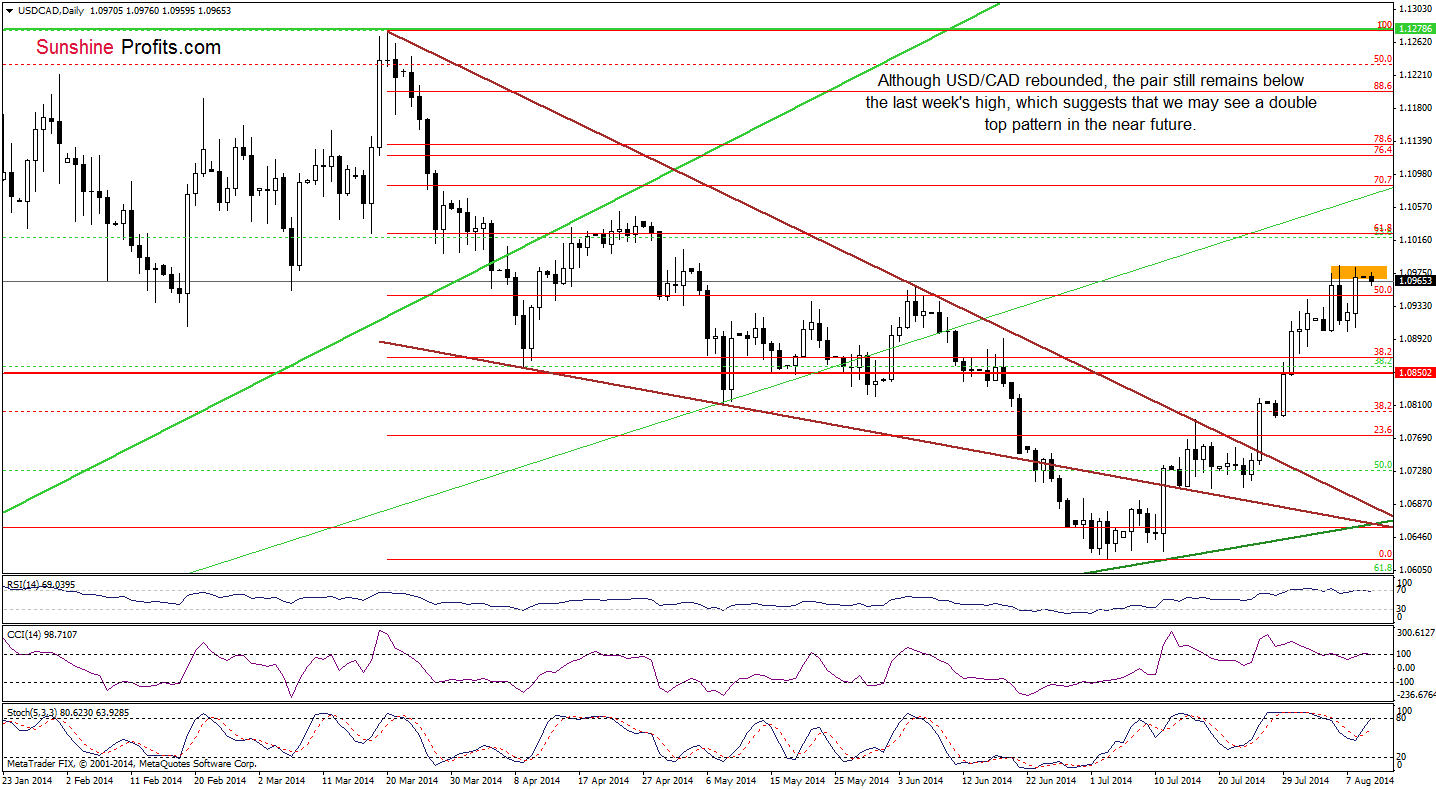
Looking at the above chart, we see that USD/CAD moved higher on Friday, but the pair didn’t break above the last week’s high, which suggests that if the exchange rate extends losses, we may see a double top formation (this bearish pattern will be confirmed, if the pair drops below the bottom of the recent correction at 1.0902). If this is the case, we’ll see further deterioration and a decline to around 1.0820, where the size of the downswing will correspond to the height of the formation. At this point, it’s worth noting that before currency realize this scenario, they will have to push USD/CAD below the 38.2% Fibonacci retracement (around 1.0844) based on the entire June-Aug rally. What can we infer from the indicators? There are clearly visible negative divergences between the CCI, Stochastic Oscillator and the exchange rate, while the RSI dropped below the level of 70, generating a sell signal. All the above provide us with bearish implication and suggests that the lower values of USD/CAD are just around the corner.
Very short-term outlook: bearish
Short-term outlook: mixed with bearish bias
MT outlook: mixed
LT outlook: bearish
Trading position (short-term): In our opinion no positions are justified from the risk/reward perspective. We will keep you informed should anything change, or should we see a confirmation/invalidation of the above.
AUD/USD
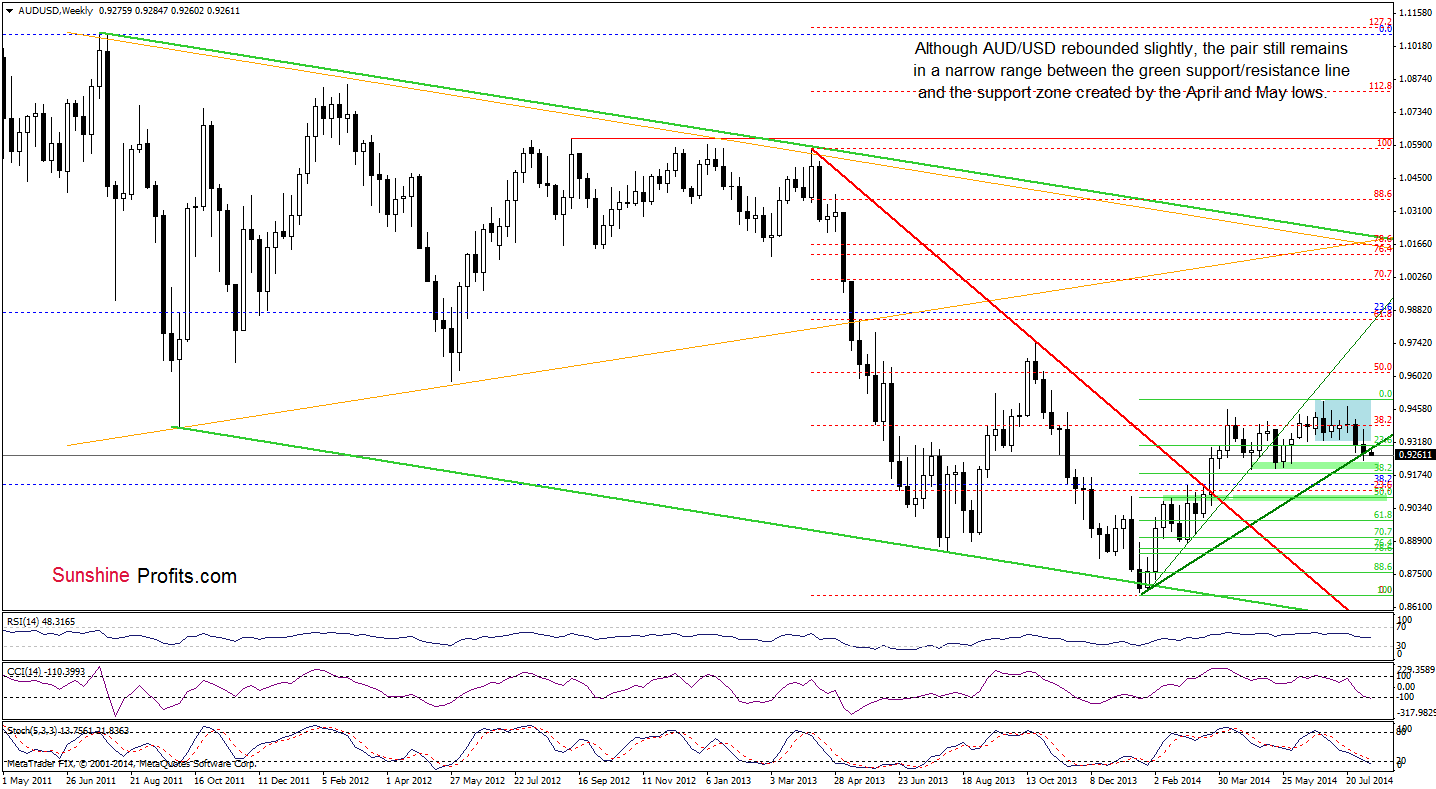
On the above chart, we see that although AUD/USD rebounded slightly, the pair still remains below the previously-broken long-term green line. From this perspective, the upswing looks like a veryfication of the breakdown, which doesn't bode well and suggests that we’ll see another test of the strength of the support zone created by the April, May and June lows. If this area encourages forex traders to push the buy button, we’ll see one more try to comeback above the key support/resistane line. However, if it is broken, the medium-term outlook turns to bearish and we’ll see a drop to the 38.2% Fibonacci retracement (at 0.9180) or even to around 0.9081, where next support zone (created by February highs and the 50% Fibonacci retracement based on the entire 2014 rally) is.
Having say that, let’s take a closer look at the very short-term changes.
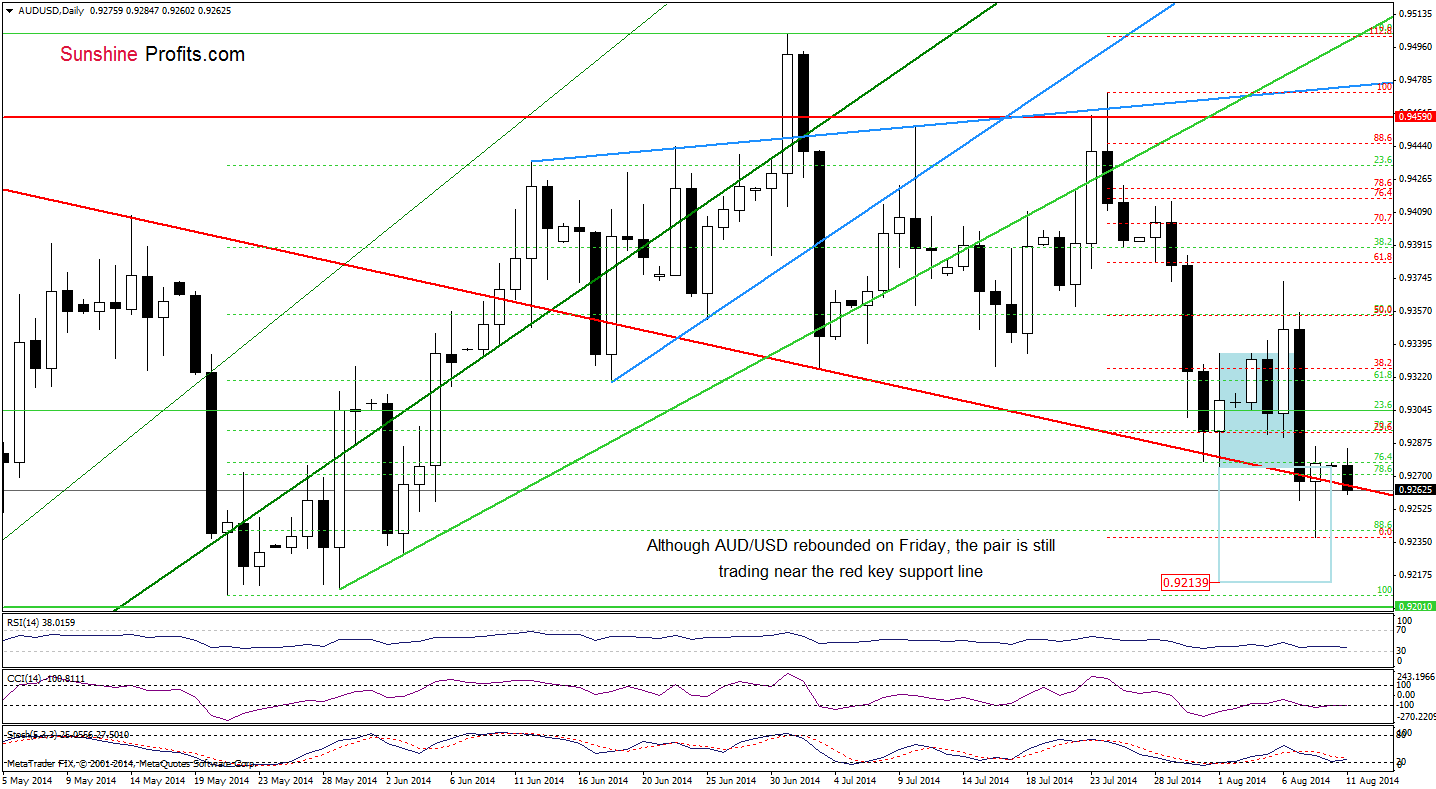
From this perspective, we see that although AUD/USD extended gains and came back above the medium-term red support line (invalidating earlier short-lived breakdown), the pair reversed and came back to the major red support line earlier today. If it withstand the selling pressure, we’ll see a rebound from here and an increase to around 0.9327, where the 38.2% Fibonacci retracement based on the recent decline is. Nevertheless, if currency bulls fail, the pair will decline to around 0.9213 or even to the bottom of the correction that we saw in May (around 0.9207-0.9210).
Very short-term outlook: mixed with bearish bias
Short-term outlook: mixed with bearish bias
MT outlook: mixed
LT outlook: bearish
Trading position (short-term): In our opinion, no positions are justified from the risk/reward perspective. We will keep you informed should anything change, or should we see a confirmation/invalidation of the above.
Thank you.
Nadia Simmons
Forex & Oil Trading Strategist
Przemyslaw Radomski, CFA
Founder, Editor-in-chief
Gold & Silver Trading Alerts
Forex Trading Alerts
Oil Investment Updates
Oil Trading Alerts

