
Earlier today, the Office for National Statistics showed that industrial production rose 0.3% in June, missing forecasts for a 0.6% gain (industrial output rose 1.2% year-over-year, compared to expectations for an increase of 1.5%). Additionally, manufacturing production moved up 0.3% in the previous month, but also missed analytics’ forecast of 0.6% increase. These disappointing numbers pushed GBP/USD lower, which resulted in a move to the support zone. Will it stop further deterioration in the coming days?
In our opinion the following forex trading positions are justified - summary:
EUR/USD
The medium-term outlook hasn’t changed much as EUR/USD still remains in the green support zone. Today, we’ll focus on the very short-term changes.
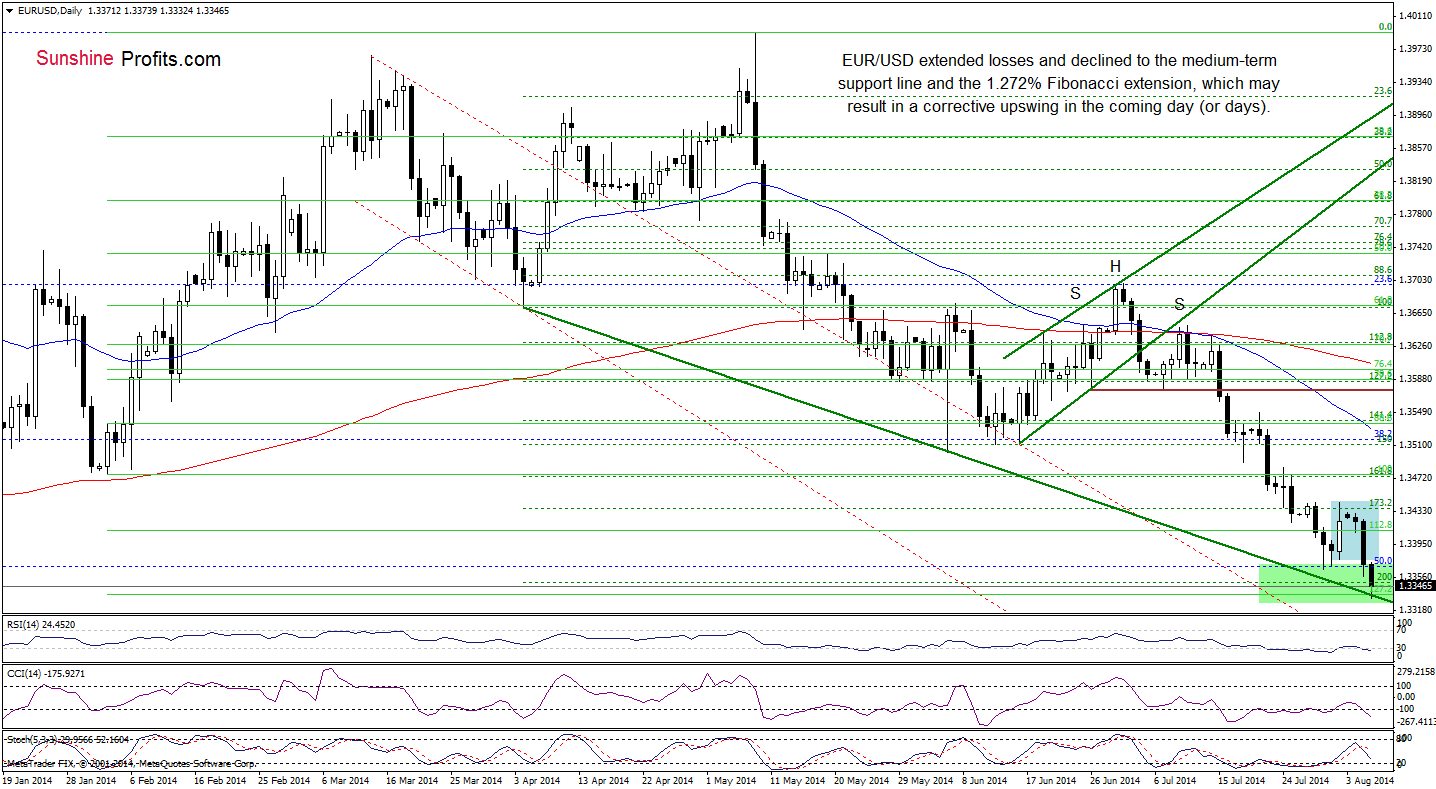
Looking at the above chart, we see that although EUR/USD extended losses and dropped below the recent lows and the 200% Fibonacci extension based on the Apr-May increase, the pair is trading in the green support zone still above the 127.2% Fibonacci extension based on the entire Feb-Ma rally and the medium-term green support line. Therefore, we still believe that as long as there is no breakdown below these levels, another sizable downward move is not likely to be seen. Please note that if this area holds, we’ll see another corrective upswing (similar to the one that we saw on Friday) in the near future.
Very short-term outlook: mixed
Short-term outlook: bearish
MT outlook: bearish
LT outlook: bearish
GBP/USD
The medium-term picture remains unchanged as GBP/USD is still trading between last week high and low. Will the daily chart show us where the pair head next? Let’s check.
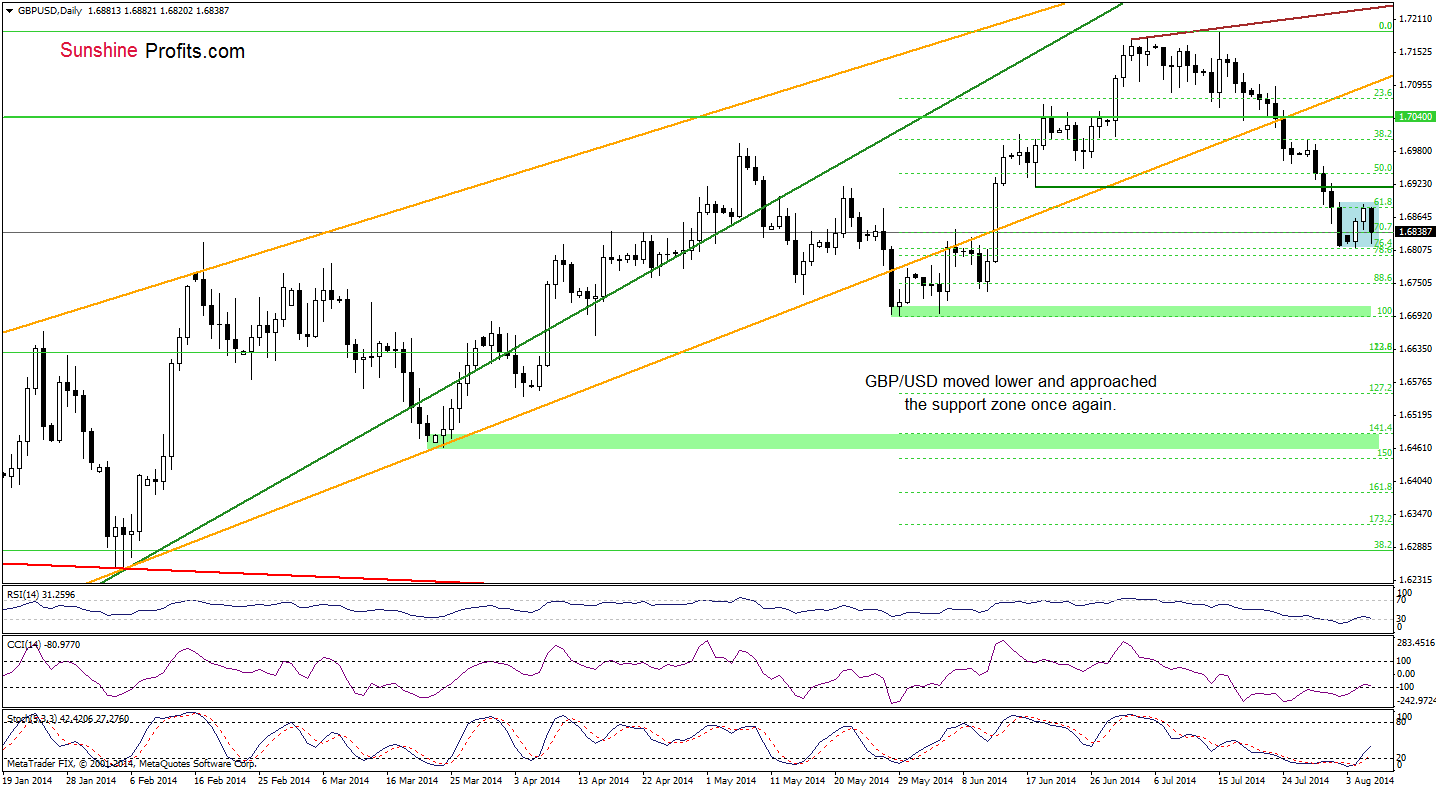
From this perspective, we see that the very short-term situation remains unclear as GBP/USD is trading in a consolidation (marked with blue). As you see on the above chart, although the pair moved lower earlier today, the support zone created by the 76.4% and 78.6% Fibonacci retracement levels based on the May-July rally still holds. Taking this fact into account, we believe that our last commentary on this currency pair is up-to-date:
(…) this is very important area, because in many cases in the past (and not only on the currency market) this zone managed to pause or even stop further deterioration. Therefore, if history repeats itself, we’ll see a corrective upswing to around 1.6917 (the June 18 low) in the coming day (or days). Nevertheless, if it is broken, the exchange rate, will extend declines and drop to 1.6753 or even to the May low of 1.6691.
Very short-term outlook: mixed
Short-term outlook: mixed
MT outlook: bearish
LT outlook: mixed
Trading position (short-term): In our opinion, no positions are justified from the risk/reward perspective. We will keep you informed should anything change, or should we see a confirmation/invalidation of the above.
AUD/USD
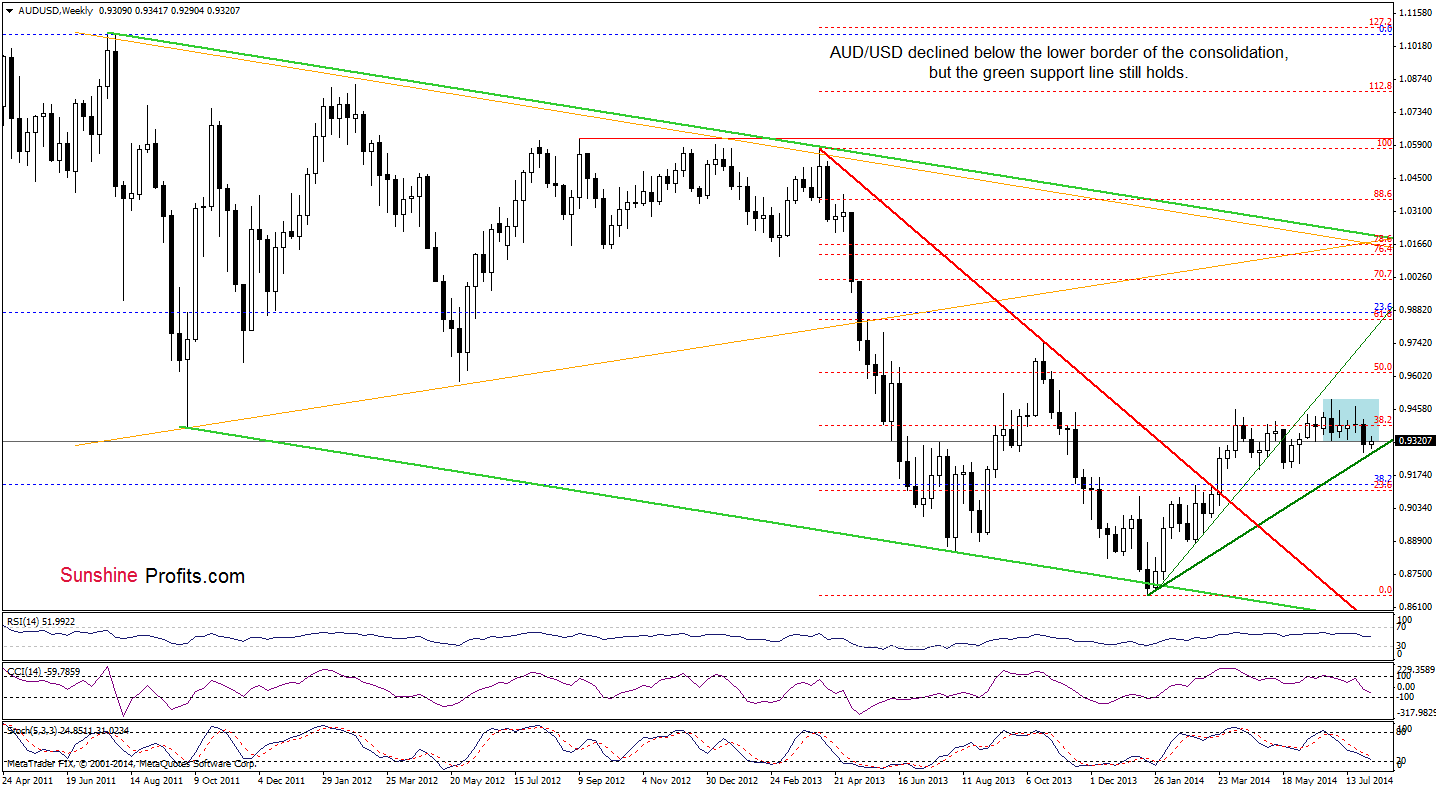
The medium-term outlook has deteriorated slightly as AUD/USD declined below the lower border of the consolidation (marked with blue). Despite this drop, currency bears didn’t manage to push the exchange rate lower, because the green support line keeps further declines in check. Terefore, we believe that as long as there is no breakdown below this key support, nother sizabledownward move is not likely to be seen.
Having say that, let’s take a closer look at the very short-term changes.
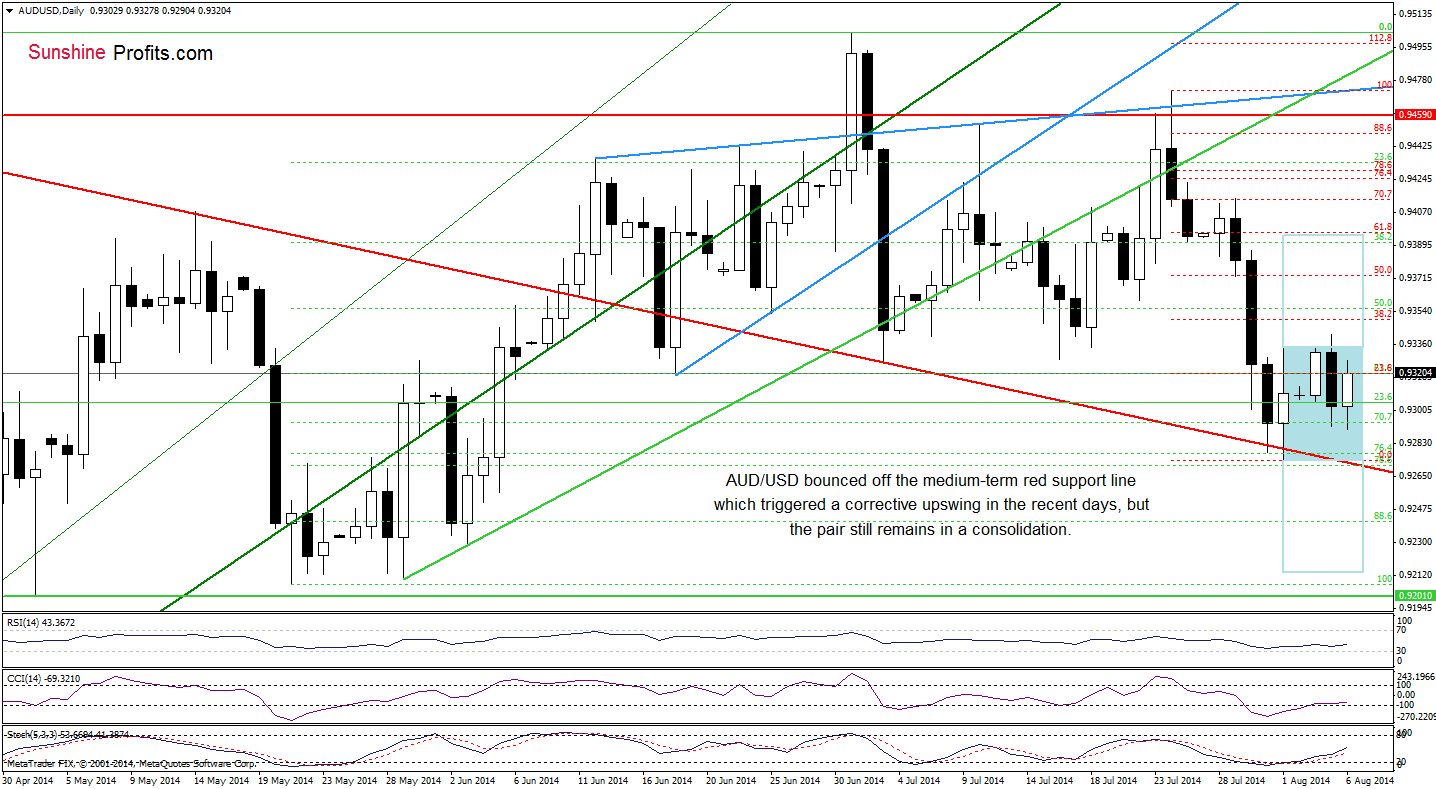
In our Forex Trading Alert posted on July 25, we wrote the following:
(…) taking into account the current position of the indicators and an invalidation of the breakout, we think that the next move will be to the downside. If this is the case, the initial downside target will be around 0.9359, where the bottom of the previous correction is.
Looking at the daily chart, you can see that our projections were correct and AUD/USD declined sharply in the previous week. With this downward move, the pair not only reached the above-mentioned downside target, but also tested the strength of the red support line. As you see on the above chart, this strong support triggered a corrective upswing in the recent days, but the size of the move is still too small (the pair didn’t even erase 38.2% of the entire recent decline) to say that the very short-term situation has improved. Nevertheless, we should keep an eye on the current moves, because the exchange rate remains in a consolidation and a breakout above the upper line of the formation or breakdown below the lower line will trigger further improvement or deterioration. What is the bullish scenario? If the pair successfully moves higher, we’ll likely see an upward move to around 0.9394, where the size of the upswing will correspond to the height of the formation (this area is also reinforced by the 61.8% Fibonacci retracement). On the other hand, if currency bears win and the pair breaks below recent lows, we may see a decline to 0.9213 or even to the bottom of the correction that we saw in May (around 0.9207-0.9210).
Very short-term outlook: mixed
Short-term outlook: mixed
MT outlook: mixed
LT outlook: bearish
Trading position (short-term): In our opinion, no positions are justified from the risk/reward perspective. We will keep you informed should anything change, or should we see a confirmation/invalidation of the above.
Thank you.
Nadia Simmons
Forex & Oil Trading Strategist
Przemyslaw Radomski, CFA
Founder, Editor-in-chief
Gold & Silver Trading Alerts
Forex Trading Alerts
Oil Investment Updates
Oil Trading Alerts

