
Earlier today, the greenback moved lower against the common currency as investors jumped to the sidelines awaiting for Federal Reserve Chair Janet Yellen's two-day congressional testimony on Tuesday and Wednesday. Because of these circumstances, EUR/USD extended gains and climbed to the strong resistance zone. So far, it holds, but is it strong enough to stop further improvement?
In our opinion the following forex trading positions are justified - summary:
EUR/USD
The situation in the medium term hasn’t changed much since our last Forex Trading Alert was posted and EUR/USD still remains in the consolidation below the long-term resistance line. Having say that, let’s examine the daily chart.
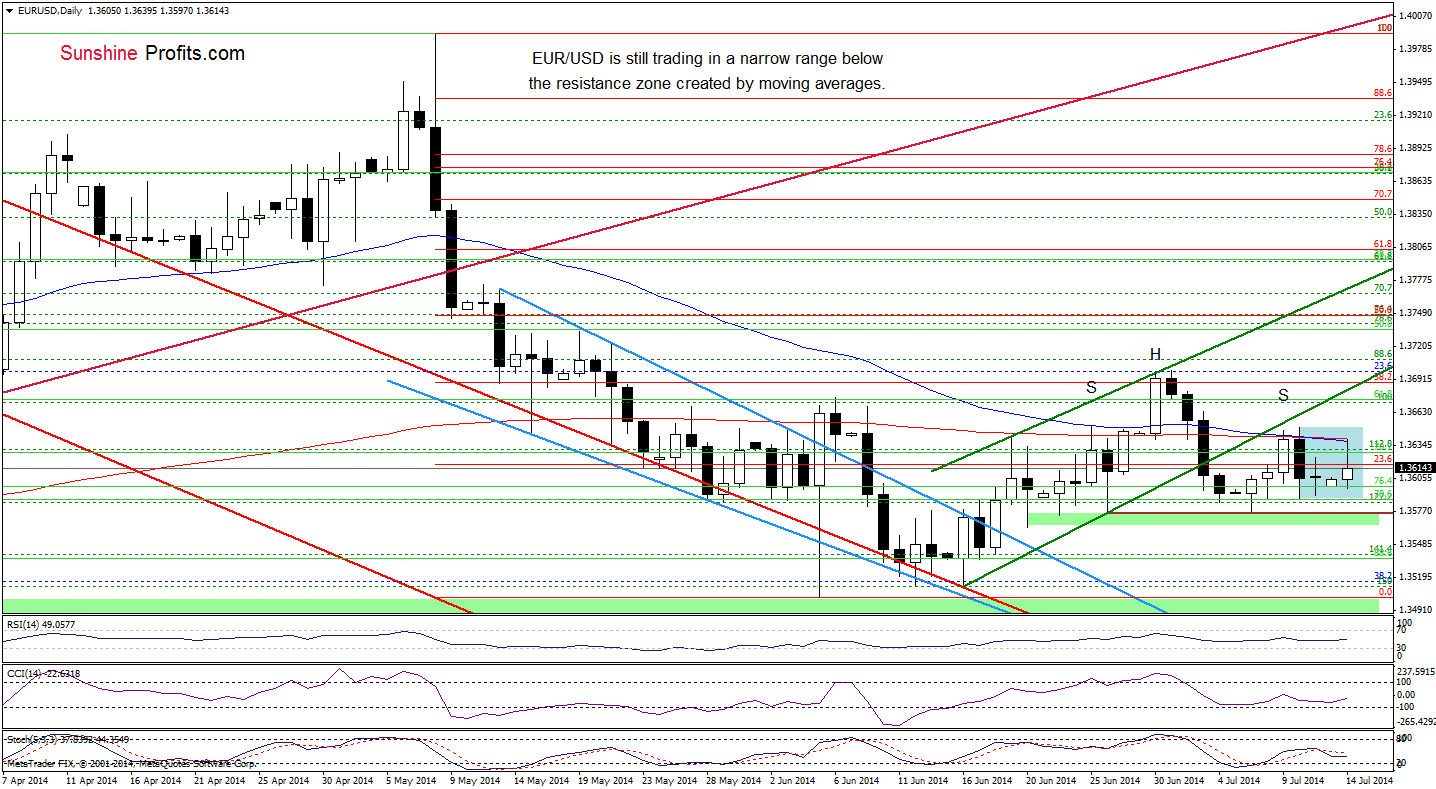
Earlier today, the exchange rate moved higher, but this improvement was only temporarily as the strong resistance zone (created by the 50- and 200-day moving averages) triggered another decline. As a result, the pair dropped to the levels that we saw on Friday. Taking into account the fact that EUR/USD is still trading in a consolidation range (marked with blue), we are convinced that our Wednesday’s commentary on this currency pair is still up-to-date:
(…) The first thing that catches the eye on the daily chart is a potential head and shoulders reversal formation. Although it’s not complete at the moment, we think that the pair is currently building the right shoulder of this pattern. If this is the case and EUR/USD declines from here, we’ll see a correction to the neck line based on the June 26 and July 7 lows (but further deterioration will be even more likely if the pair drops below the green support zone). If this area is broken, the exchange rate will test the strength of the June lows, where the size of a downswing will correspond to the height of the formation (this scenario is currently reinforced by the strong resistance zone created by the 50- and 200-day moving averages).
Very short-term outlook: bearish
Short-term outlook: mixed with bearish bias
MT outlook: bearish
LT outlook: bearish
Trading position (short-term; our opinion): It seems that our decision to take the profits off the table and close the short position on June 4 was correct - the EUR/USD has been trading sideways since that time and it keeping an open position in such environment would have been too risky. We keeping our eyes open for the next profitable move, though. Meanwhile, in our opinion no positions are justified from the risk/reward perspective.
GBP/USD
Similarly to what we wrote in the case of EUR/USD, the medium-term outlook remains unchanged as GBP/USD is still trading above the key support line created by the 2009 high. Did the short-term picture change earlier today?
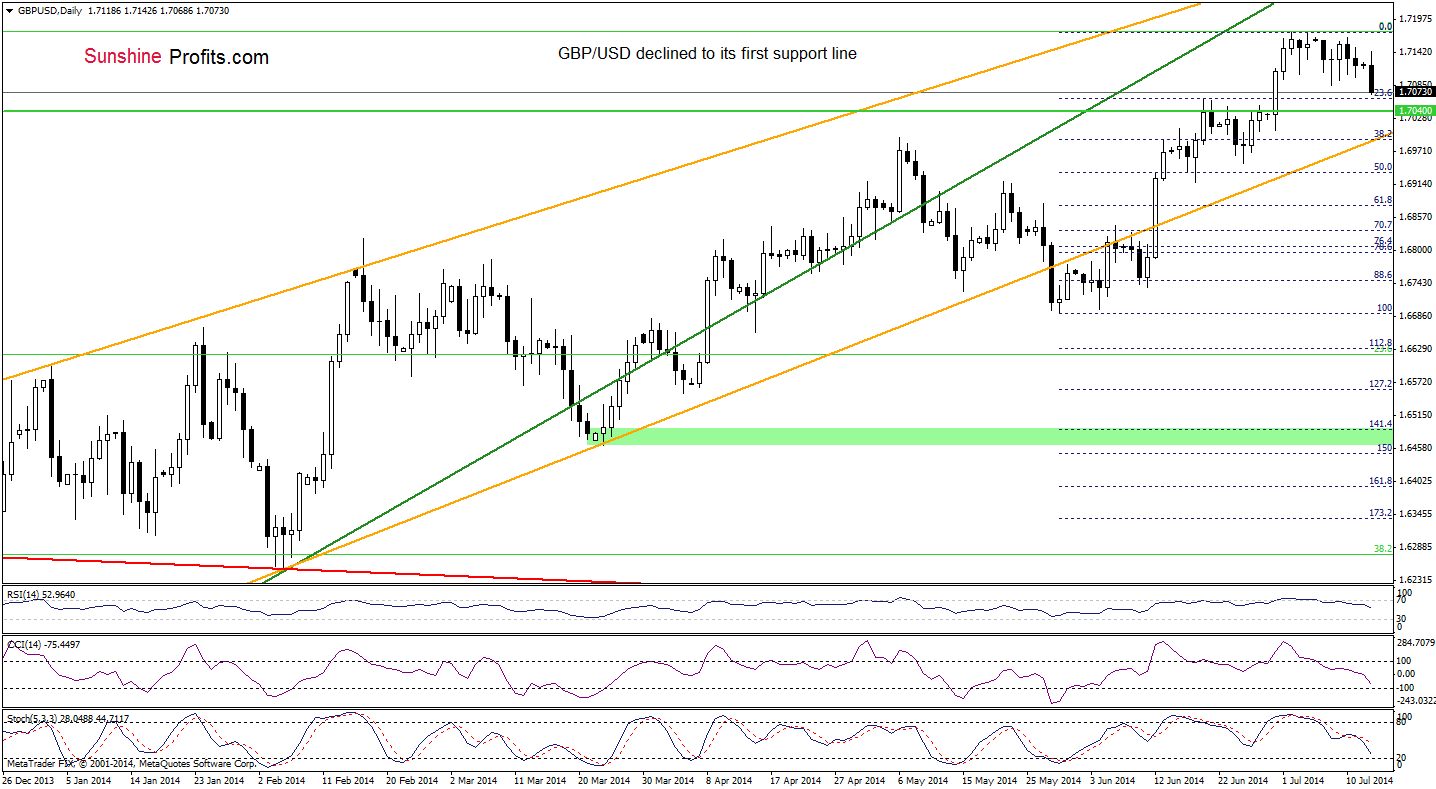
Looking at the daily chart, we see that the situation has deteriorated slightly as GBP/USD extended losses and dropped below last week’s low. In this way, the pair approached the 23.6% Fibonacci retracement, which serves as the nearest support. If his area holds, we’ll see a rebound even to the recent highs. However, if it is broken, we’ll see a realization of the bearish scenario that we discussed in our Forex Trading Alert posted on Wednesday:
(…) the indicators (…) generated sell signals, which will likely encourage forex traders to push the sell button. If this is the case, we’ll see further declines and the initial downside target will be the green horizontal support line (the 2009 high). If it withstand the selling pressure, GBP/USD would rebound and come back to around recent highs. But if this important line is broken, we’ll see a drop to the green support zone created by the medium-term orange support line and the bottom of the previous correction (around 1.6950).
Very short-term outlook: bearish
Short-term outlook: mixed with bearish bias
MT outlook: bearish
LT outlook: mixed
Trading position (short-term): In our opinion, no positions are justified from the risk/reward perspective. We will keep you informed should anything change, or should we see a confirmation/invalidation of the above.
AUD/USD
The medium-term outlook remains mixed as AUD/USD is still trading in a consolidation between the May lows and the April high. Today, we’ll take a closer look at the daily chart.
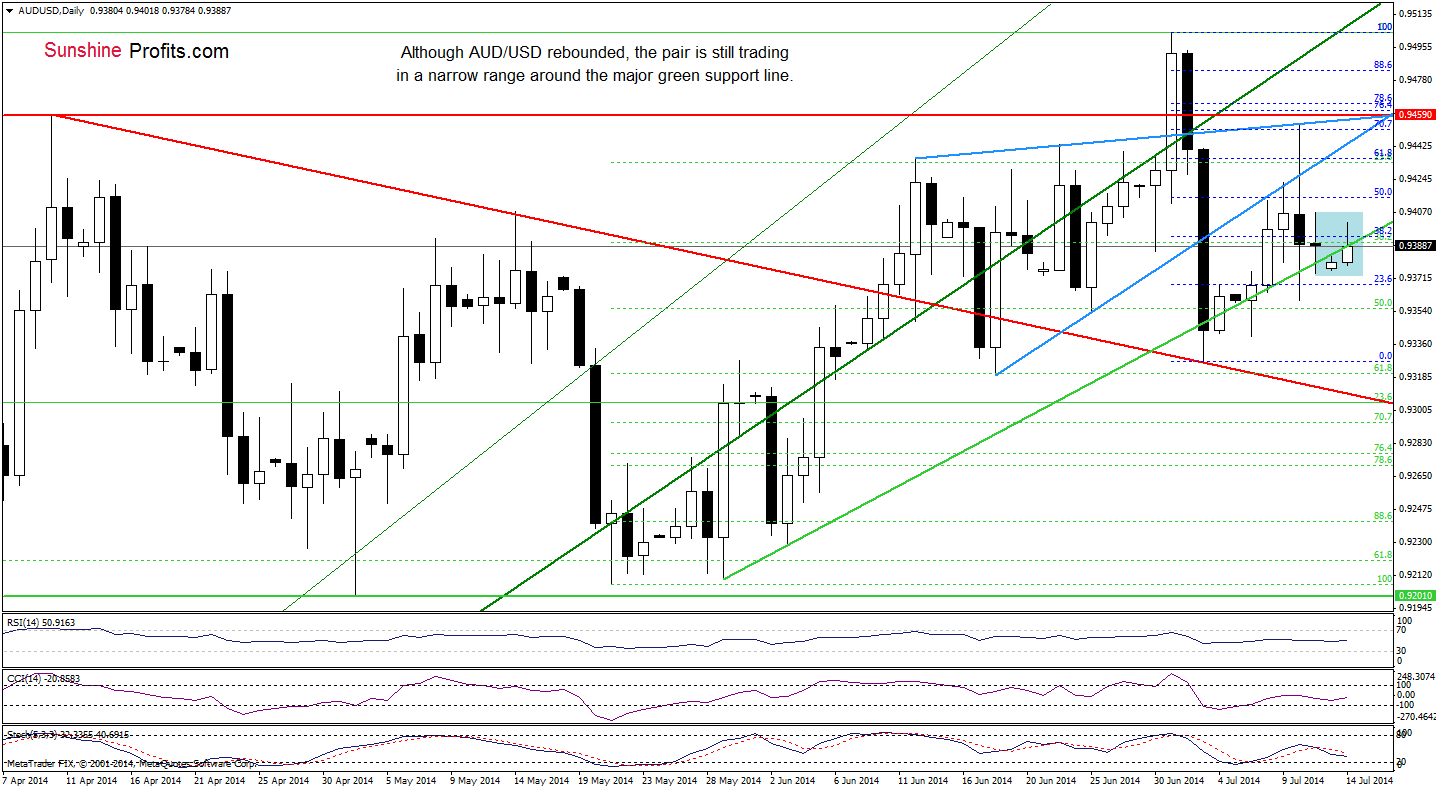
From this perspective, we see that although AUD/USD re-tested the strength of the green support line once again, the situation hasn’t changed much as the exchange rate remains between Friday high and low. Therefore, our last commentary on this currency pair is up-to-date:
(…) In our opinion, if this key support withstand the selling pressure, we’ll see another attempt to reach the lower border of the rising wedge. However, if this important line is broken (…), we think that the current correction will accelerate and we’ll see a drop to the July low of 0.9327 or even to the declining red support line (currently around 0.9316).
Very short-term outlook: mixed
Short-term outlook: mixed
MT outlook: mixed
LT outlook: bearish
Trading position (short-term): In our opinion, no positions are justified from the risk/reward perspective. We will keep you informed should anything change, or should we see a confirmation/invalidation of the above.
Thank you.
Nadia Simmons
Forex & Oil Trading Strategist
Przemyslaw Radomski, CFA
Founder, Editor-in-chief
Gold & Silver Trading Alerts
Forex Trading Alerts
Oil Investment Updates
Oil Trading Alerts

