
Earlier today, the Australian dollar rebounded against the greenback after the Reserve Bank of Australia kept its cash rate steady at a record low 2.5%. Thanks to this news, AUD/USD bounced off the support zone, hitting an intraday high of 0.9285. Did this rally change the very short-term picture?
In our opinion the following forex trading positions are justified - summary:
- EUR/USD: short (stop- loss order: 1.3680)
- GBP/USD: none
- USD/JPY: none
- USD/CAD: none
- USD/CHF: none
- AUD/USD: short (stop- loss order: 0.9340)
EUR/USD
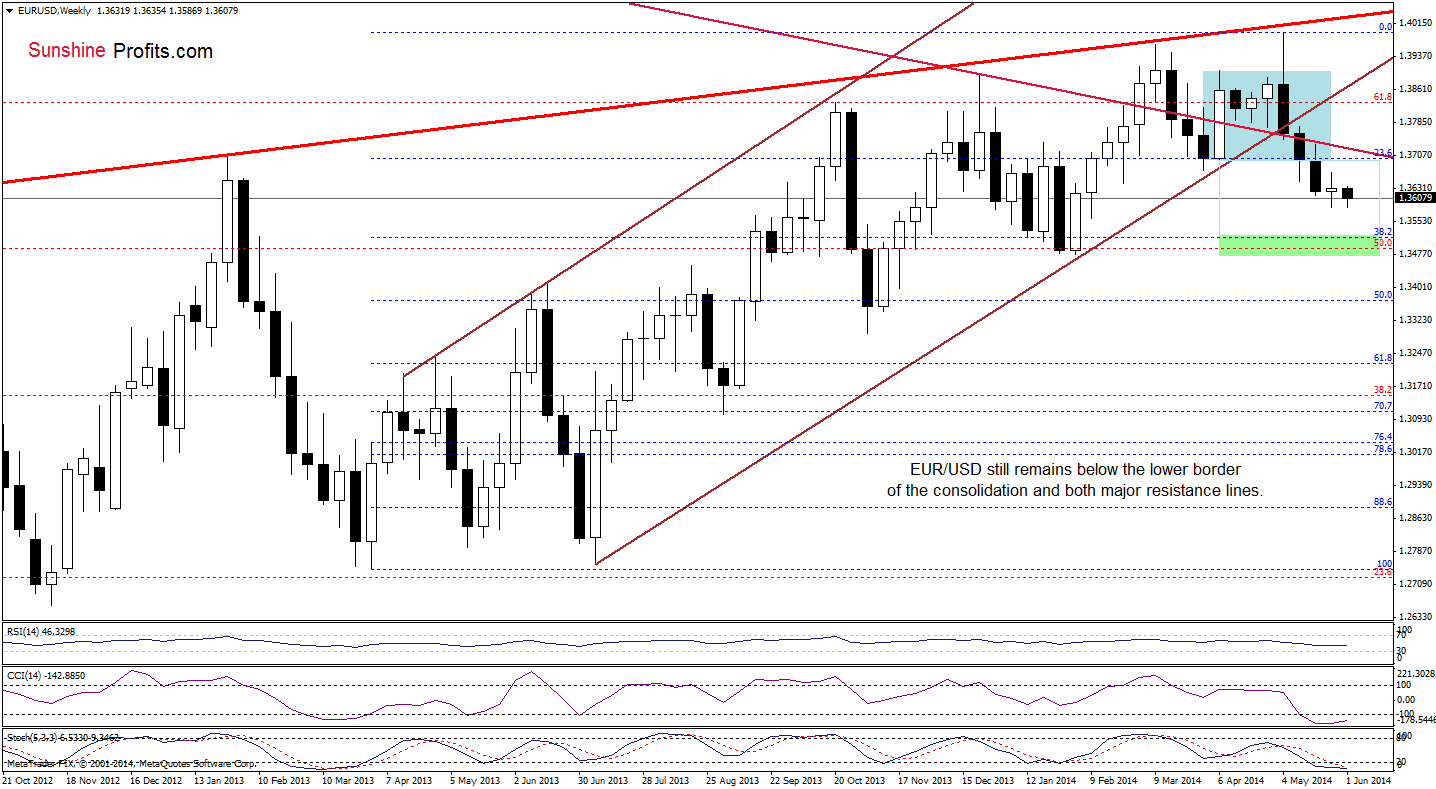
Looking at the weekly chart, we see that the situation in the medium term hasn’t changed much as EUR/USD remains between last week’s high and low. Therefore, what we wrote on Friday is up-to-date:
(…) exchange rate still remains not only below the previously-broken lower border of the consolidation, but also under the long-term declining line and the lower border of the rising trend channel (…) as long as there is no invalidation of the breakdown under these lines, further deterioration is likely. If this is the case, and the exchange rate extends losses in the coming week (or weeks), the downside target will be around 1.3516 (where the 38.2% Fibonacci retracement based on the entire March 2013-May 2014 is) or even slightly lower – around 1.3480, where the bottom of the previous bigger correction (between Dec. and Feb.) is.
What can we infer from the short-term chart?
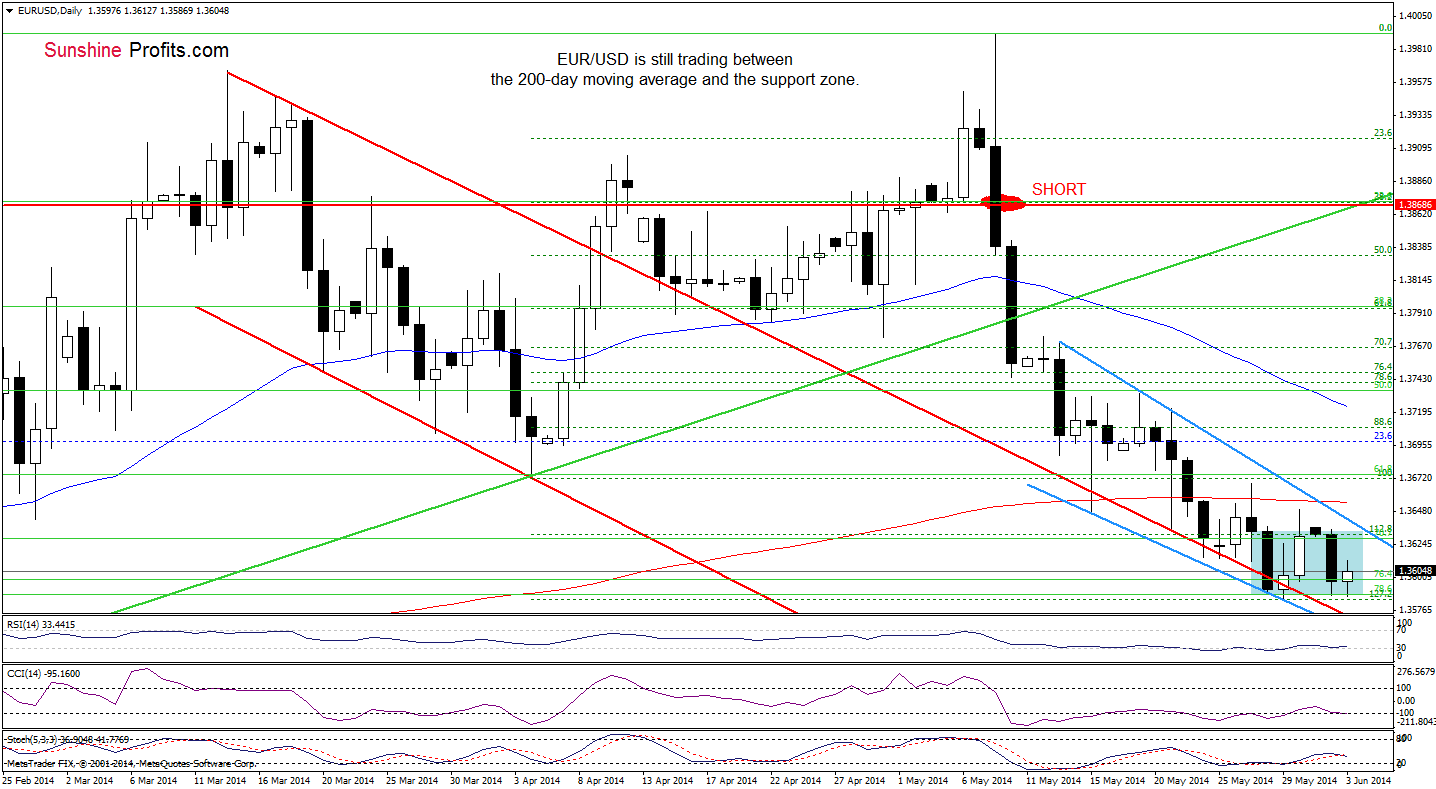
Looking on the daily chart, we see that EUR/USD re-tested the strength of the support zone created by the 76.4% and 78.6% Fibonacci retracement levels earlier today. Taking this fact into account, we think that our yesterday’s commentary on this currency pair is still up- to-date:
(...) If it withstands the selling pressure, we will see another attempt to reach the upper line of the declining wedge, which serves as nearest resistance (currently around 1.3648). At this point, it’s worth noting that slightly above this level is also the 200-day moving average (at 1.3655). However if it is broken, we will see another re-test of the strength of the upper line of the declining trend channel (currently around 1.3578) or even a drop to around 1.3540, where the 88.6% Fibonacci retracement (based on the entire Feb.-May rally) meets the 141.4% Fibonacci extension (based on the Apr.-May rally).
Very short-term outlook: bearish
Short-term outlook: bearish
MT outlook: bearish
LT outlook: bearish
Trading position (short-term; our opinion): Short. Stop-loss order: 1.3680. We will keep you informed should anything change, or should we see a confirmation/invalidation of the above.
USD/JPY
On Friday, we wrote the following:
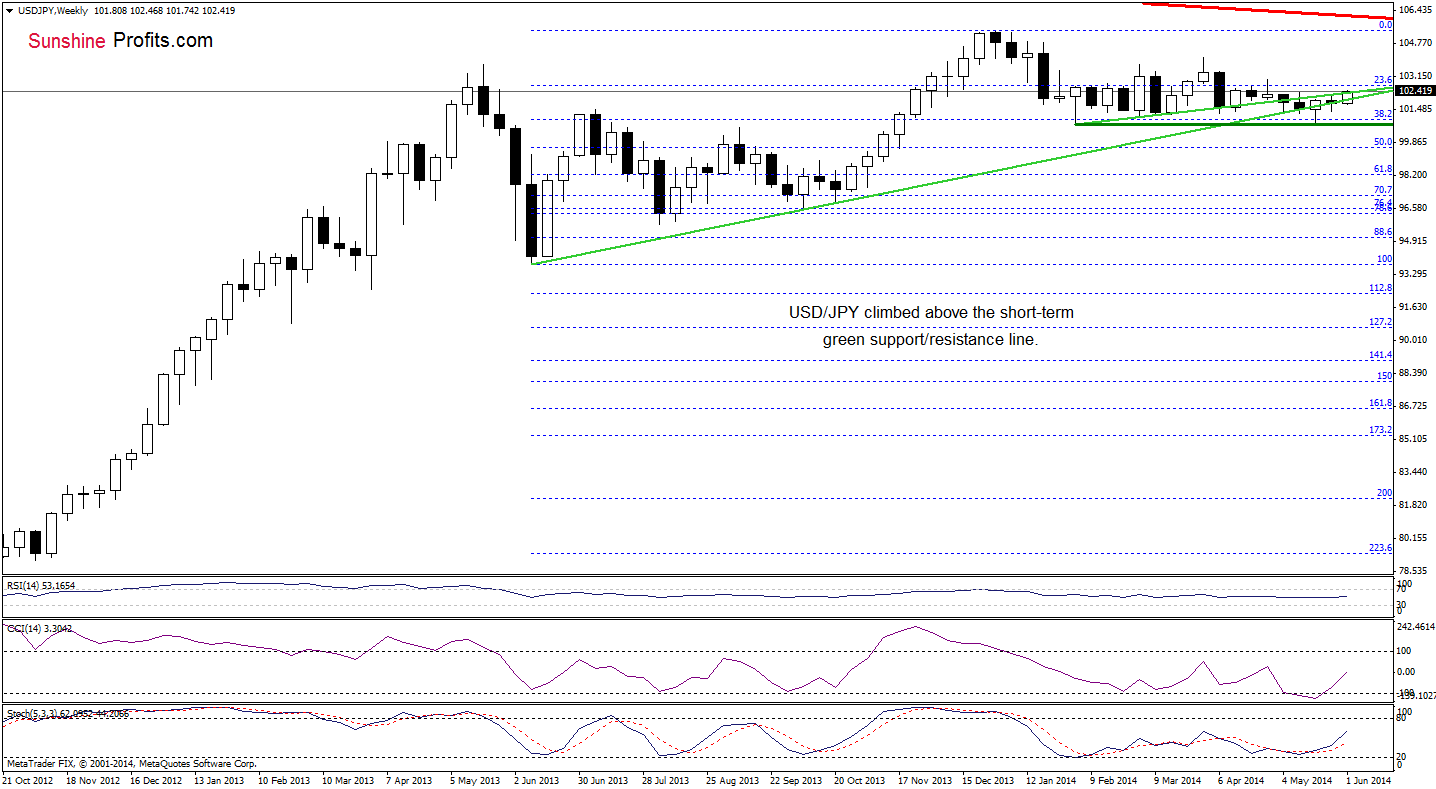
(…) If the medium-term support line holds, we will see another attempt to move higher (…) it seems that another sizable upswing will be more likely if the pair breaks above the short-term green resistance line (currently around 102.04).
Looking at the weekly chart, we see that the situation has improved slightly as USD/JPY reversed (after a small drop below the medium-term support line) and climbed above the short-term green resistance line. So far, this move is barely visible, but if currency bulls do not give up, we may see further improvement as buy signals remain in place.
Will the short-term picture give us more clues about next moves?
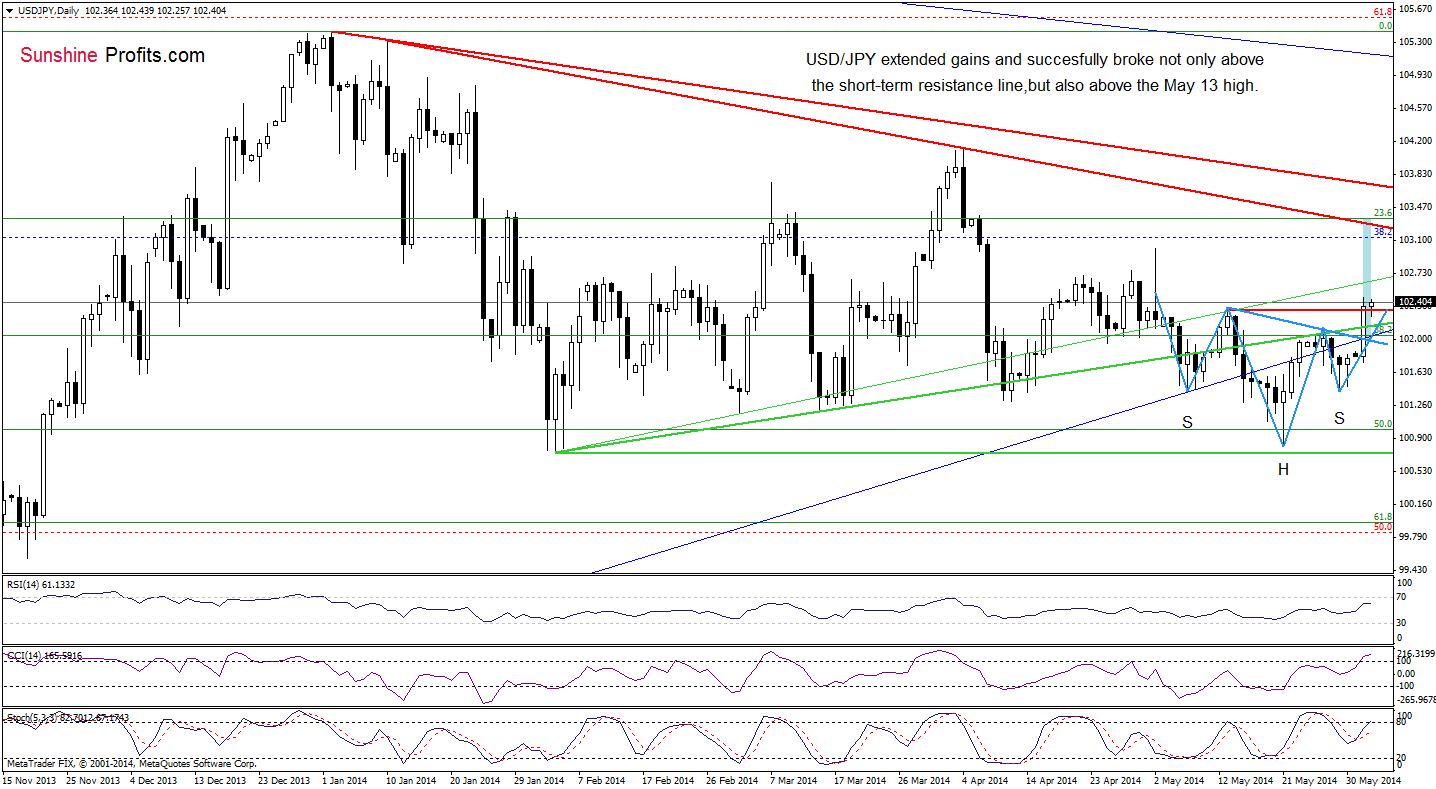
From this perspective, we see that the situation has improved significantly as USD/JPY rebounded sharply, breaking not only above the blue medium-term support/resistance line, but also the green short-term resistance line and the May 13 high. As you see on the daily chart, we noticed a reverse head and shoulders formation. Therefore, we think that if yesterday’s breakout is not invalidated, we’ll see an increase even to around 103.30, where the red declining resistance line is. At this point, it’s worth noting that although the CCI is overbought, the current position of the indicators still supports the bullish case.
Very short-term outlook: bullish
Short-term outlook: mixed
MT outlook: mixed
LT outlook: bearish
Trading position (short-term): In our opinion no positions are justified from the risk/reward perspective at the moment. We will keep you informed should anything change, or should we see a confirmation/invalidation of the above.
AUD/USD
The medium-term situation hasn’t changed much as AUD/USD is still trading in the consolidation range, well below the previously-broken green resistance line, while sell signals generated by the indicators remain in place, supporting the bearish case.
Having say that, let’s focus on the short-term picture.
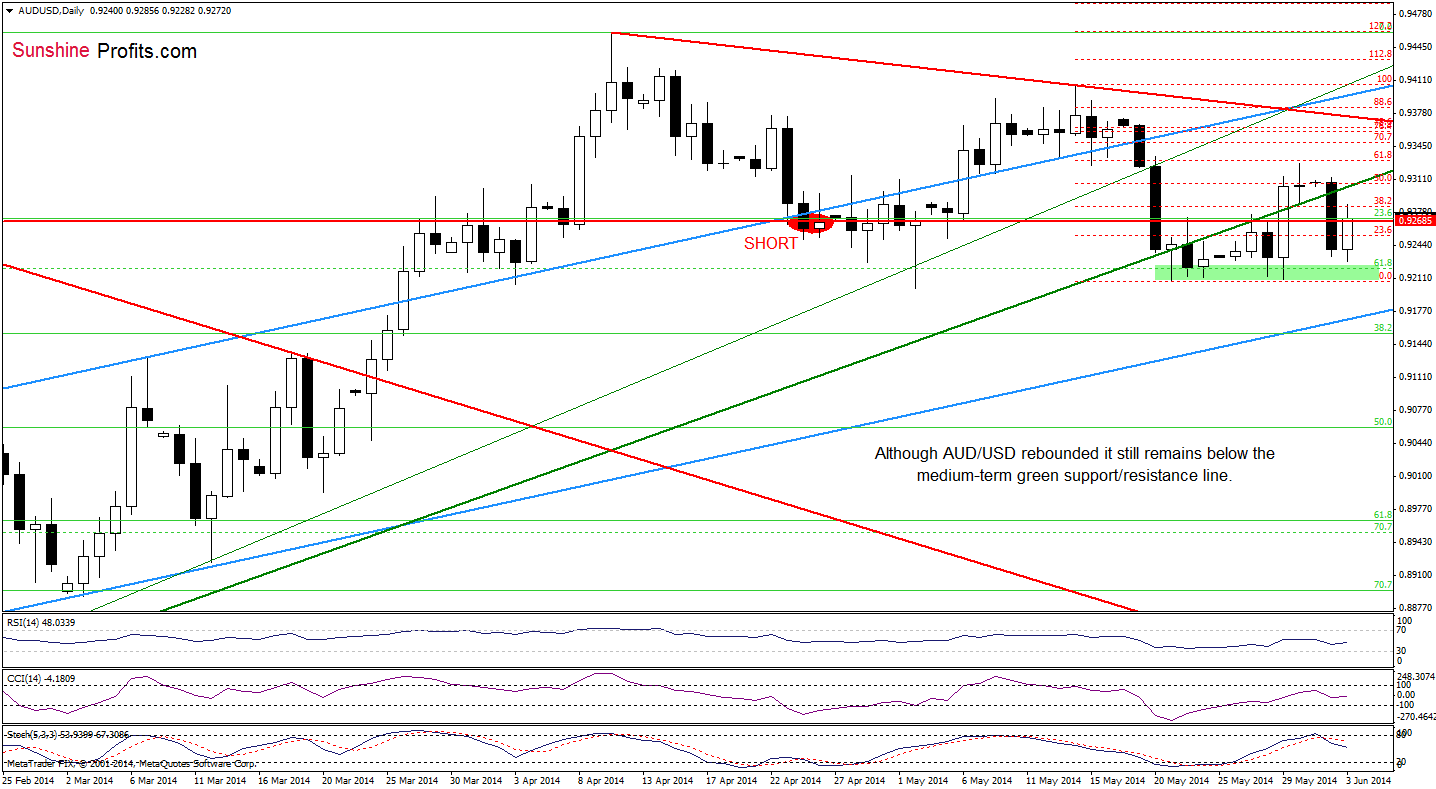
Looking at the daily chart, we see that the proximity to the support zone created by the May lows triggered a corrective upswing earlier today. Despite this improvement, AUD/USD still remains below the medium-term green line. In our opinion, as long as this nearest resistance line is in play, another attempt to move lower can’t be ruled out – especially when we factor in the current position of the indicators, which supports currency bears. If this is the case, we will see another test of the strength of the above-mentioned support zone (marked with green).
Very short-term outlook: bearish
Short-term outlook: bearish
MT outlook: bearish
LT outlook: bearish
Trading position (short-term; our opinion): Short (the area where it was opened we marked with a red ellipse). Stop-loss order: 0. 9340. We will keep you informed should anything change, or should we see a confirmation/invalidation of the above.
Thank you.
Nadia Simmons
Forex & Oil Trading Strategist
Przemyslaw Radomski, CFA
Founder, Editor-in-chief
Gold & Silver Trading Alerts
Forex Trading Alerts
Oil Investment Updates
Oil Trading Alerts

