
Earlier today, the euro moved higher against the U.S. dollar after the release of mixed consumer sentiment and personal spending reports, approaching the previously-broken resistance. Meanwhile, USD/CHF moved lower, breaking below important support line. What impact did these moves have on the short-term outlook? Did they weighed on the medium-term picture?
In our opinion the following forex trading positions are justified - summary:
- EUR/USD: short (stop-loss order: 1.4040)
- GBP/USD: none
- USD/JPY: none
- USD/CAD: none
- USD/CHF: none
- AUD/USD: short (stop-loss order: 0.9410)
EUR/USD
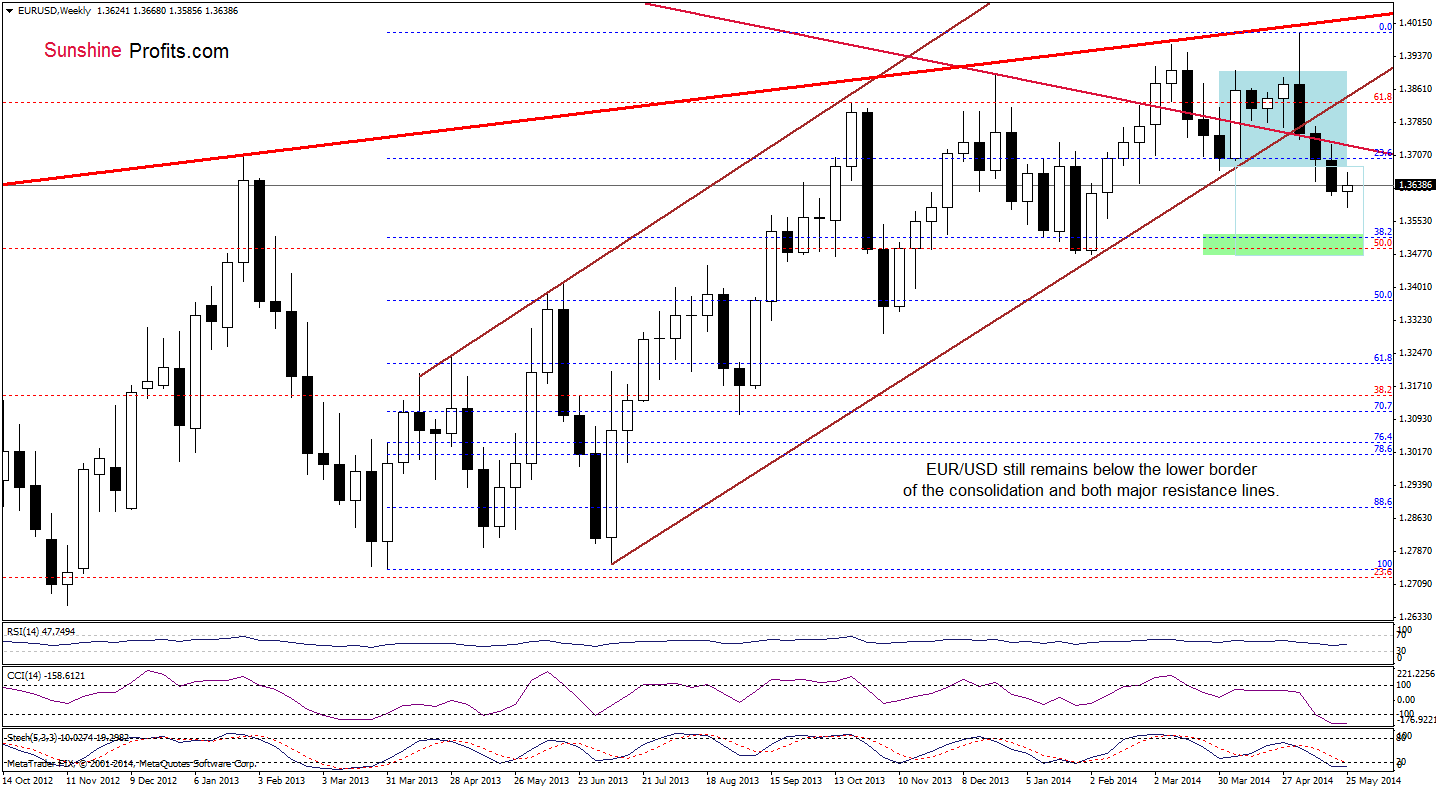
From the weekly perspective, we see that although EUR/USD rebounded slightly from its 3-month low, the exchange rate still remains not only below the previously-broken lower border of the consolidation, but also under the long-term declining line and the lower border of the rising trend channel. Taking all these bearish facts into account, we think that what we wrote in our last Forex Trading Alert is up-to-date:
(…) as long as there is no invalidation of the breakdown under these lines, further deterioration is likely. If this is the case, and the exchange rate extends losses in the coming week (or weeks), the downside target will be around 1.3516 (where the 38.2% Fibonacci retracement based on the entire March 2013-May 2014 is) or even slightly lower – around 1.3480, where the bottom of the previous bigger correction (between Dec. and Feb.) is.
Once we know the above, let’s focus on the daily chart.
Yesterday, we wrote the following:
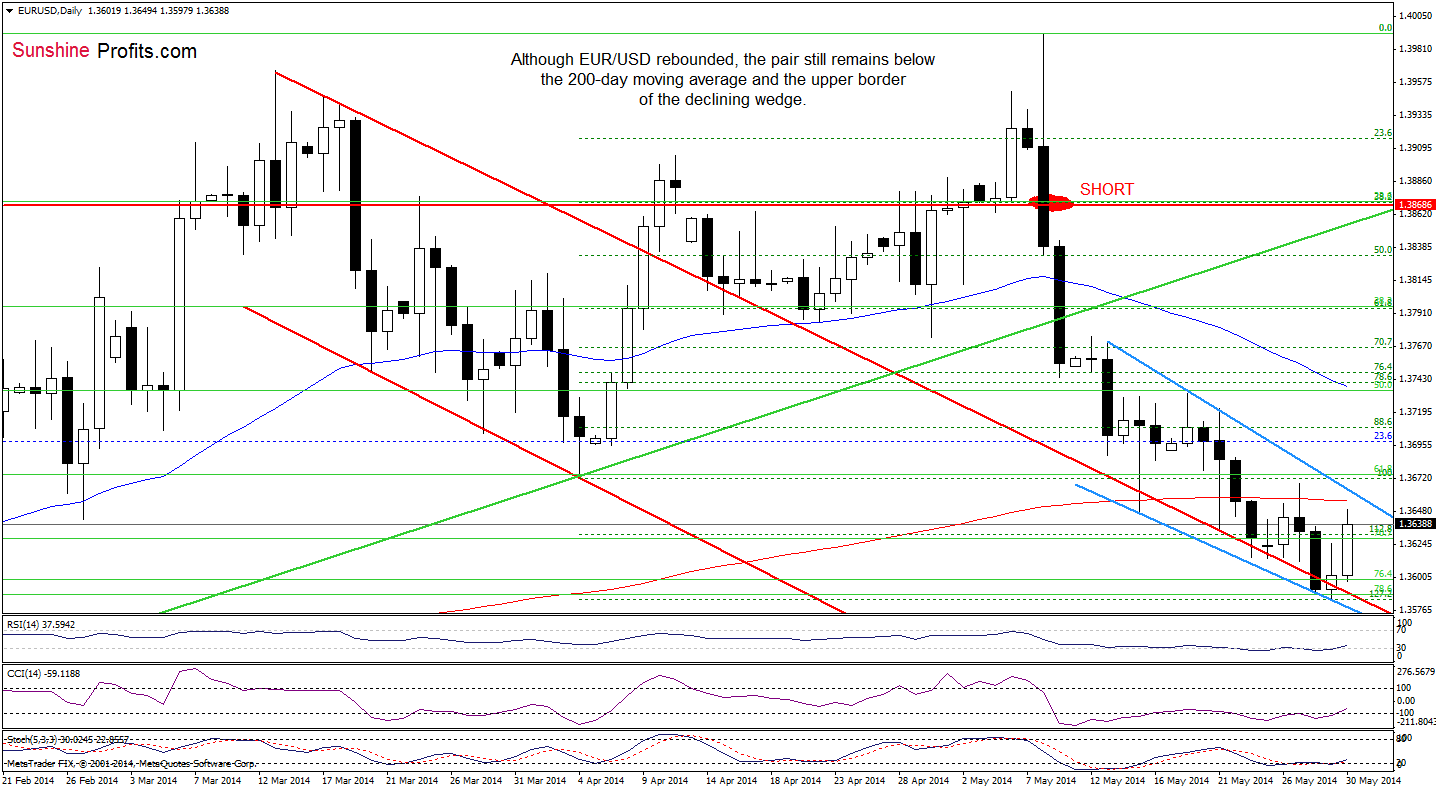
(…) the pair reached not only the upper border of the declining trend channel, but also the lower line of the declining wedge (marked with blue), which serve as an additional support. (…) If the combination of this major support line and Fibonacci retracements withstands the selling pressure, we may see a comeback to the previously-broken 200-day moving average (the position of the daily indicators supports this scenario at the moment).
Looking at the above chart, we noticed such price action earlier today as EUR/USD approached the above-mentioned 200-day moving average. Additionally, all indicators generated buy signals, which suggests further improvement. Nevertheless, we should keep in mind that slightly above this moving average is also the upper line of the declining wedge, which together create a resistance zone. If it holds, we will likely see another re-test of the strength of the upper line of the declining trend channel. However if it is broken, the next upside target for currency bulls will be around 1.3733-1.3738, where the May 19 high meets the 50-day moving average.
Before we summarize this currency pair, we would like to emphasize the quote from our Forex Trading Alert posted on May 19:
(…) In our opinion, the breakout in the USD Index above the medium-term resistance line can trigger a significant rally soon (…) Therefore, we remain bearish on EUR/USD.
Very short-term outlook: bearish
Short-term outlook: bearish
MT outlook: bearish
LT outlook: bearish
Trading position (short-term; our opinion): Short. Stop-loss order: 1.4040. The short position (the area where it was opened we marked with a red ellipse) featured on May 8th when EUR/USD was still above the 50-day moving average (blue line in the chart) remains profitable. We will keep you informed should anything change, or should we see a confirmation/invalidation of the above.
GBP/USD
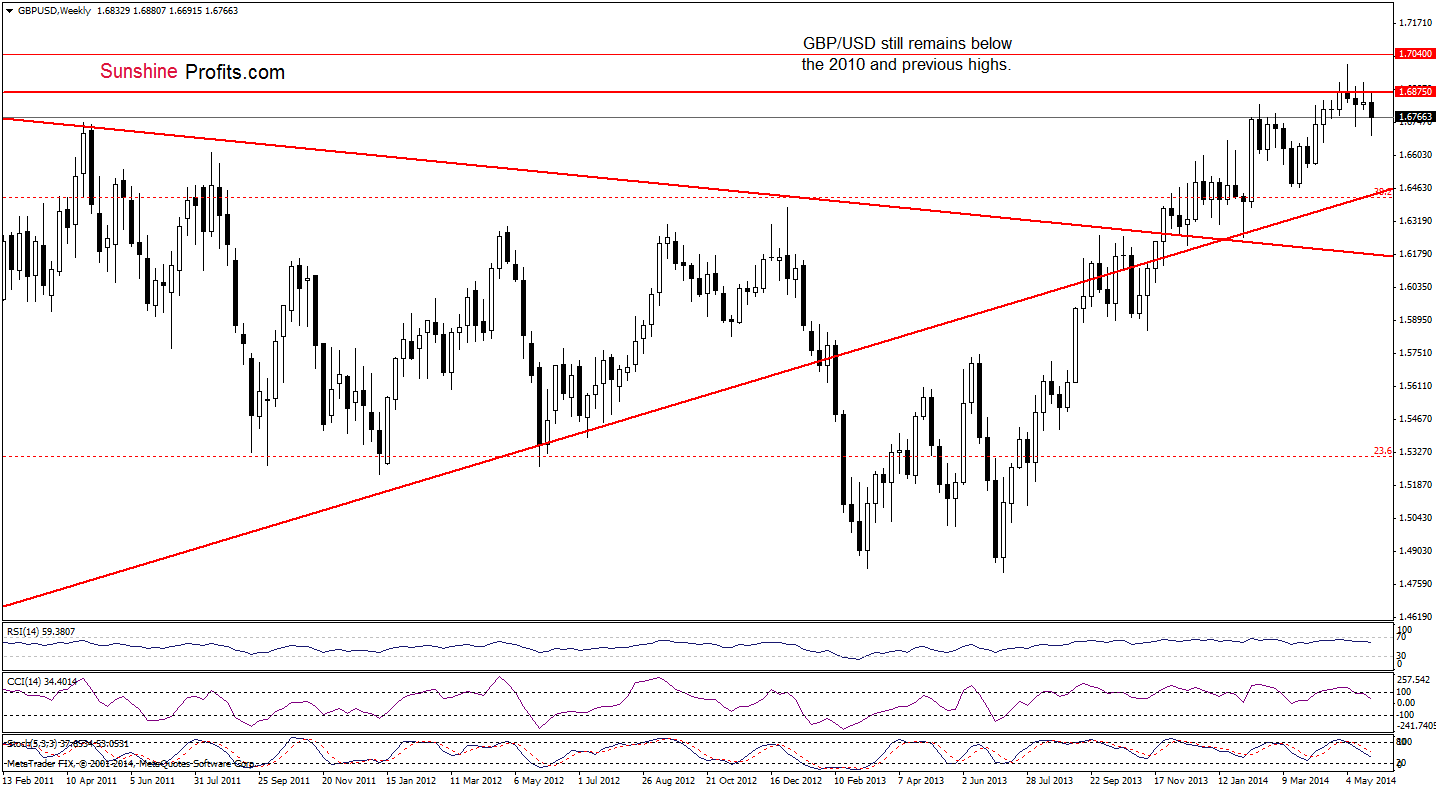
As you see on the weekly chart, the situation in the medium term has improved slightly as GBP/USD rebounded and came back above the previous May low. Despite this small improvement, the pair still remains below the strong resistance zone created by the 2010 and 2014 highs. Additionally, sell signals generated by the indicators remain in place, supporting the bearish case.
What can we infer from the short-term picture?
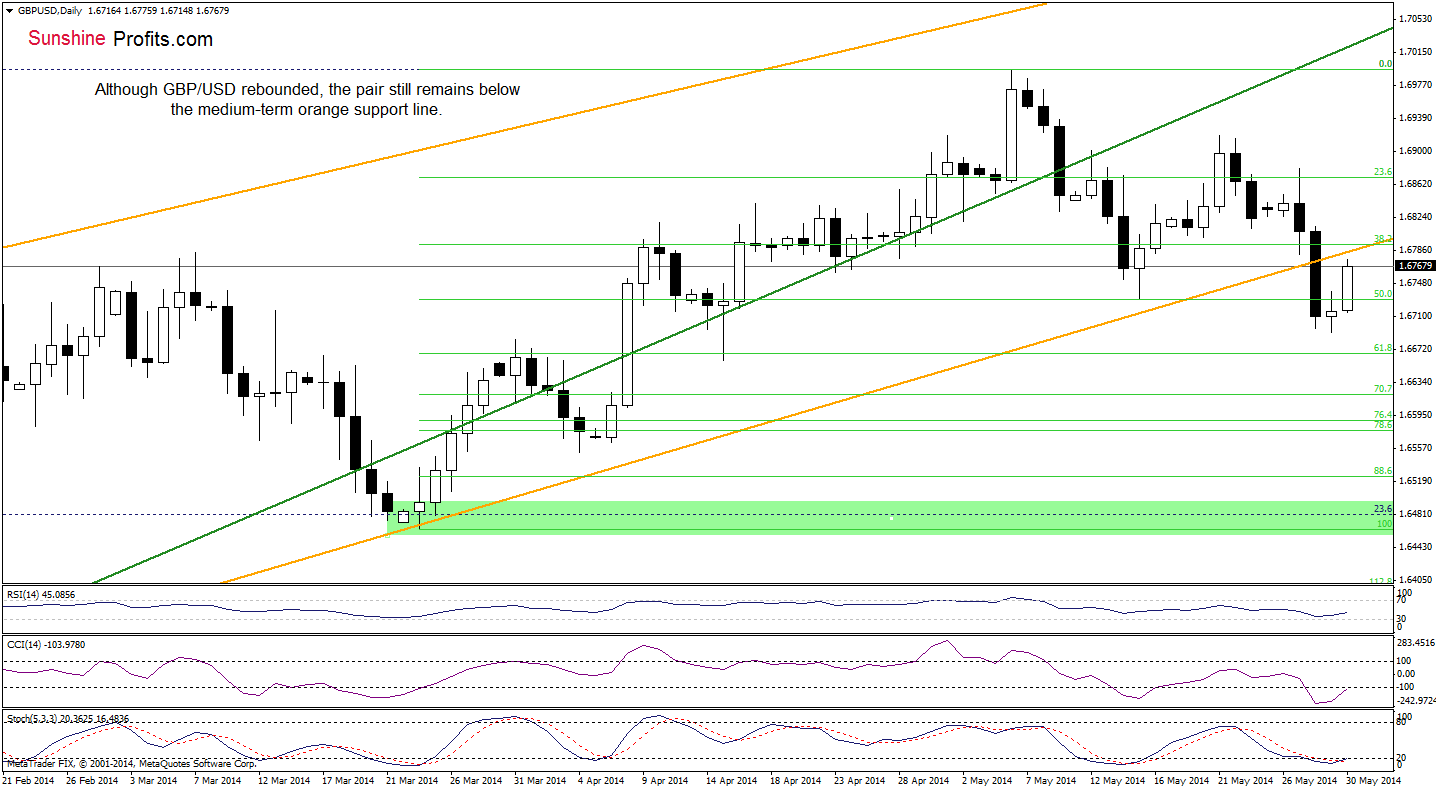
Looking at the above chart, we see that GBP/USD bounced off the May low and approached the previously-broken the medium-term orange resistance line. Despite this upswing, as long as there is no invalidation of the breakdown below this line another attempt to move lower can’t be ruled out. Nevertheless, if the pair moves higher and comes back above the orange line, the next upside target will be around 1.6880, where the May 23 and May 27 highs are.
Very short-term outlook: mixed with bearish bias
Short-term outlook: mixed with bearish bias
MT outlook: bearish
LT outlook: mixed
Trading position (short-term): In our opinion, no positions are justified from the risk/reward perspective. We will keep you informed should anything change, or should we see a confirmation/invalidation of the above.
USD/JPY
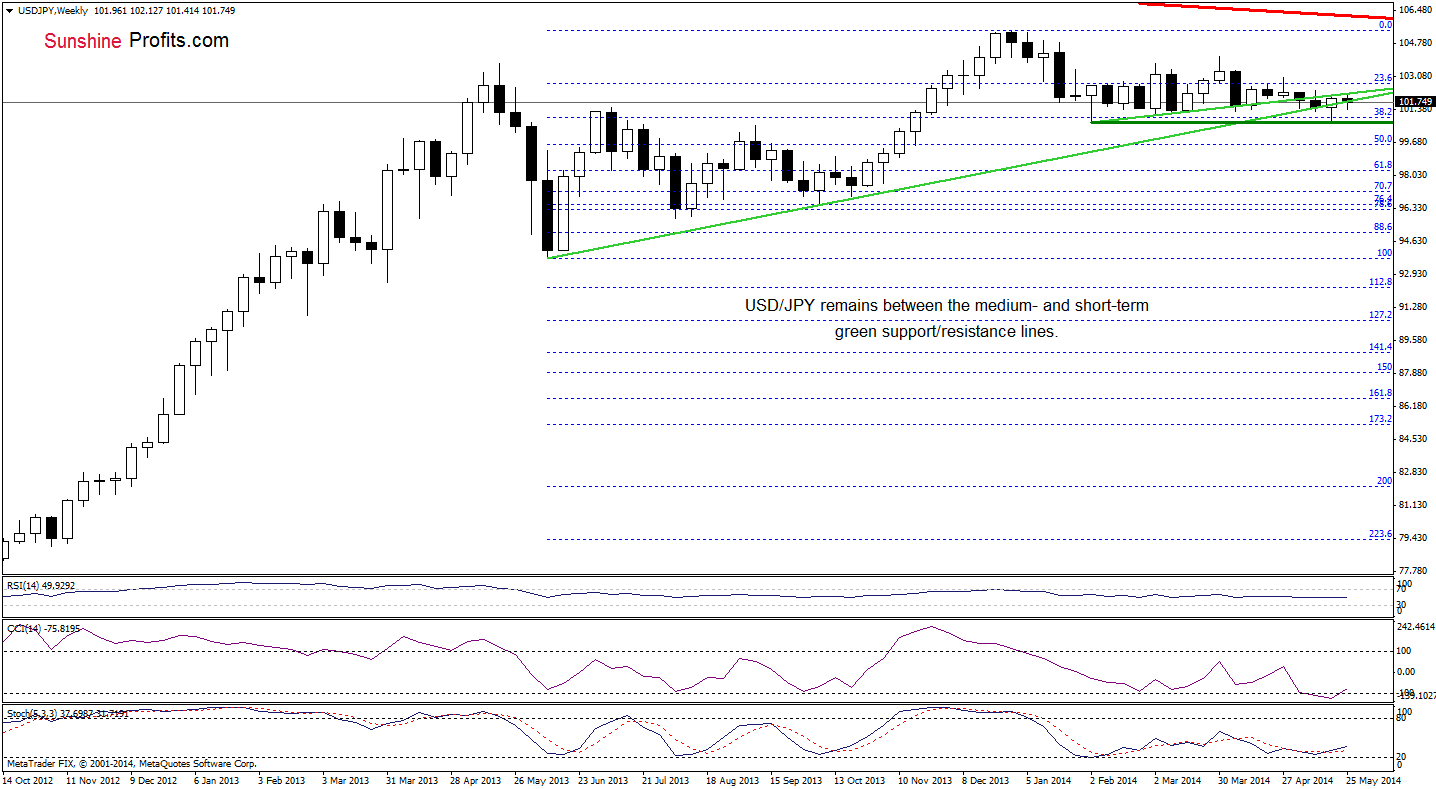
Looking at the weekly chart, we see that the situation has deteriorated as USD/JPY reversed after an increase to the upper green line. If the medium-term support line holds, we will see another attempt to move higher. As a reminder, a week ago we wrote the following:
(…) it seems that another sizable upswing will be more likely if the pair also breaks above the short-term green resistance line (currently around 102.04).
Nevertheless, if currency bears push the pair below this line, we may see a re-test of the strength of the May low of 100.81.
Having discussed the above, let’s take a closer look at the daily chart.
Quoting our last commentary on this currency pair:
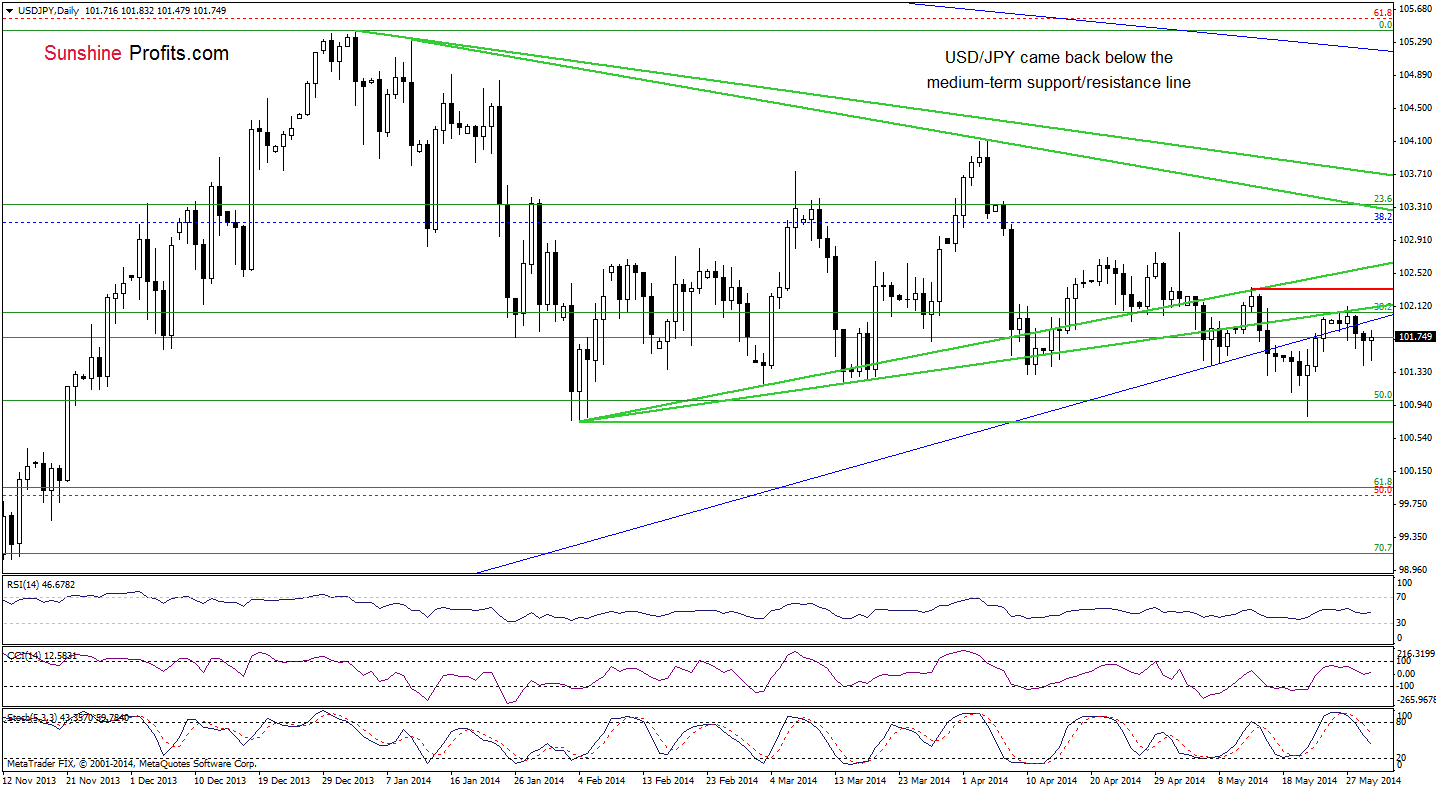
(…) the exchange rate could have a tough time breaking through the resistance zone created by the green short-term resistance lines and the May 13 high of 102.35. Nevertheless, taking into account buy signals generated by the indicators, such attempt seems more likely than not.
As you see on the daily chat, we noticed such price action earlier this week. However, as mentioned above, the resistance zone stopped further improvement and the very short-term situation has deteriorated as USD/JPY declined below the blue medium-term support/resistance line once again. An invalidation of the breakout is a bearish signal, therefore, another attempt to move lower should not surprise us – especially when we factor in the current position of the indicators (the RSI and CCI reversed, while the Stochastic Oscillator generated a sell signal).
Very short-term outlook: mixed with bearish bias
Short-term outlook: mixed with bearish bias
MT outlook: mixed
LT outlook: bearish
Trading position (short-term): In our opinion no positions are justified from the risk/reward perspective at the moment. We will keep you informed should anything change, or should we see a confirmation/invalidation of the above.
USD/CAD
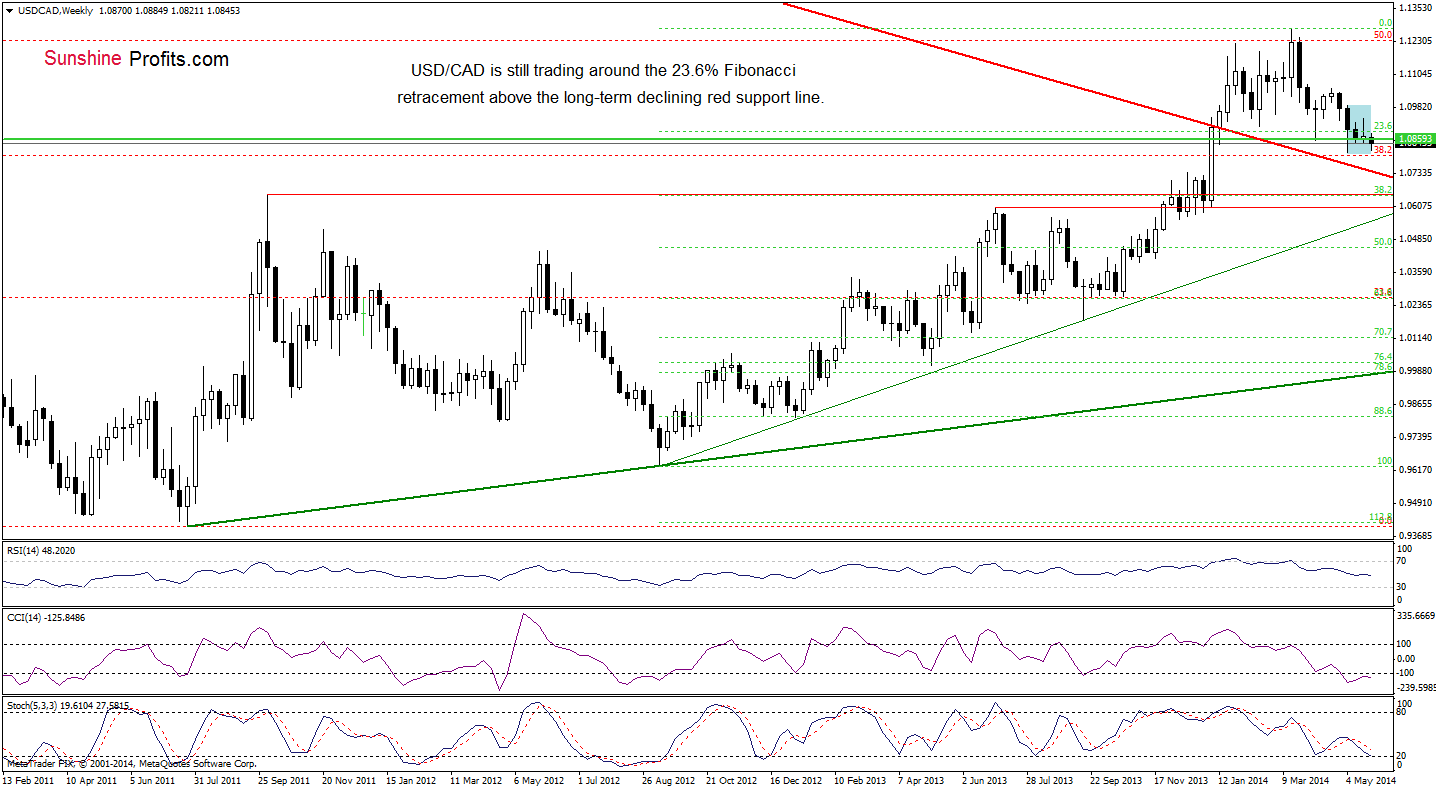
From the medium-term perspective, the overall situation hasn’t changed much as USD/CAD remains in a consolidation around the 23.6% Fibonacci retracement and the 2010 high. Therefore, what we wrote a week ago is still up-to date:
(…) the pair has been trading between 1.0813 and 1.0987 (the high and low that we saw at the turn of April and May) recently and it seems doubtful that we’ll see another sizable move before an earlier breakout above the upper line of the formation (or a breakdown below the lower line).
Will the short-term picture give us any clues about future moves?
Quoting our Forex Trading Alert posted on May 23:
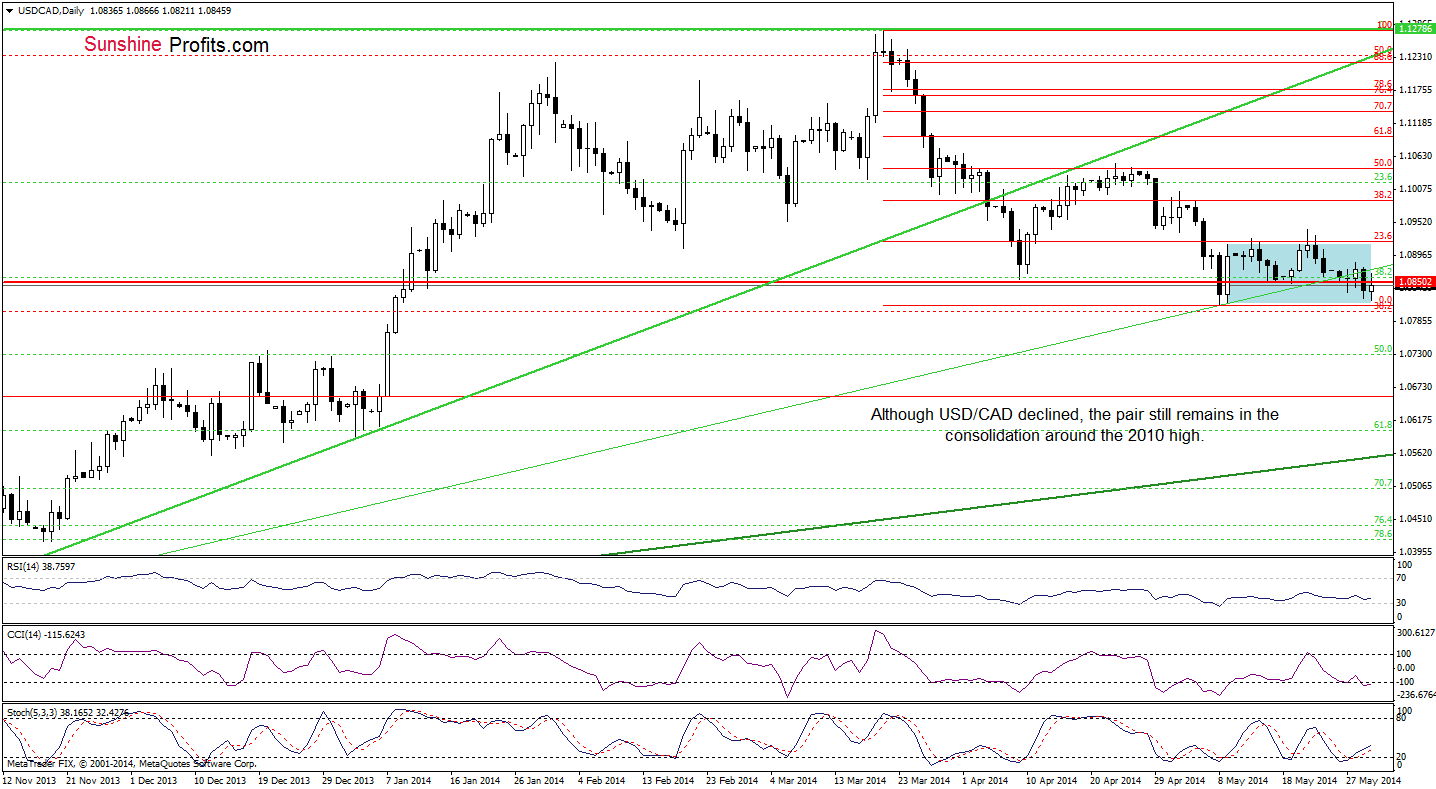
(…) there were another unsuccessful attempt to break above the upper line of the formation, which suggests that we may see a re-test of the strength of the green medium-term support line (the current position of the CCI and Stochastic Oscillator supports this bearish scenario at the moment). (…) if the pair drops below this major support line, we may see a decline to around 1.0815, where the lower border of the consolidation is.
On the above chart, we see that the very short-term situation has deteriorated slightly as USD/CAD declined below the green medium-term support line and approached the above-mentioned downside target. If the lower border of the consolidation holds, we will see a rebound and a try to come back above the green line, which serves as resistance at the moment. However, if this area is broken, the next downside target for currency bears will be the 50% Fibonacci retracement based on Sept.-March rally (around 1.0728).
Very short-term outlook: mixed
Short-term outlook: mixed
MT outlook: mixed
LT outlook: bearish
Trading position (short-term): In our opinion no positions are justified from the risk/reward perspective as the space for further declines may be limited. We will keep you informed should anything change, or should we see a confirmation/invalidation of the above.
USD/CHF
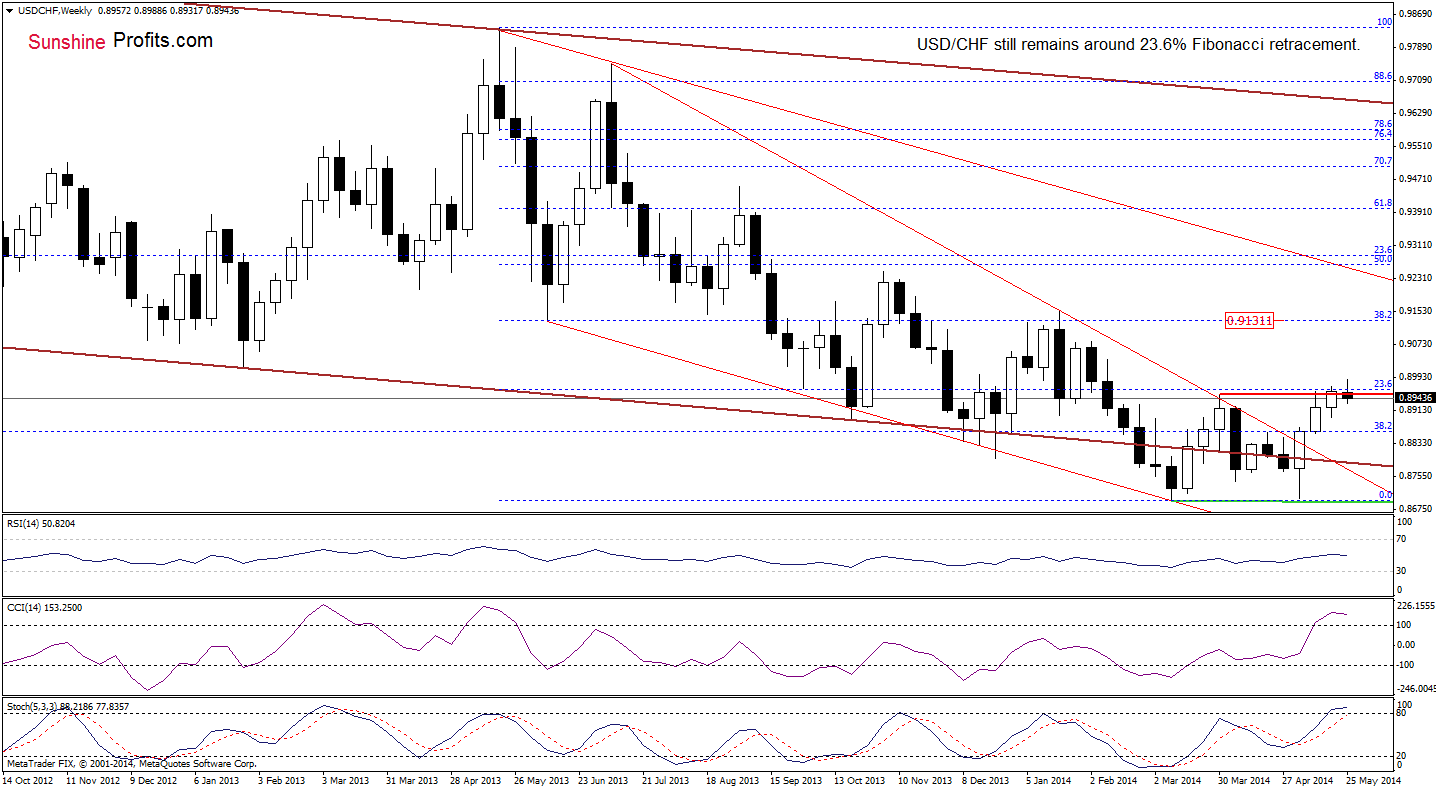
From the weekly perspective, we see that the situation in the madium term has deteriorated slightly as USD/CHF declined below the 23.6% Fibonaci retracement. Despite this drop, the exchange rate is still trading near the last week’s high. Therefore, we think that our last commentary on this currency pair is still valid:
(…) If the pair moves visibly higher (…), we may see further improvement and an increase to around 0.9131, where the 38.2% Fibonacci retracement is. However, if this area encourages forex traders to push the sell button, we will see a pullback and the initial downside target will be this week’s low of 0.8896.
What is the short-term picture? Let’s check.
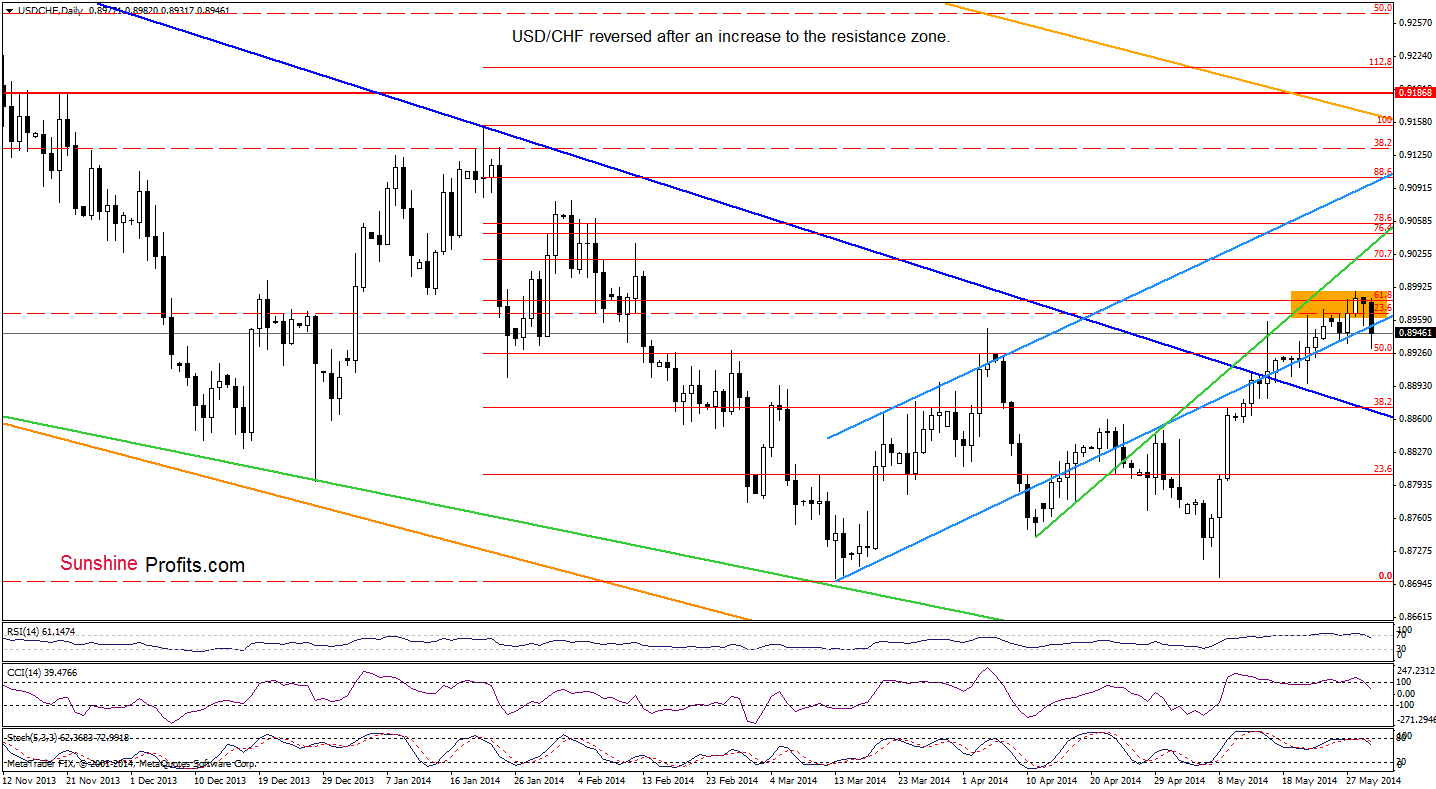
Quoting our Forex Trading Alert posted on May 23:
(…) although the situation has improved as USD/CHF broke above the resistance zone (…), the current position of the indicators suggests that a pause or correction is just around the corner. Please keep in mind that there are clearly visible negative divergences between the CCI, Stochastic Oscillator and the exchange rate. Additionally, the RSI climbed above the level of 70, which prescribes caution.
As you see on the above chart, despite these negative signals, the exchange rate moved little higher earlier this week. Nevertheless, the resistance zone created by the 23.6% Fibonacci retracement (based on the entire May 2013-March 2014 decline) and the 61.8% retracement (based on the Jan.-March decline) stopped further improvement and triggered a sharp correction earlier today. With this downswing, USD/CHF declined below the blue support, which suggests further deterioration – especially when we factor in sell signals generated by the indicators. If this is the case, the first downside target will be quite close – around 0.8921, where the 23.6% Fibonacci retracement based on the May rally is. If it is broken, we may see a drop to around 0.8879 (the 38.2% Fibonacci retracement) or even to the previously-broken blue declining support line (currently around 0.8870).
Very short-term outlook: bearish
Short-term outlook: mixed with bearish bias
MT outlook: mixed with bullish bias
LT outlook: bearish
Trading position (short-term): In our opinion no positions are justified from the risk/reward perspective. We will keep you informed should anything change, or should we see a confirmation/invalidation of the above.
AUD/USD
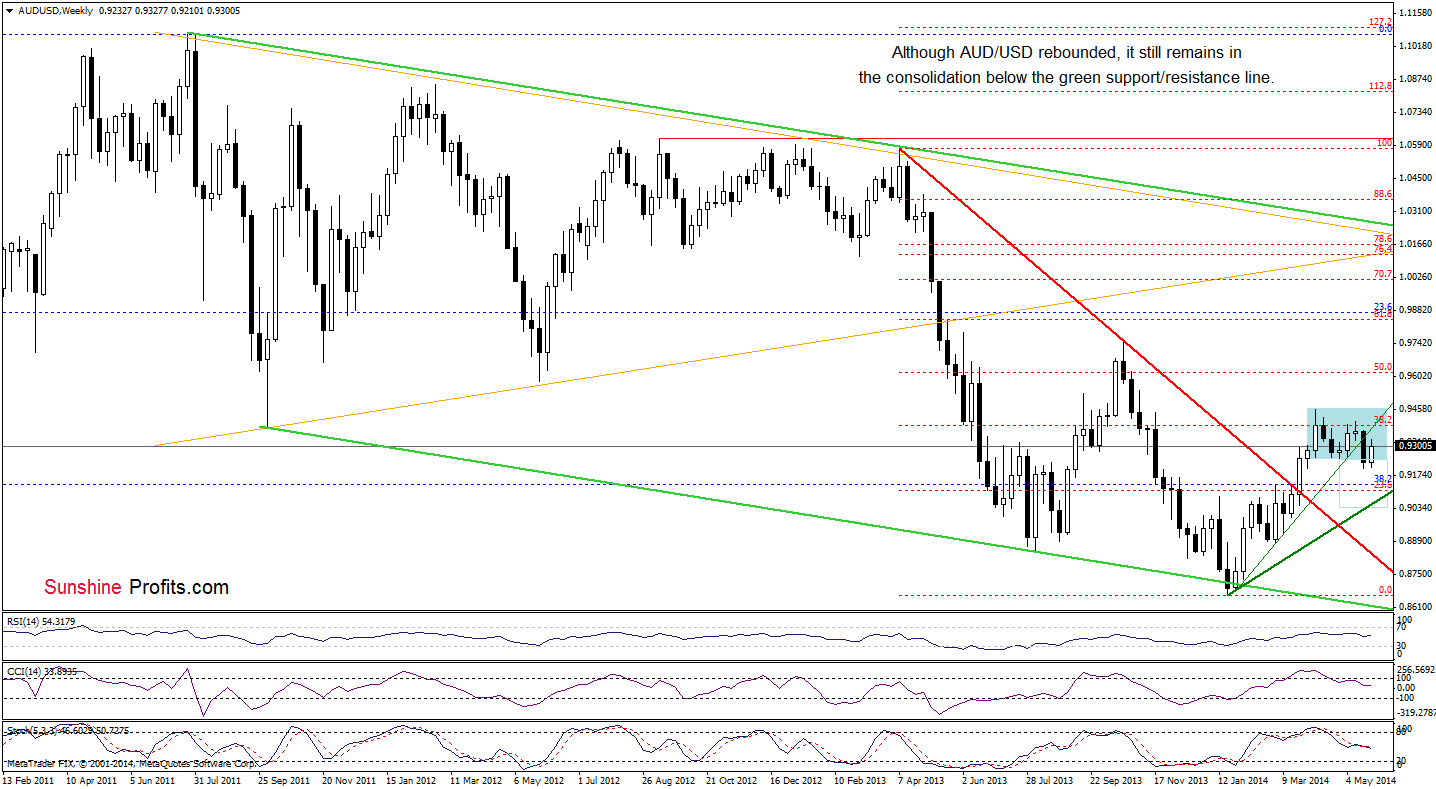
Although the medium-term situation has improved slightly as AUD/USD rebounded and came back to the consolidation range, the pair still remains below the previously-broken green resistance line. Additionally, sell signals generated by the indicators remain in place, supporting the bearish case.
Having say that, let’s focus on the short-term picture.
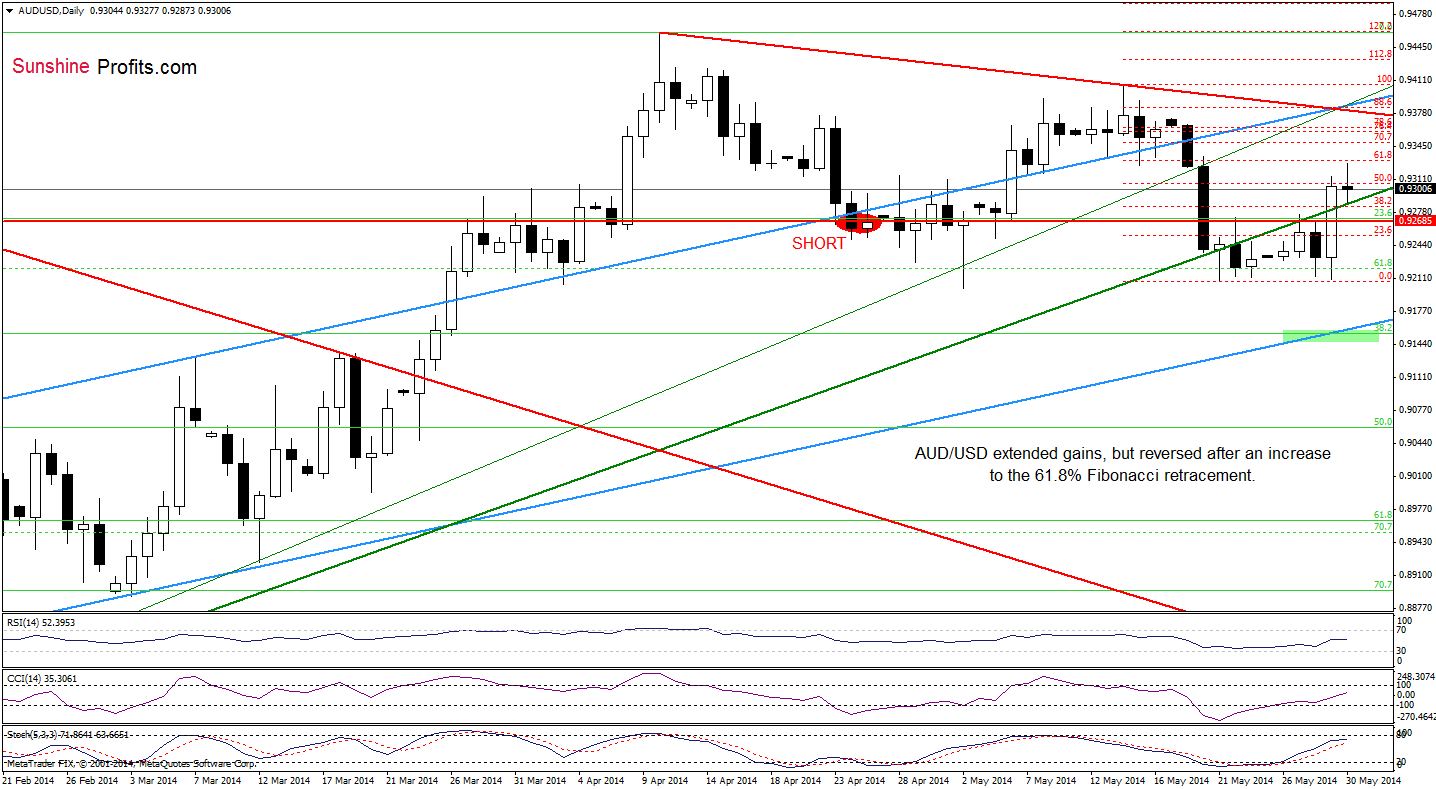
Looking at the daily chart, we see that although AUD/USD remains above the medium-term green support/resistance line, the 61.8% Fibonacci retracement based on the recent declines stopped gains. Thanks to this resistance level, the exchange rate reversed, approaching the previously-broken green line. In our opinion, as long as the exchange rate remains above this major support, another attempt to move higher can’t be ruled out. If this is the case, we think that a strong resistance zone (around 0.9380) created by the previously-broken thin green resistance line, the blue rising line and the red declining line based on the previous highs will be strong enough to stop further improvement. However, if AUD/USD drops below this green line, we’ll see further deterioration in the coming days and the initial downside target will be a resistance zone created by the May and yesterday’s lows.
Very short-term outlook: bearish
Short-term outlook: bearish
MT outlook: bearish
LT outlook: bearish
Trading position (short-term; our opinion): Short (the area where it was opened we marked with a red ellipse). Stop-loss order: 0.9410. We will keep you informed should anything change, or should we see a confirmation/invalidation of the above.
Thank you.
Nadia Simmons
Forex & Oil Trading Strategist
Przemyslaw Radomski, CFA
Founder, Editor-in-chief
Gold & Silver Trading Alerts
Forex Trading Alerts
Oil Investment Updates
Oil Trading Alerts

