
Earlier today, the Confederation of British Industry showed that U.K. retail sales slowed this month, declining to 16.0 from 30.0 in April. In reaction to this disappointing data, the pound dropped to a 2-week low against the U.S. dollar and broke below major support. What’s next? Will we see GBP/USD around 1.6700 in the coming days?
In our opinion the following forex trading positions are justified - summary:
- EUR/USD: short (stop-loss order: 1.4040)
- GBP/USD: none
- USD/JPY: none
- USD/CAD: none
- USD/CHF: none
- AUD/USD: short (stop-loss order: 0.9410)
EUR/USD
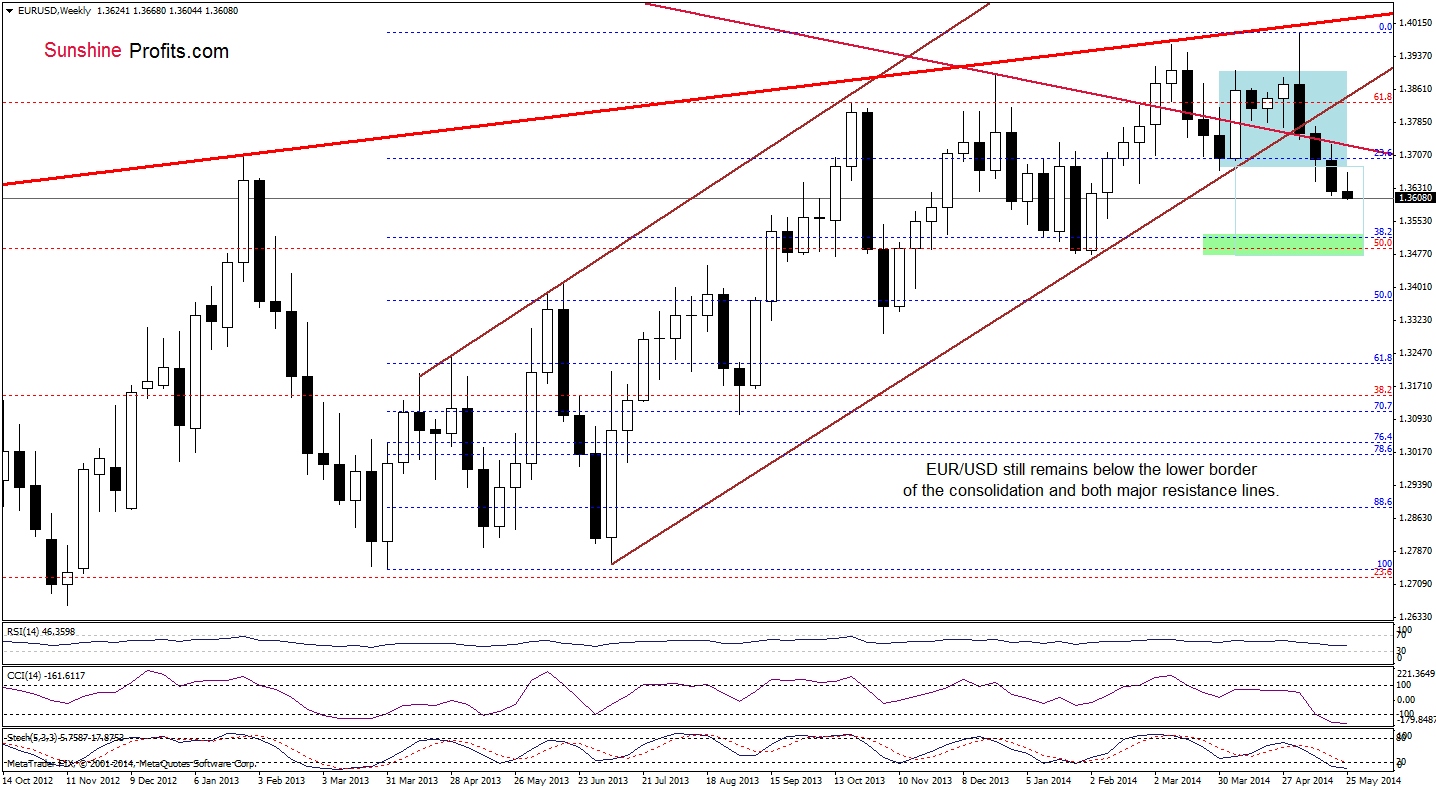
From the weekly perspective, the situation has deteriorated as EUR/USD extended losses and hit a fresh May low. Taking this bearish fact into account, we believe that what we wrote on Friday remains up-to-date:
(…) as long as there is no invalidation of the breakdown under these lines, further deterioration is likely. If this is the case, and the exchange rate extends losses in the coming week (or weeks), the downside target will be around 1.3516 (where the 38.2% Fibonacci retracement based on the entire March 2013-May 2014 is) or even slightly lower – around 1.3480, where the bottom of the previous bigger correction (between Dec. and Feb.) is.
Once we know the above, let’s focus on the daily chart.
Quoting our previous Forex Trading Alert:
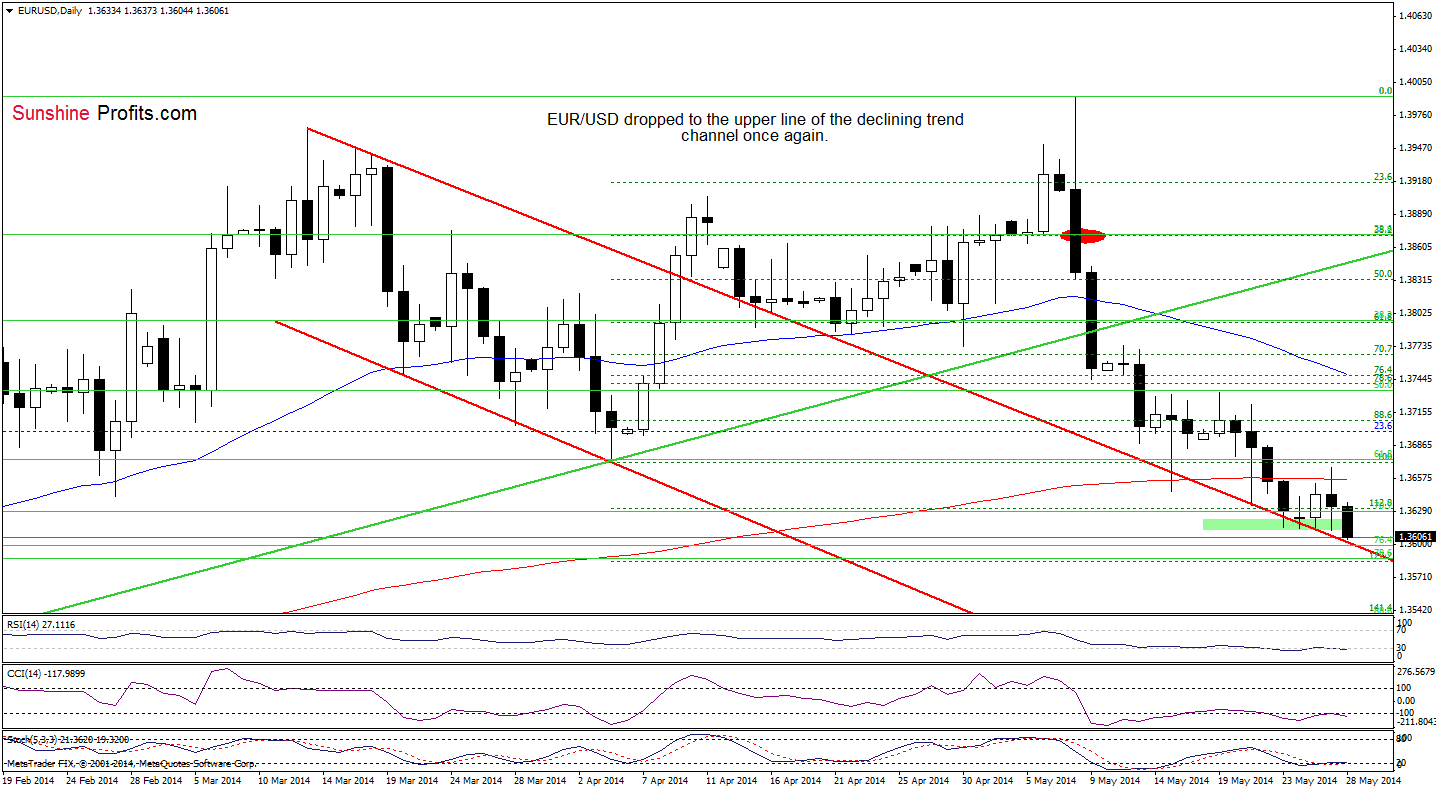
(…) although the exchange rate climbed above the previously-broken 200-day moving average, (…) the pair reversed and declined to the previous lows (…) this area is (…) supported by the 70.7% Fibonacci retracement (based on the entire Feb.-May rally) and the 128.2% Fibonacci extension (based on the Apr.-May rally) (…) If this strong support holds, we will see a corrective upswing in the near future. However, if it is broken, EUR/USD will extend losses and the initial downside target will be around 1.3586-1.3598, where the 76.4% and 78.6% Fibonacci retracement levels are.
Looking at the daily chart, we clearly see that EUR/USD dropped below the previous lows and reached the upper line of the declining trend channel, approaching the above-mentioned downside target. If the combination of this major support line and Fibonacci retracements withstands the selling pressure, we may see a comeback to the previously-broken 200-day moving average (the position of the daily indicators supports this scenario at the moment). However, if this strong support zone doesn’t encourage forex traders to push the buy button, we will likely see further deterioration and the next downside target will be around 1.3540, where the 88.6% Fibonacci retracement (based on the entire Feb.-May rally) meets the 141.4% Fibonacci extension (based on the Apr.-May rally).
Before we summarize this currency pair, we would like to emphasize the quote from our Forex Trading Alert posted on May 19:
(…) In our opinion, the breakout in the USD Index above the medium-term resistance line can trigger a significant rally soon - even without the above-mentioned correction. Therefore, we remain bearish on EUR/USD.
Very short-term outlook: bearish
Short-term outlook: bearish
MT outlook: bearish
LT outlook: bearish
Trading position (short-term): Short. Stop-loss order: 1.4040. The short position (the area where it was opened we marked with a red ellipse) featured on May 8th when EUR/USD was still above the 50-day moving average (blue line in the chart) remains profitable. We will keep you informed should anything change, or should we see a confirmation/invalidation of the above.
GBP/USD
Quoting our Forex Trading Alert posted on Friday:
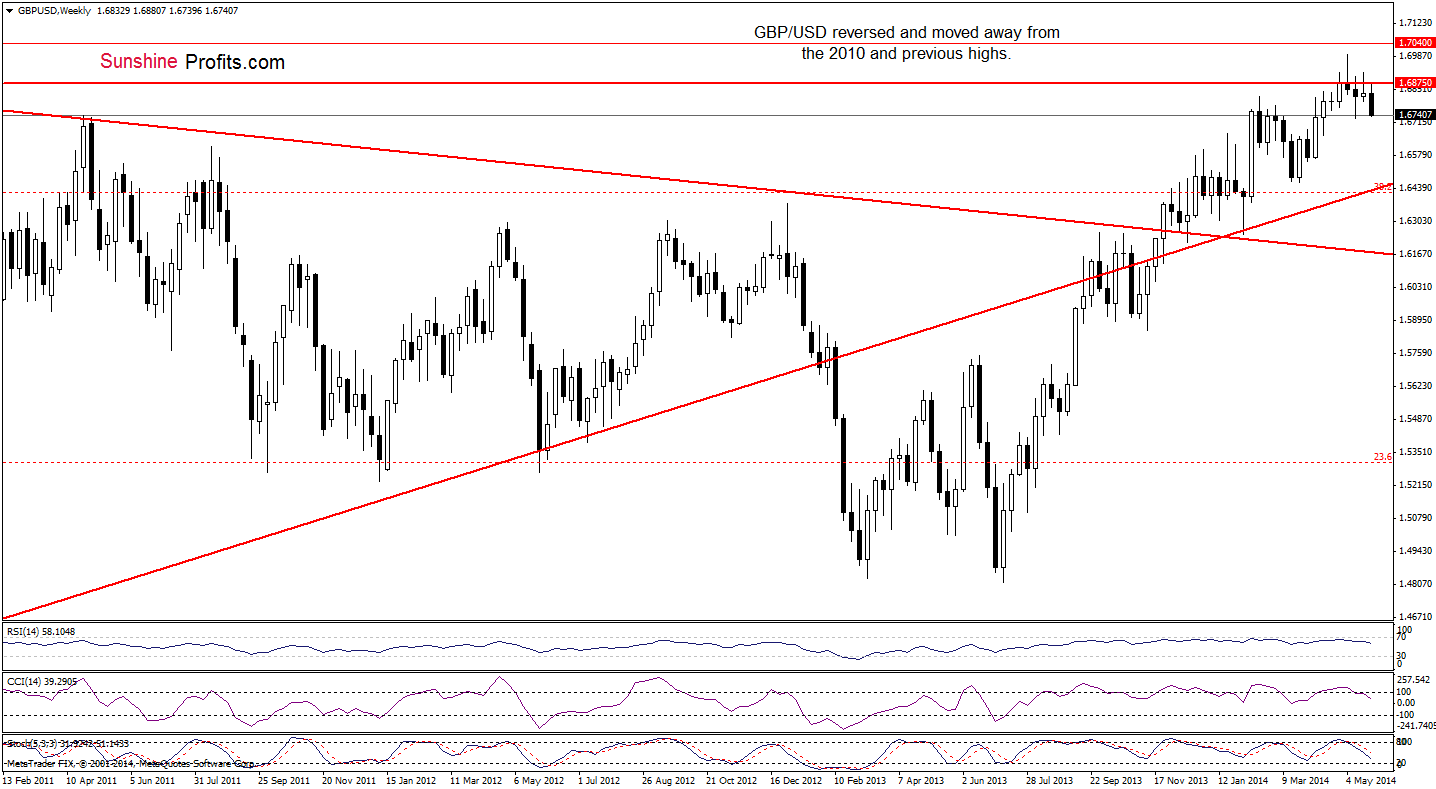
(…) GBP/USD still remains slightly below the resistance zone created by the Nov. 2009 and May highs. If this area encourages forex traders to push the sell button, we will likely see a correction in the coming week (this scenario is currently in tune with sell signals generated by the CCI and Stochastic Oscillator).
As you see on the above chart, we noticed such price action this week. With the downward move, the pair approached the May low, but it seems doubtful to us that this support level stop further deterioration. Why? Let’s take a closer look at the daily chart.
In our last commentary on this currency pair, we wrote the following:
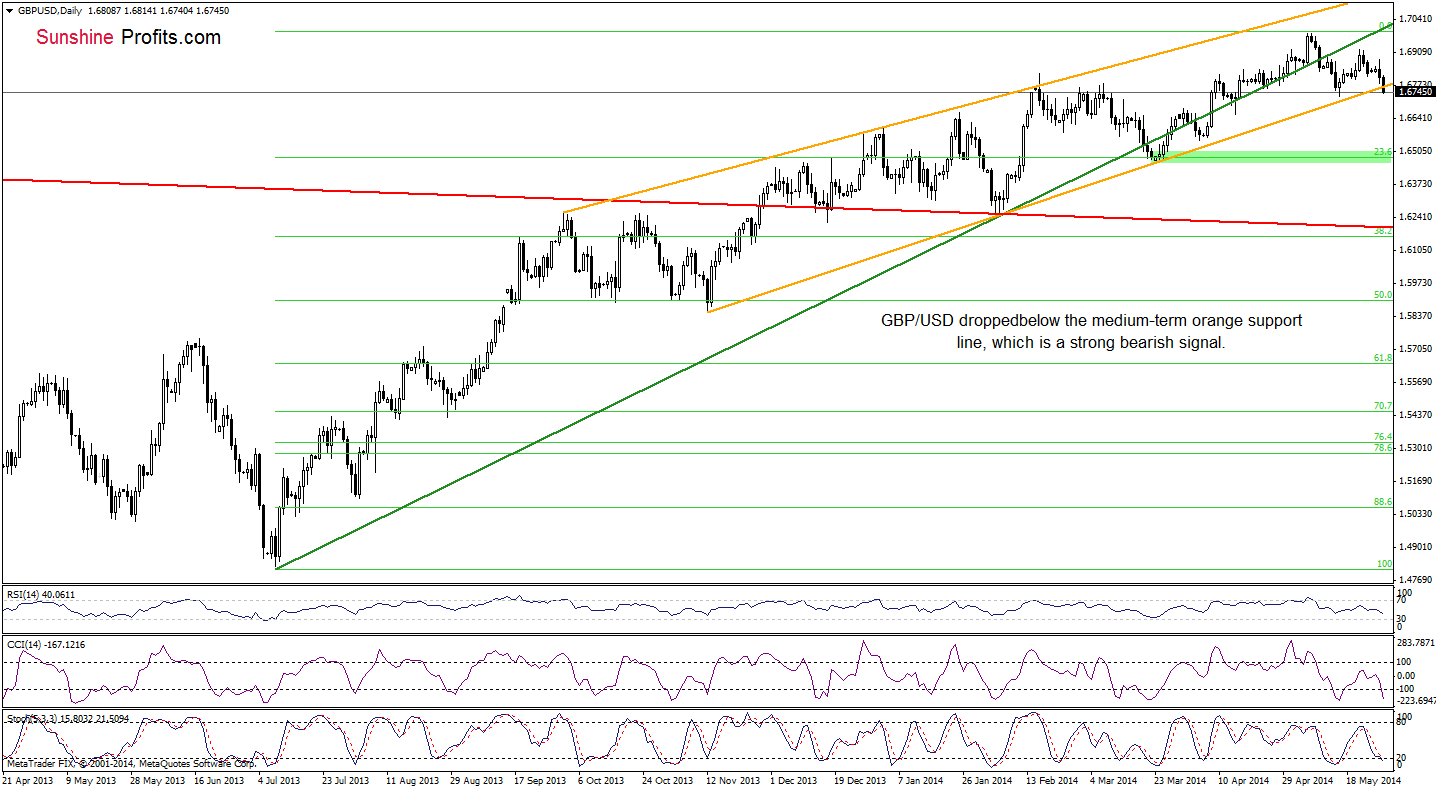
(…) the proximity to the previously-broken medium-term rising green resistance line triggered another downward move and GBP/USD approached levels that we saw a week ago (…) it seems to us that as long as the breakdown below this important line is not invalidated, another attempt to move lower is likely. Nevertheless, we should keep in mind that another sizable downswing will be likely only if the pair declines below the medium-term orange support line.
Looking at the above chart, we see that the situation in the short term has deteriorated as GBP/USD dropped below the medium-term orange support line. If the breakdown is not invalidated, such price action will likely trigger further deterioration and the initial downside target will be around 1.6666, where the 61.8% Fibonacci retracement (based on the March-May rally) and the Apr. 15 low are.
Very short-term outlook: bearish
Short-term outlook: bearish
MT outlook: bearish
LT outlook: mixed
Trading position (short-term): In our opinion, no positions are justified from the risk/reward perspective. We will keep you informed should anything change, or should we see a confirmation/invalidation of the above.
AUD/USD
The medium-term situation hasn’t changed much as AUD/USD still remains below the lower border of the consolidation range. Today, we’ll focus only on the short-term picture.
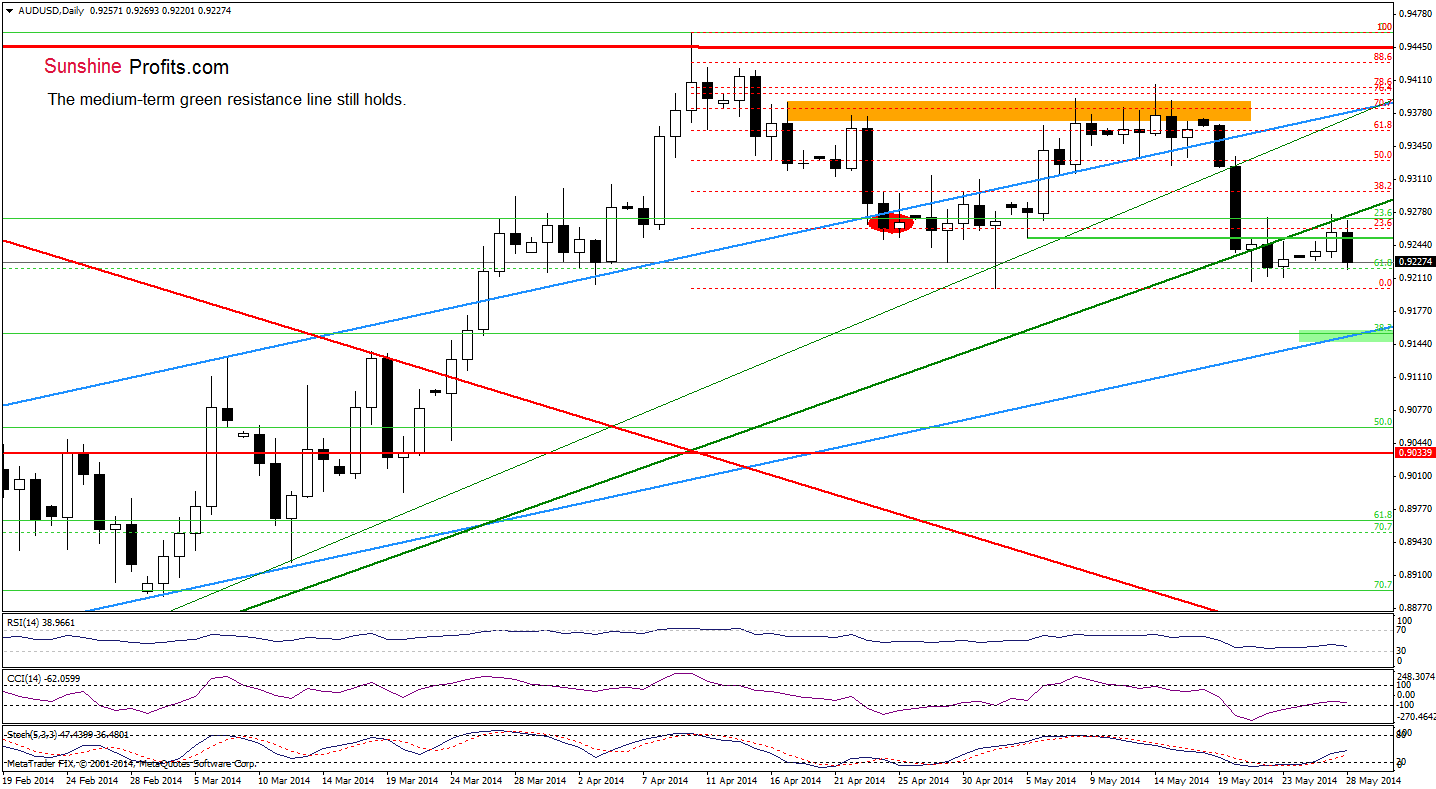
Looking at the daily chart, we see that although AUD/USD moved higher earlier today, the medium-term green resistance line stopped further improvement and the pair reversed for the fourth time. Taking into account the fact that all attempts to break above this major resistance line failed, we think that further deterioration is likely and the first downside target will be the May low. If this support level doesn’t stop the current correction, we will likely see a drop to the 38.2% Fibonacci retracement based on the entire Jan.-Apr. rally (around 0.9154), which is currently reinforced by the blue rising support line (the lower border of the rising trend channel).
Very short-term outlook: bearish
Short-term outlook: bearish
MT outlook: bearish
LT outlook: bearish
Trading position (short-term): Short (the area where it was opened we marked with a red ellipse). Stop-loss order: 0.9410. We will keep you informed should anything change, or should we see a confirmation/invalidation of the above.
Thank you.
Nadia Simmons
Forex & Oil Trading Strategist
Przemyslaw Radomski, CFA
Founder, Editor-in-chief
Gold & Silver Trading Alerts
Forex Trading Alerts
Oil Investment Updates
Oil Trading Alerts

