
Earlier today the euro extended losses, hitting a fresh over 3-month low against the U.S dollar as yesterday’s disappointing euro zone data continued to weigh. Meanwhile, USD/JPY and USD/CHF moved higher, breaking above important resistance lines. What impact did these moves have on the short-term outlooks? Did they weighed on the medium-term pictures?
In our opinion the following forex trading positions are justified - summary:
- EUR/USD: short (stop-loss order: 1.4040)
- GBP/USD: none
- USD/JPY: none
- USD/CAD: none
- USD/CHF: none
- AUD/USD: short (stop-loss order: 0.9410)
EUR/USD
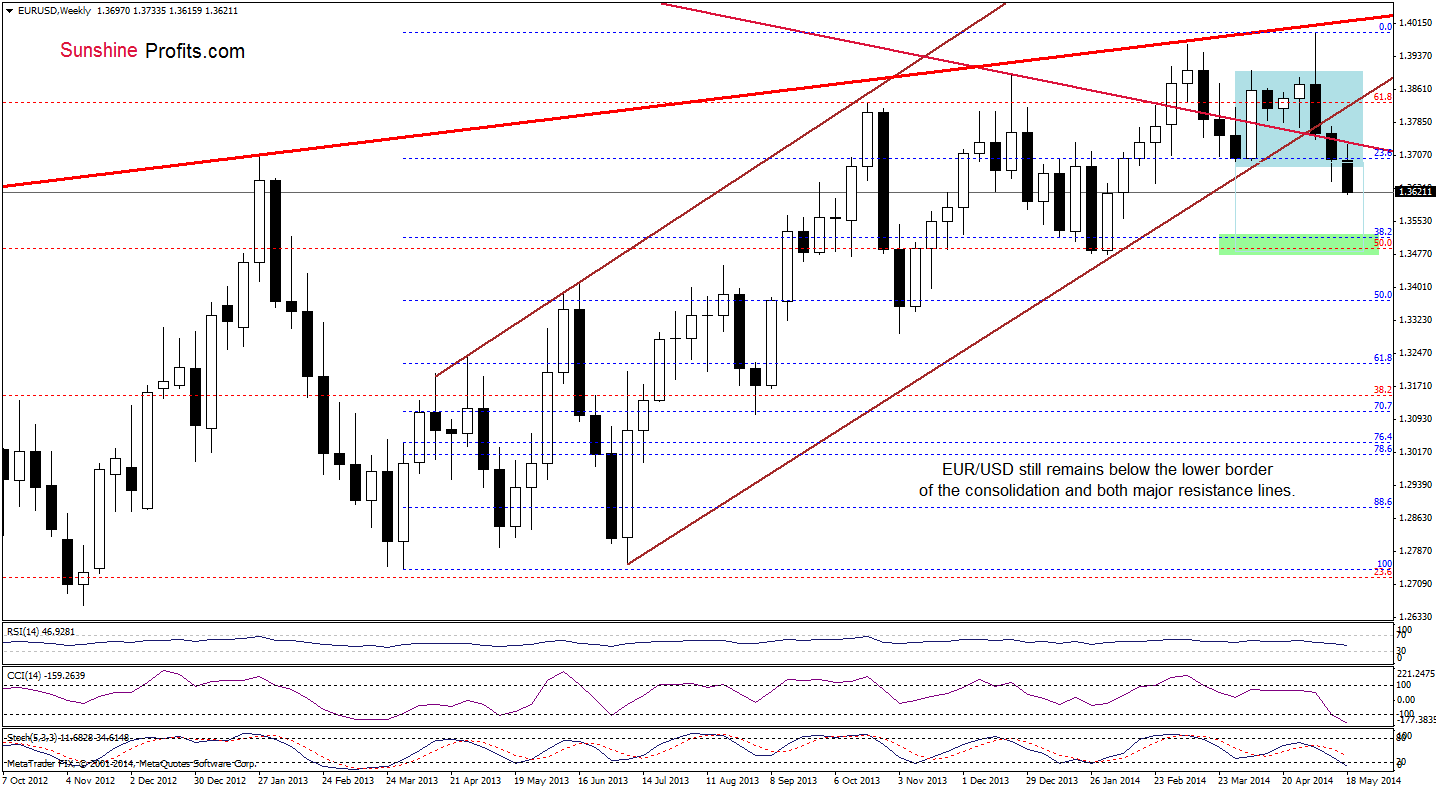
As you see on the above chart, the situation in the medium term has deteriorated as EUR/USD extended losses and hit a fresh May low. Taking this bearish fact into account, we are convinced that what we wrote a week ago is still up-to-date:
(…) as long as there is no invalidation of the breakdown under these lines, further deterioration is likely. If this is the case, and the exchange rate extends losses in the coming week (or weeks), the downside target will be around 1.3516 (where the 38.2% Fibonacci retracement based on the entire March 2013-May 2014 is) or even slightly lower – around 1.3480, where the bottom of the previous bigger correction (between Dec. and Feb.) is.
Having discussed the above, let’s focus on the short-term perspective.
Quoting our previous Forex Trading Alert:
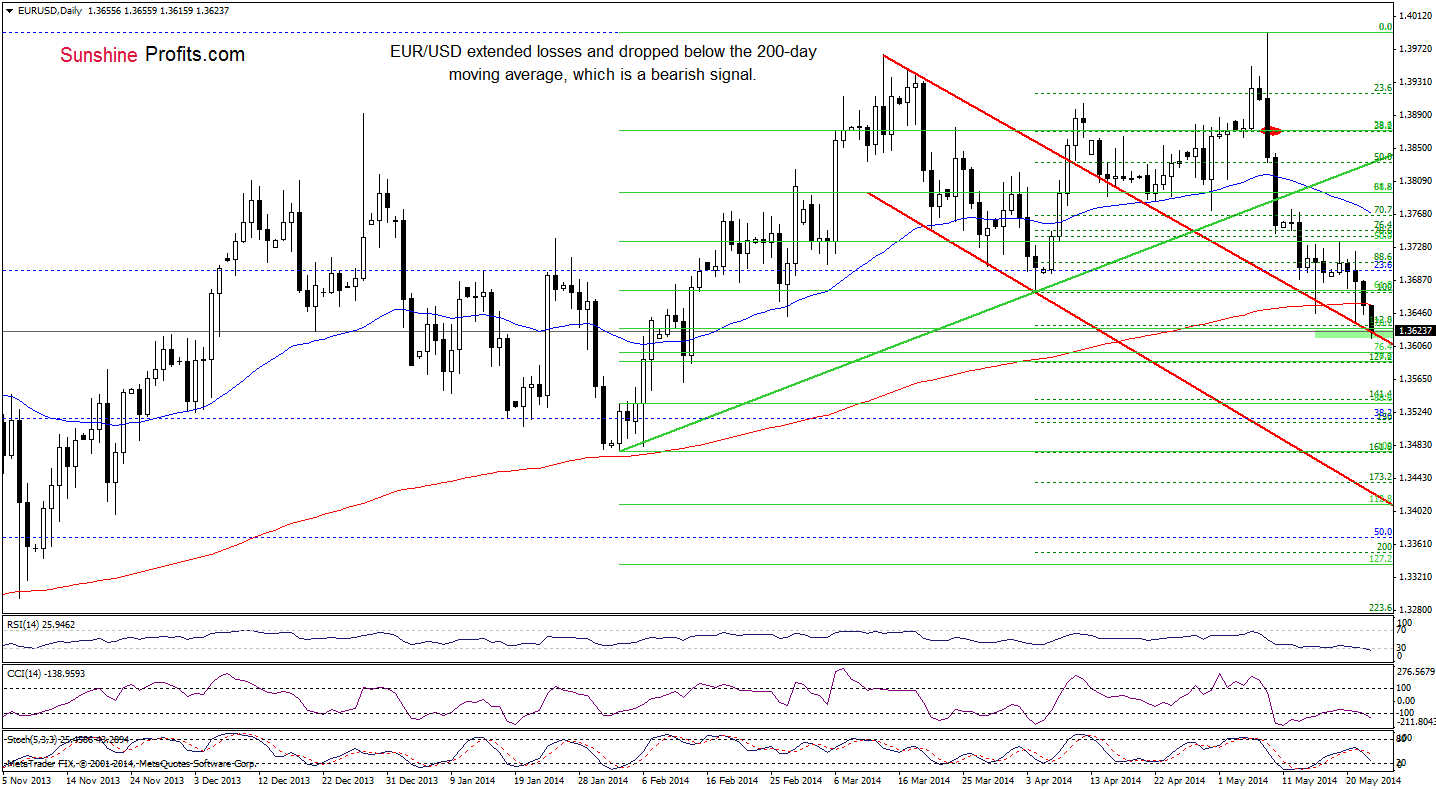
(…) the pair reversed and declined below the 200-day moving average once again. To us, this weakness signifies that the pair will likely re-test the strength of the upper border of the declining trend channel (currently around 1.3629).
Looking at the daily chart, we see that currency bears realized the above-mentioned scenario earlier today. Although EUR/USD rebounded slightly in the following hours, it’s doubtful to us that this small upswing will be able to reverse the very short-term downtrend. Nevertheless, we should keep in mind that this area is also supported by the 70.7% Fibonacci retracement (based on the entire Feb.-May rally) and the 128.2% Fibonacci extension (based on the Apr.-May rally). Taking this fact into account, we would like to draw your attention to what we wrote yesterday:
(…) If this strong support holds, we will see a corrective upswing in the near future. However, if it is broken, EUR/USD will extend losses and the initial downside target will be around 1.3586-1.3598, where the 76.4% and 78.6% Fibonacci retracement levels are. Please note that the current position of the indicators supports the bearish case.
Before we summarize this currency pair, we would like to emphasize the quote from our Forex Trading Alert posted on Monday:
(…) In our opinion, the breakout in the USD Index above the medium-term resistance line can trigger a significant rally soon - even without the above-mentioned correction. Therefore, we remain bearish on EUR/USD.
Very short-term outlook: bearish
Short-term outlook: bearish
MT outlook: bearish
LT outlook: bearish
Trading position (short-term): Short. Stop-loss order: 1.4040. The short position (the area where it was opened we marked with a red ellipse) featured on May 8th when EUR/USD was still above the 50-day moving average (blue line in the chart) remains profitable. We will keep you informed should anything change, or should we see a confirmation/invalidation of the above.
GBP/USD
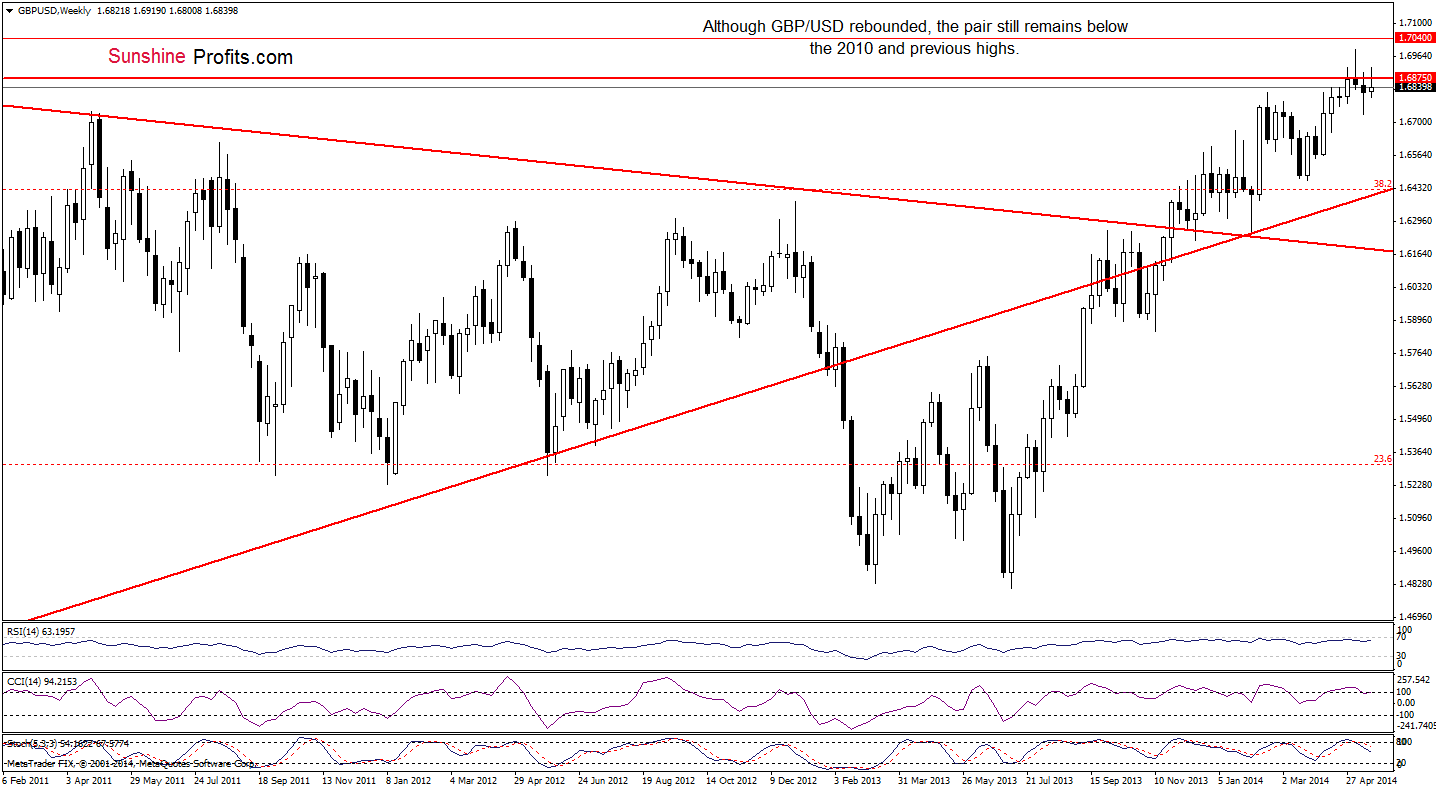
From the weekly perspective, we see that the situation hasn’t changed much as GBP/USD still remains slightly below the resistance zone created by the Nov. 2009 and May highs. If this area encourages forex traders to push the sell button, we will likely see a correction in the coming week (this scenario is currently in tune with sell signals generated by the CCI and Stochastic Oscillator). However, if the exchange rate breaks above this resistance zone, we may see an increase even to the 2009 high of 1.7040.
Let’s take a closer look at the daily chart.
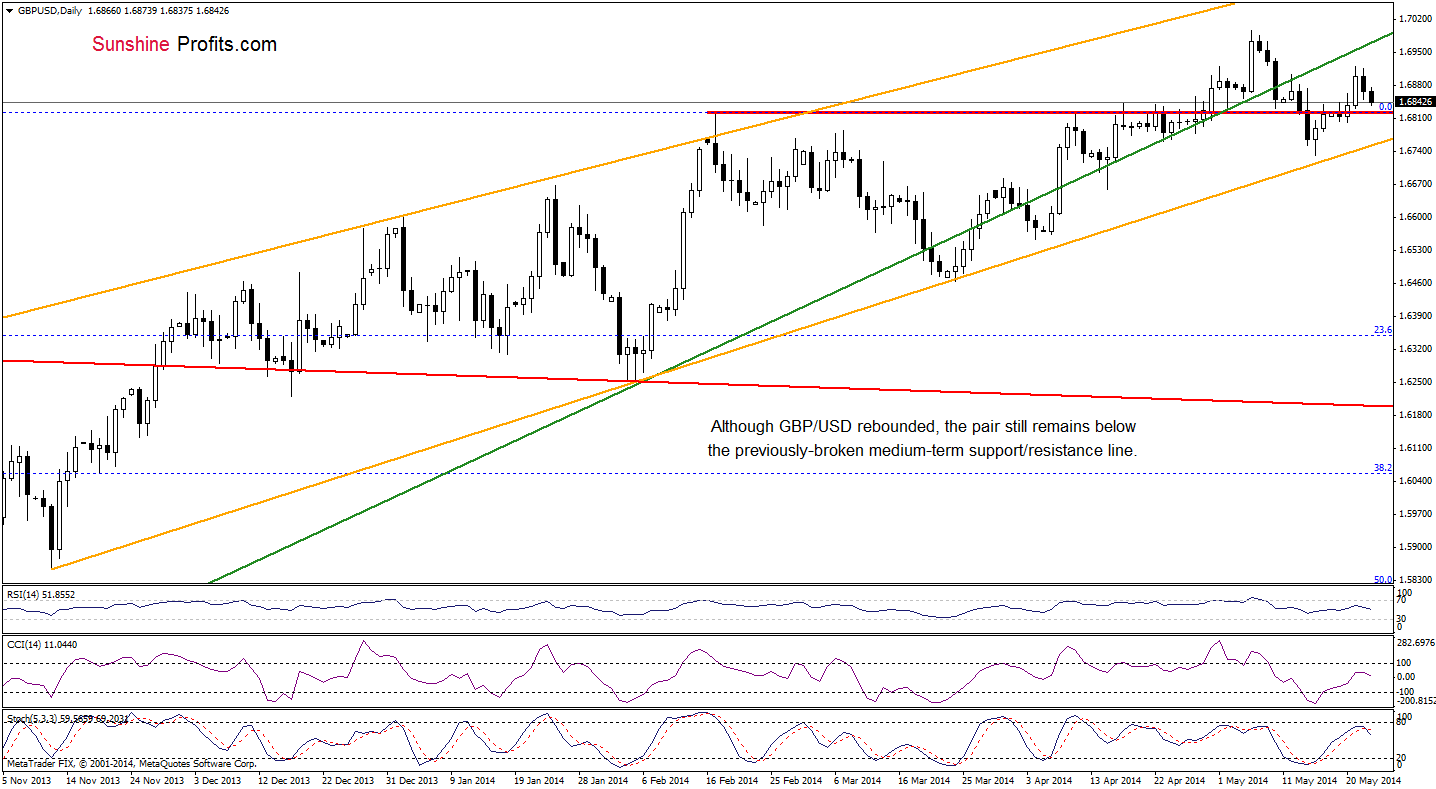
Looking at the daily chart, we see that although the exchange rate moved little higher, the proximity to the previously-broken medium-term rising green resistance line triggered another downward move and GBP/USD approached levels that we saw a week ago. Therefore, what we wrote in our Forex Trading Alert posted on May 16 is still up-to-date:
(…) it seems to us that as long as the breakdown below this important line is not invalidated, another attempt to move lower is likely. Nevertheless, we should keep in mind that another sizable downswing will be likely only if the pair declines below the medium-term orange support line.
Very short-term outlook: mixed
Short-term outlook: mixed with bearish bias
MT outlook: bearish
LT outlook: mixed
Trading position (short-term): In our opinion, no positions are justified from the risk/reward perspective. We will keep you informed should anything change, or should we see a confirmation/invalidation of the above.
USD/JPY
A week ago, we wrote the following:
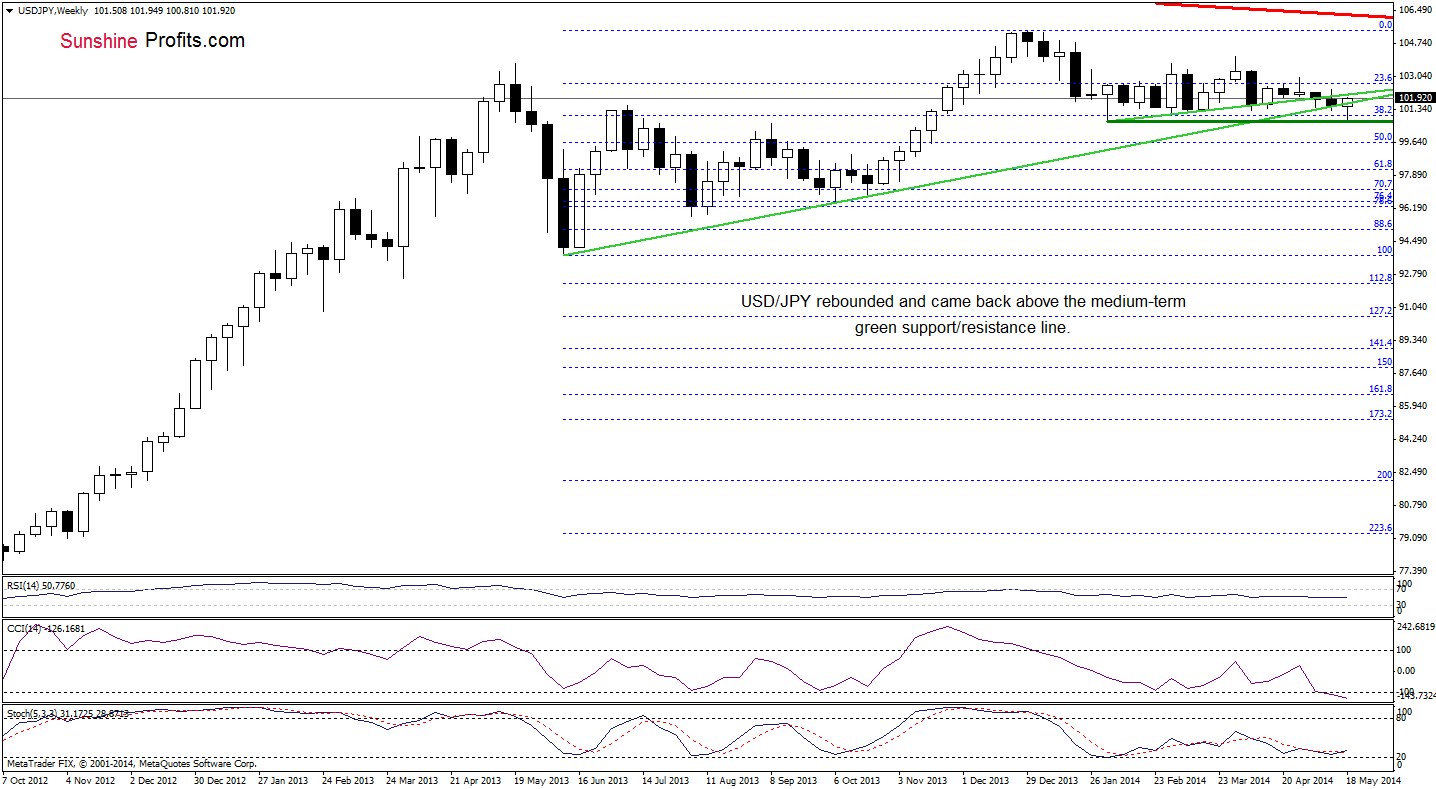
(…) USD/JPY moved lower this week, which resulted in a small decline below the medium-term green line. This is a bearish signal and (…) we may see further deterioration and a drop to the February or March low (around 100.74-101.20). In our opinion, another sizable upswing will be likely only if the pair breaks above the short-term green resistance line (currently around 102).
Looking at the weekly chart, we see that currency bears realized the above-mentioned scenario, approaching the Feb. low earlier this week. From this perspective, we also see that the strong support level held, which resulted in a rebound that took back the pair above the medium-term green line. In this way, the breakdown below this support/resistance line was invalidated, which is a strong bullish signal. Nevertheless, as we mentioned a week ago, it seems that another sizable upswing will be more likely if the pair also breaks above the short-term green resistance line (currently around 102.04).
Having discussed the above, let’s take a closer look at the daily chart.
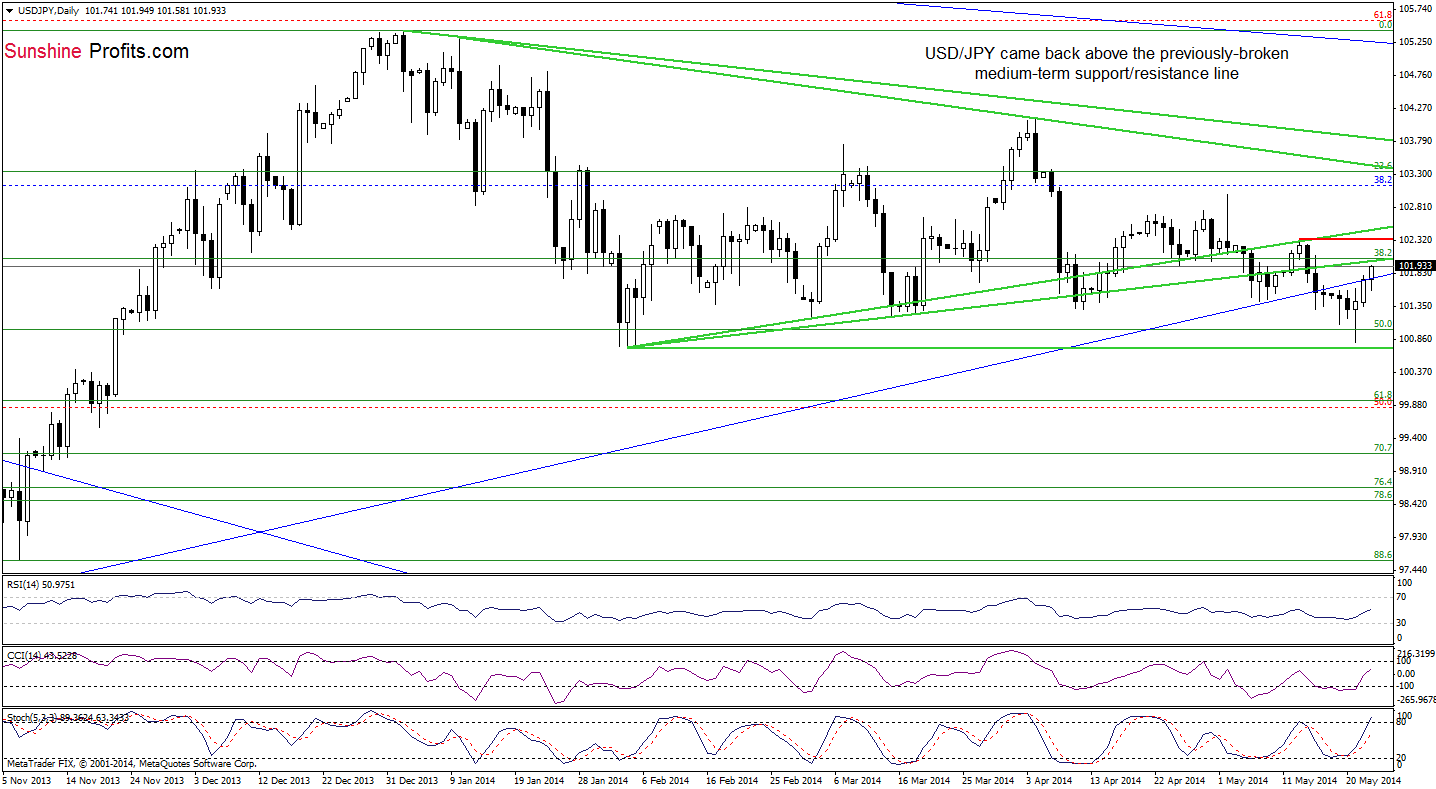
On the daily chart, we see that the very short-term situation has improved as USD/JPY came back above the blue medium-term resistance line. As we mentioned earlier, an invalidation of the breakdown is a strong bullish signal, however, the exchange rate could have a tough time breaking through the resistance zone created by the green short-term resistance lines and the May 13 high of 102.35. Nevertheless, taking into account buy signals generated by the indicators, such attempt seems more likely than not.
Very short-term outlook: mixed
Short-term outlook: mixed
MT outlook: mixed
LT outlook: bearish
Trading position (short-term): In our opinion no positions are justified from the risk/reward perspective at the moment. We will keep you informed should anything change, or should we see a confirmation/invalidation of the above.
USD/CAD
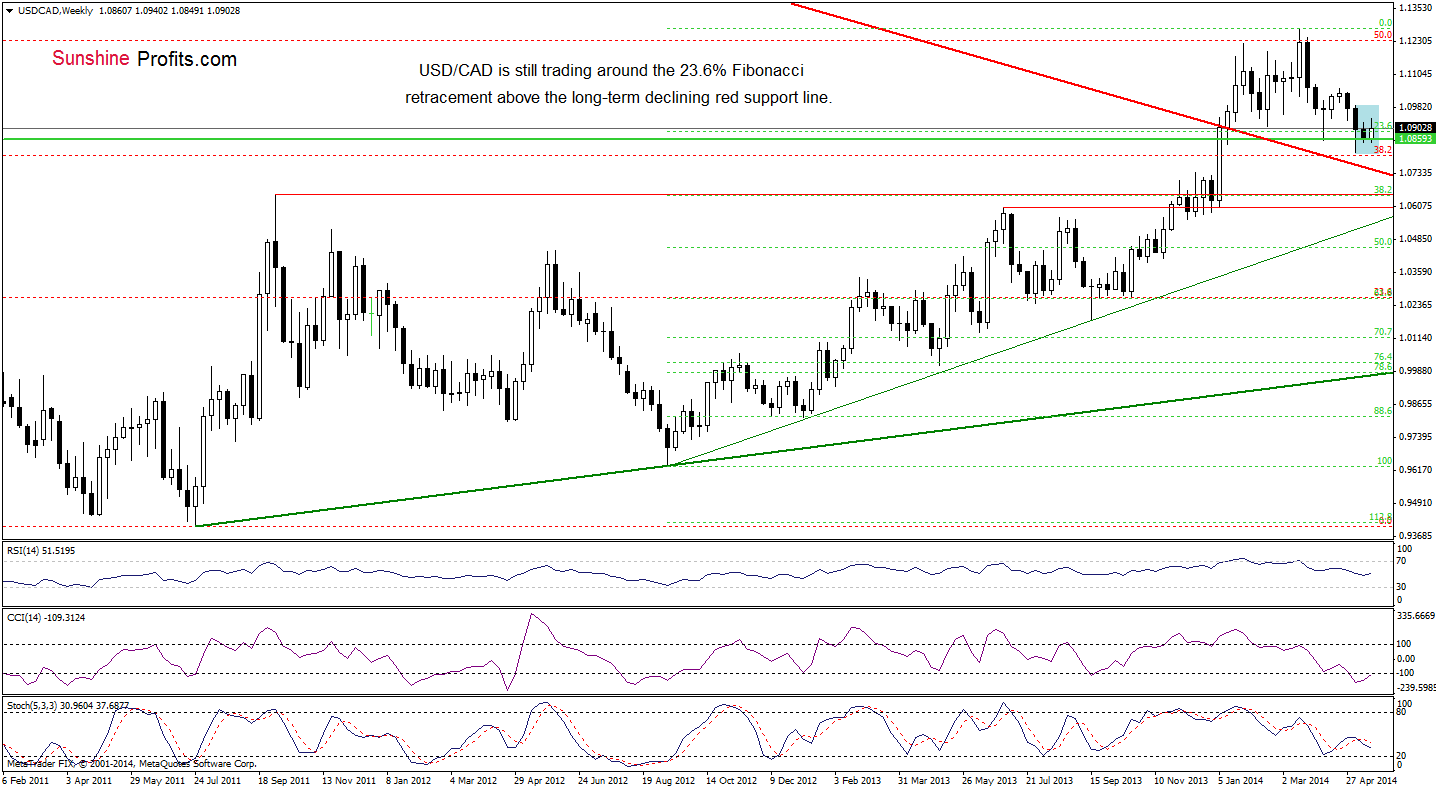
From the medium-term perspective, the overall situation hasn’t changed much as USD/CAD remains in a consolidation around the 23.6% Fibonacci retracement and the 2010 high. The pair has been trading between 1.0813 and 1.0987 (the high and low that we saw at the turn of April and May) recently and it seems doubtful that we’ll see another sizable move before an earlier breakout above the upper line of the formation (or a breakdown below the lower line).
Will the short-term picture give us any clues about future moves?
On Tuesday, we wrote the following:
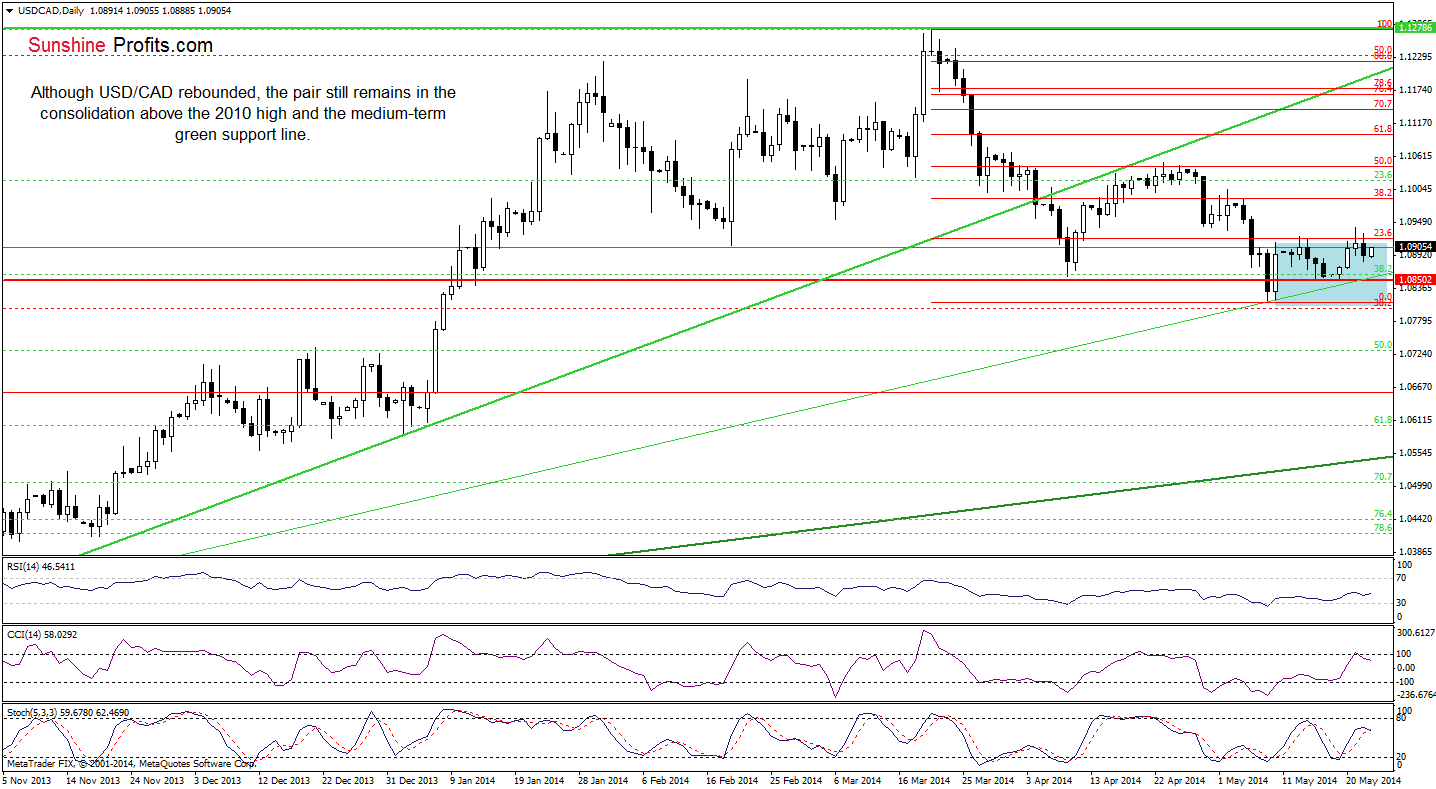
(…) we think that as long as the exchange rate remains in a consolidation, another sizable upward move is not likely to be seen. In our opinion, only if the pair breaks above the upper line of the formation, we will see an increase to around 1.1014 (where the size of the upswing after a breakout will correspond to the height of the consolidation) or even to around 1.1043, where the 50% Fibonacci retracement (based on the entire recent decline) meets the Apr.25 high.
On the above chart, we see that the very short-term situation hasn’t changed much since our last commentary was posted. Nevertheless, we would like to emphasize that there were another unsuccessful attempt to break above the upper line of the formation, which suggests that we may see a re-test of the strength of the green medium-term support line (the current position of the CCI and Stochastic Oscillator supports this bearish scenario at the moment). If it holds, we will see a rebound and another try to break above the upper line of the consolidation. However, if the pair drops below this major support line, we may see a decline to around 1.0815, where the lower border of the consolidation is. Please keep in mind that if this area is broken, the next downside target for currency bears will be the 50% Fibonacci retracement based on Sept.-March rally (around 1.0728).
Very short-term outlook: mixed
Short-term outlook: mixed
MT outlook: mixed
LT outlook: bearish
Trading position (short-term): In our opinion no positions are justified from the risk/reward perspective as the space for further declines may be limited. We will keep you informed should anything change, or should we see a confirmation/invalidation of the above.
USD/CHF
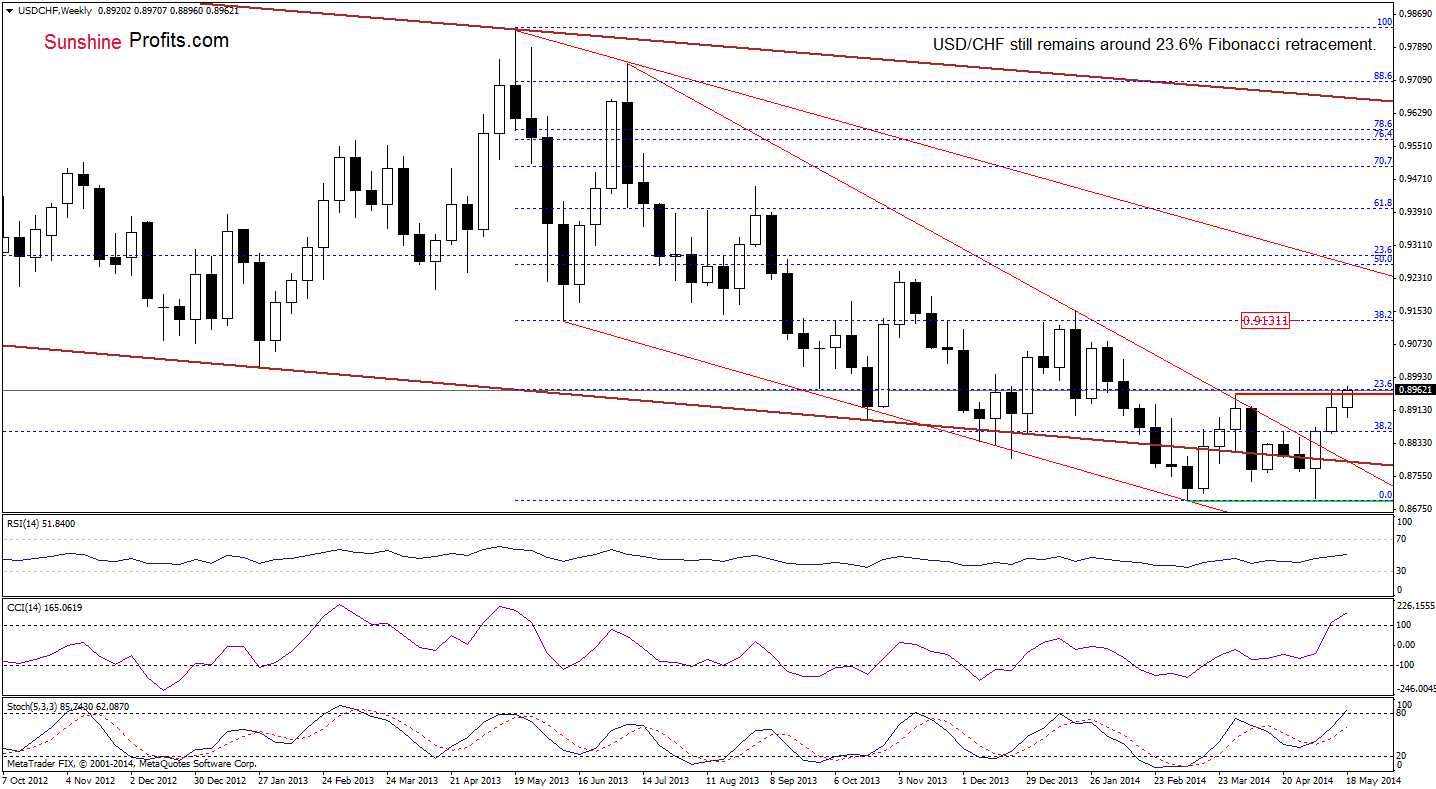
From the weekly perspective, we see that the overall situation in the madium term hasn’t changed much as USD/CHF is still trading around the 23.6% Fibonaci retracement. If the pair moves visibly higher (above the 23.6% Fiboncci retracement based on the entire May-March deline), we may see further improvement and an increase to around 0.9131, where the 38.2% Fibonacci retracement is. However, if this area encourages forex traders to push the sell button, we will see a pullback and the initial downside target will be this week’s low of 0.8896.
What is the short-term picture? Let’s check.
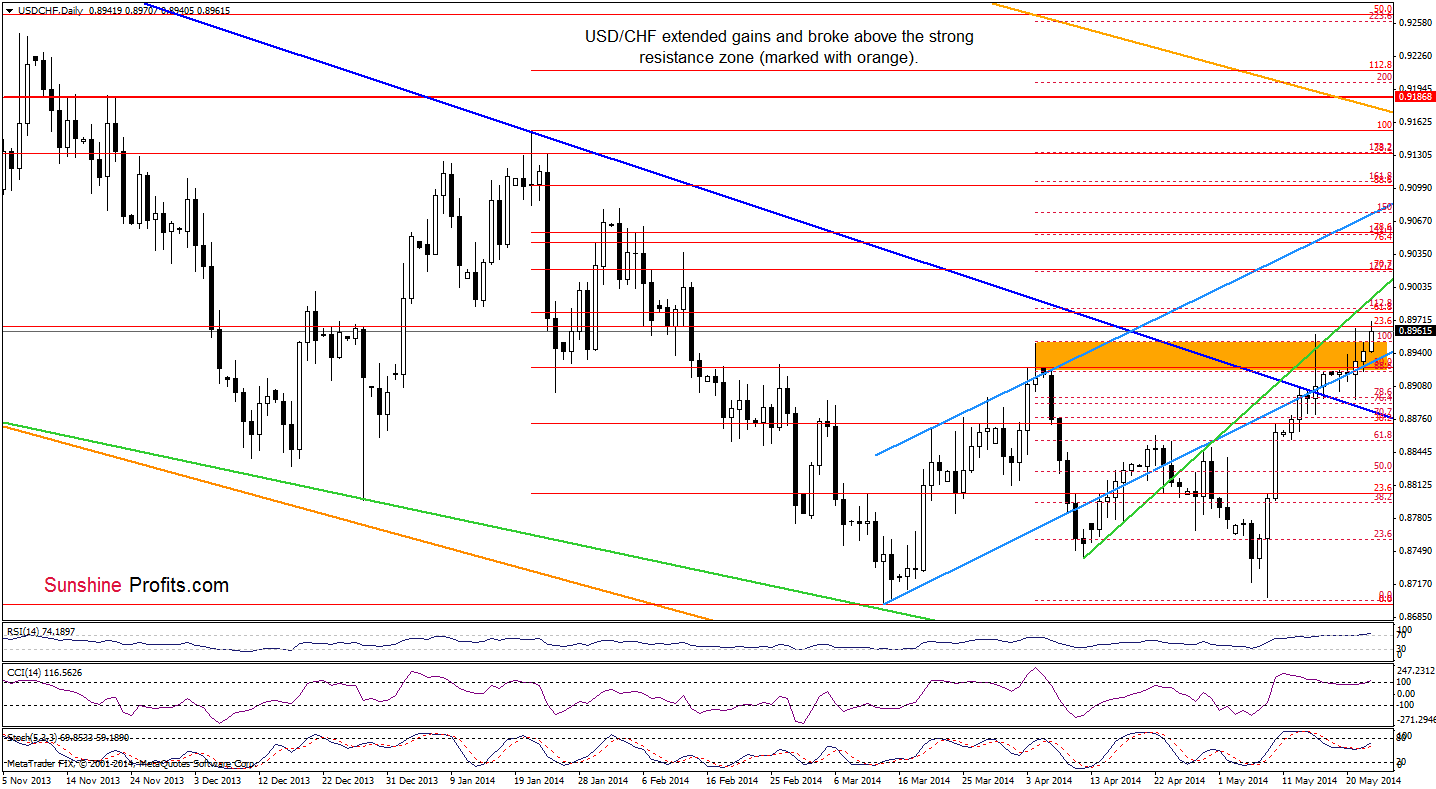
From this perspective, we see that although the situation has improved as USD/CHF broke above the resistance zone (marked with orange), the current position of the indicators suggests that a pause or correction is just around the corner. Please keep in mind that there are clearly visible negative divergences between the CCI, Stochastic Oscillator and the exchange rate. Additionally, the RSI climbed above the level of 70, which prescribes caution.
Very short-term outlook: mixed
Short-term outlook: mixed
MT outlook: mixed with bullish bias
LT outlook: bearish
Trading position (short-term): In our opinion no positions are justified from the risk/reward perspective. We will keep you informed should anything change, or should we see a confirmation/invalidation of the above.
AUD/USD
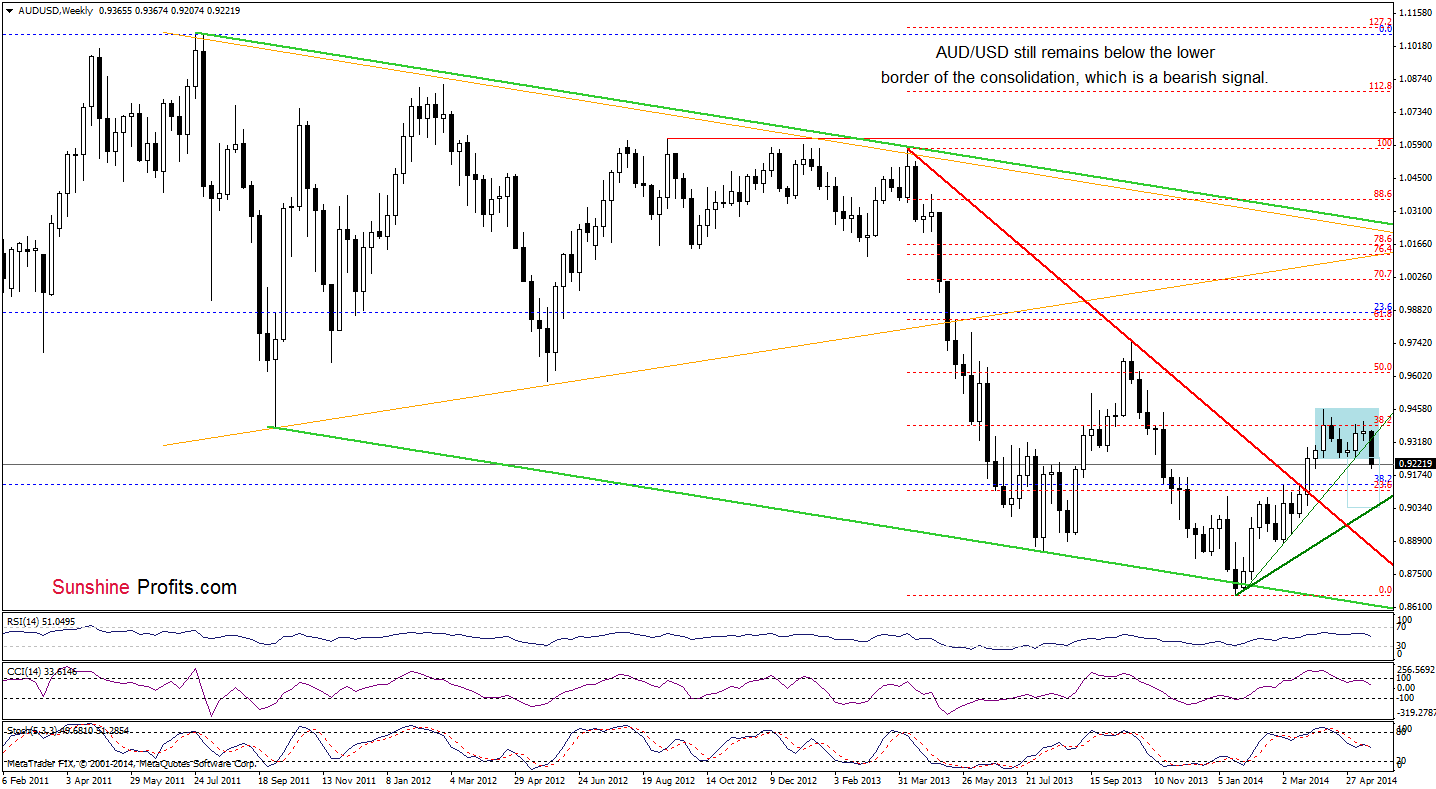
As you see on the weekly chart, the medium-term situation has deteriorated as AUD/USD extended declines below the lower border of the consolidation range. Taking this fact into account, we remain convinced that what we wrote on Tuesday is up-to-date:
(…) If the exchange range extends declines and drops below this line (at 0.9253), we will see further deterioration and the downside target will be the medium-term bold green line (currently around 0.9036). In our opinion, this scenario is more likely than not as sell signals generated by the indicators remain in place, supporting the bearish case.
Let’s check the short-term picture.
Yesterday, we wrote the following:
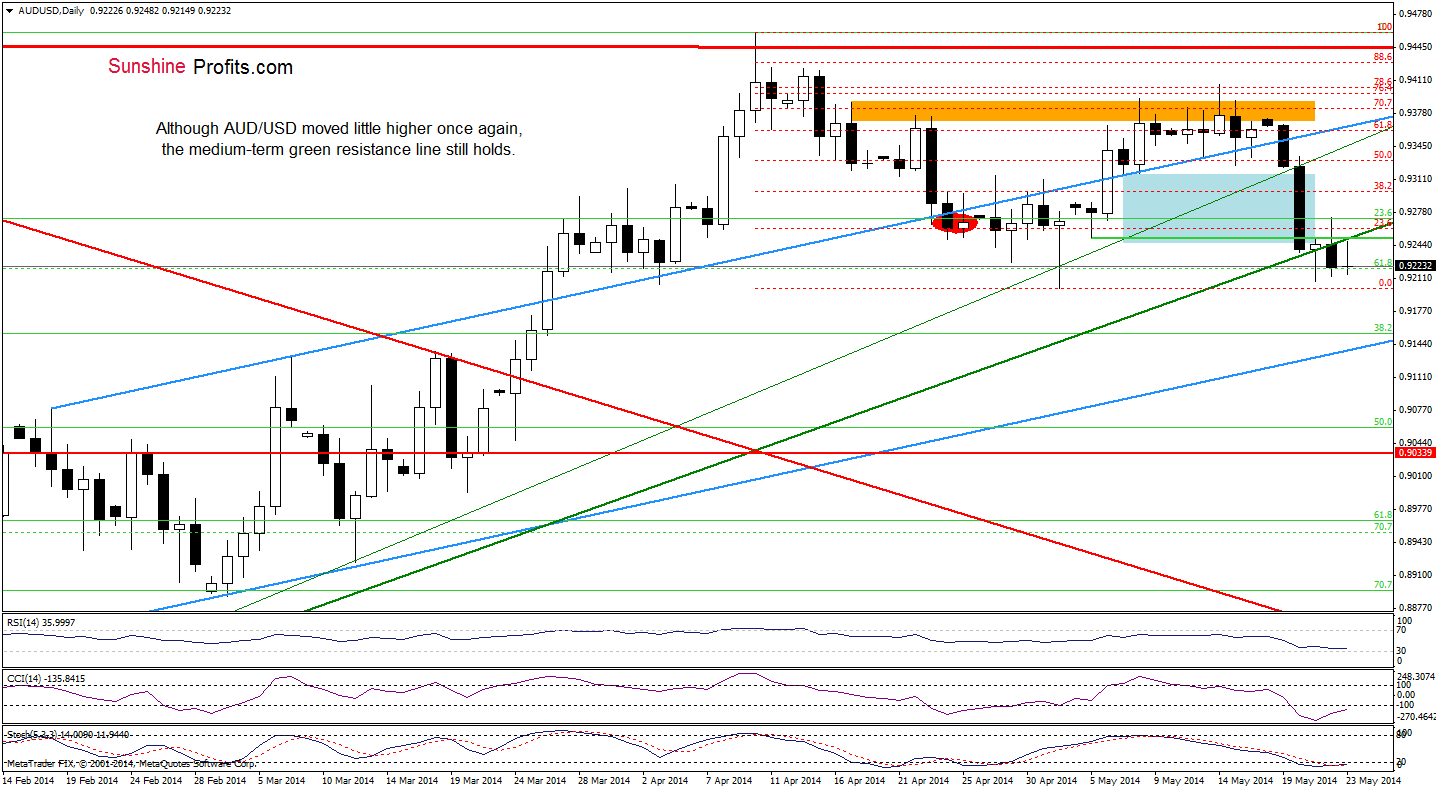
(…) the support level (…) triggered a corrective upswing above the previously-broken medium-term rising resistance line. Despite this improvement, AUD/USD didn’t hold gained levels and reversed, declining below the green line once again. This show of weakness provides us with bearish implications and suggests that today’s upswing was nothing more than a verification of the breakdown. If this is the case, we’ll see another attempt to move lower and the initial downside target will be the May low. If this support level doesn’t stop the current correction, we will likely see a drop to the 38.2% Fibonacci retracement based on the entire Jan.-Apr. rally (around 0.9154).
Looking at the daily chart, we see that although AUD/USD moved higher earlier today, the medium-term green resistance line stopped further improvement and the pair reversed. Was this upswing another verification of the breakdown? In our opinion the answer is: yes. Therefore, we think that we'll witness the above-mentioned bearish scenario in the coming days.
Very short-term outlook: bearish
Short-term outlook: bearish
MT outlook: bearish
LT outlook: bearish
Trading position (short-term): Short (the area where it was opened we marked with a red ellipse). Stop-loss order: 0.9410. We will keep you informed should anything change, or should we see a confirmation/invalidation of the above.
Thank you.
Nadia Simmons
Forex & Oil Trading Strategist
Przemyslaw Radomski, CFA
Founder, Editor-in-chief
Gold & Silver Trading Alerts
Forex Trading Alerts
Oil Investment Updates
Oil Trading Alerts

