
Earlier today, the Institute of Supply Management showed that its non-manufacturing purchasing managers' index climbed to a 5-month high of 55.2 in the previous month, beating expectations for an increase to 54.1. As it turned out, this strong U.S. service sector data did little to weaken the common currency. Basically, today’s session in the EUR/USD exchange rate can be described as “flat”. This doesn’t mean that the next big move is not on the horizon – the opposite seems to be the case.
In our opinion the following forex trading positions are justified - summary:
- EUR/USD: none
- GBP/USD: none
- USD/JPY: none
- USD/CAD: none
- USD/CHF: none
- AUD/USD: short (stop-loss order: 0.9410; initial price target: 0.9060)
EUR/USD
Quoting our last Forex Trading Alert:
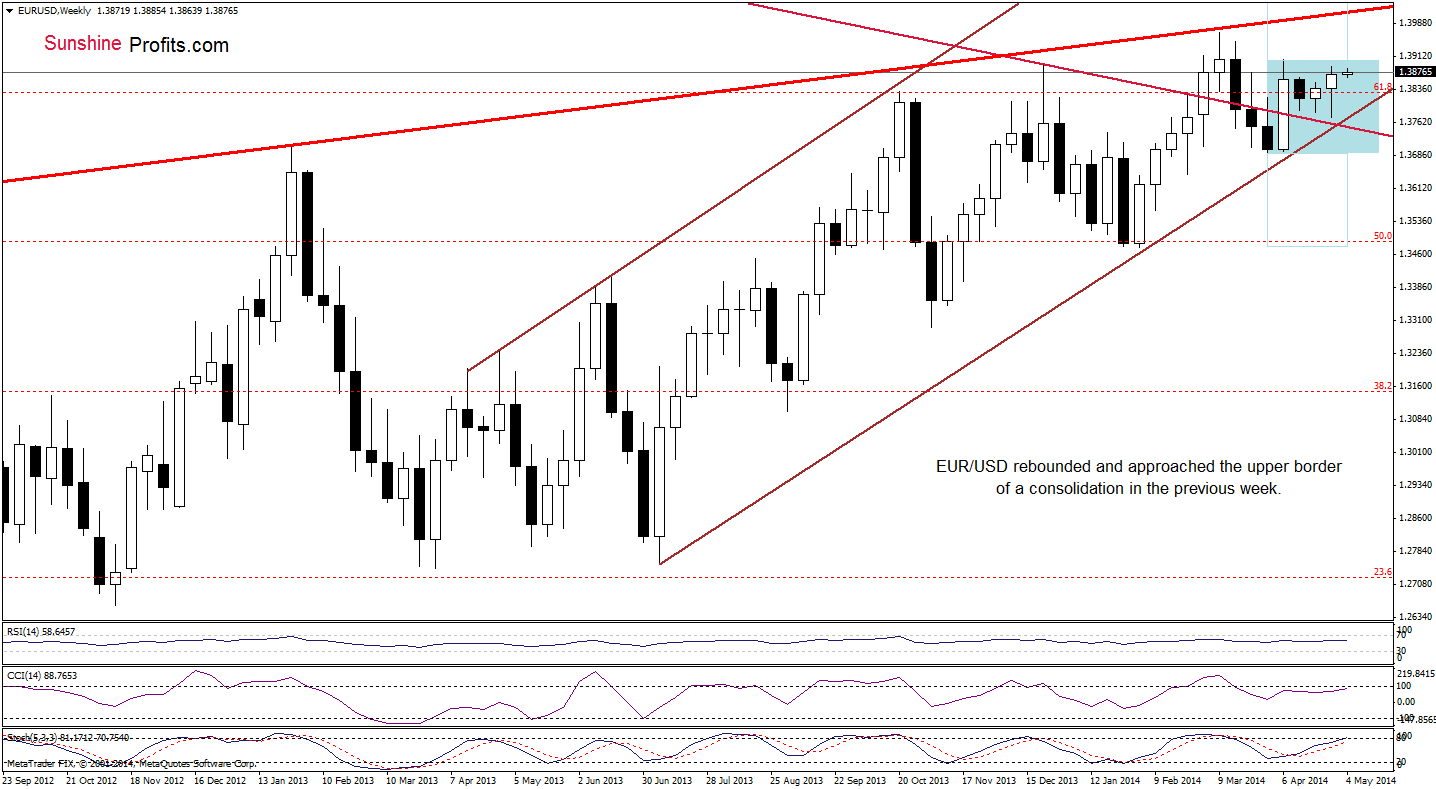
(…) EUR/USD gave up earlier gains and declined below the previous week low. Although this is a bearish signal, the exchange rate approached the long-term declining line (currently around 1.3760), which still serves as strong support. Taking this fact into account, another attempt to move higher should not surprise us.
As you see on the above chart, the exchange rate rebounded and approached the upper line of the consolidation (marked with light blue) in the previous week. If it holds, we will likely see a correction in the coming days and the downside target will be the lower border of the rising trend channel (currently around 1.3770). However, if EUR/USD breaks above this resistance line, we may see an increase to around 1.3947 or even to the March high of 1.3966.
Once we know the above, let’s take a look at the daily chart.
In our previous Forex Trading Alert, we wrote the following:
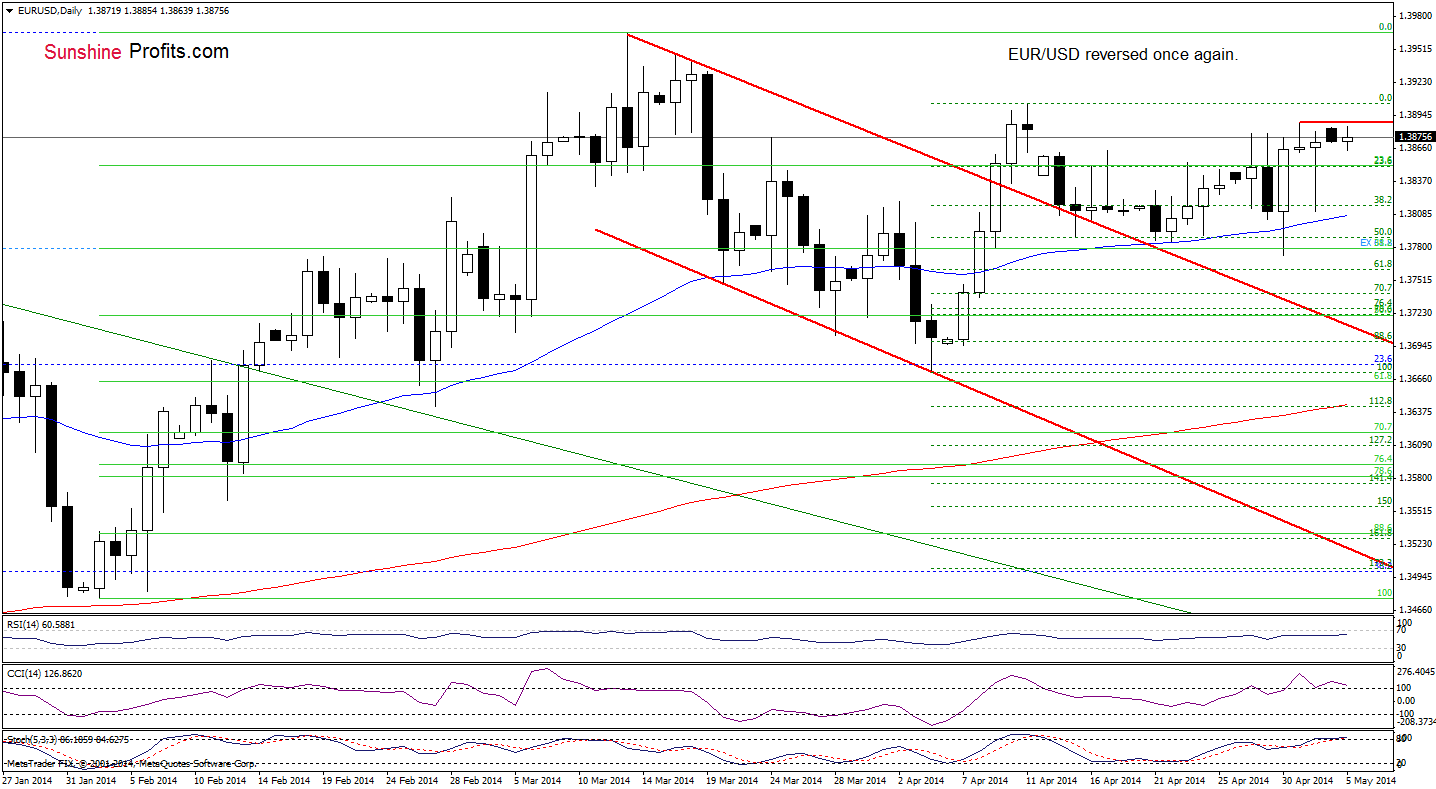
(…) EUR/USD approached the 50-day moving average (…) once again. When we take a closer look at the daily chart, we see that this support successfully stopped pullbacks in the recent days. Since Apr.22 every attempt to move lower failed and the pair rebounded. Therefore, if history repeats itself once again, we may see a corrective upswing in the near future and the upside target will be yesterday’s high.
On Friday, we noticed such price action as the exchange rate approached Thursday high. Earlier today, the pair extended gains and remains (at the moment when these words are written) slightly below the resistance level. If it is broken, we will likely see an upward move to the April high of 1.3905. However, if it holds, we may see another pullback and the downside target will be the 50-day moving average (currently at 1.3808). At this point, it’s worth noting that the CCI and Stochastic Oscillator are overbought and close to generating sell signals (additionally, there is a small negative divergence between the CCI and the exchange rate), which suggests that the latter scenario is more likely in the coming days.
Please note that if EUR/USD closes the day below the 50-day moving average (in the coming week), declines will likely accelerate and the initial downside target will be the 61.8% Fibonacci retracement (based on the April rally) around 1.3760 (in this area is also the long-term declining line marked on the weekly chart.
Very short-term outlook: mixed with bearish
Short-term outlook: mixed with bearish bias
MT outlook: bearish
LT outlook: bearish
Trading position: In our opinion no positions are justified from the risk/reward perspective. We will keep you informed should anything change, or should we see a confirmation/invalidation of the above.
AUD/USD
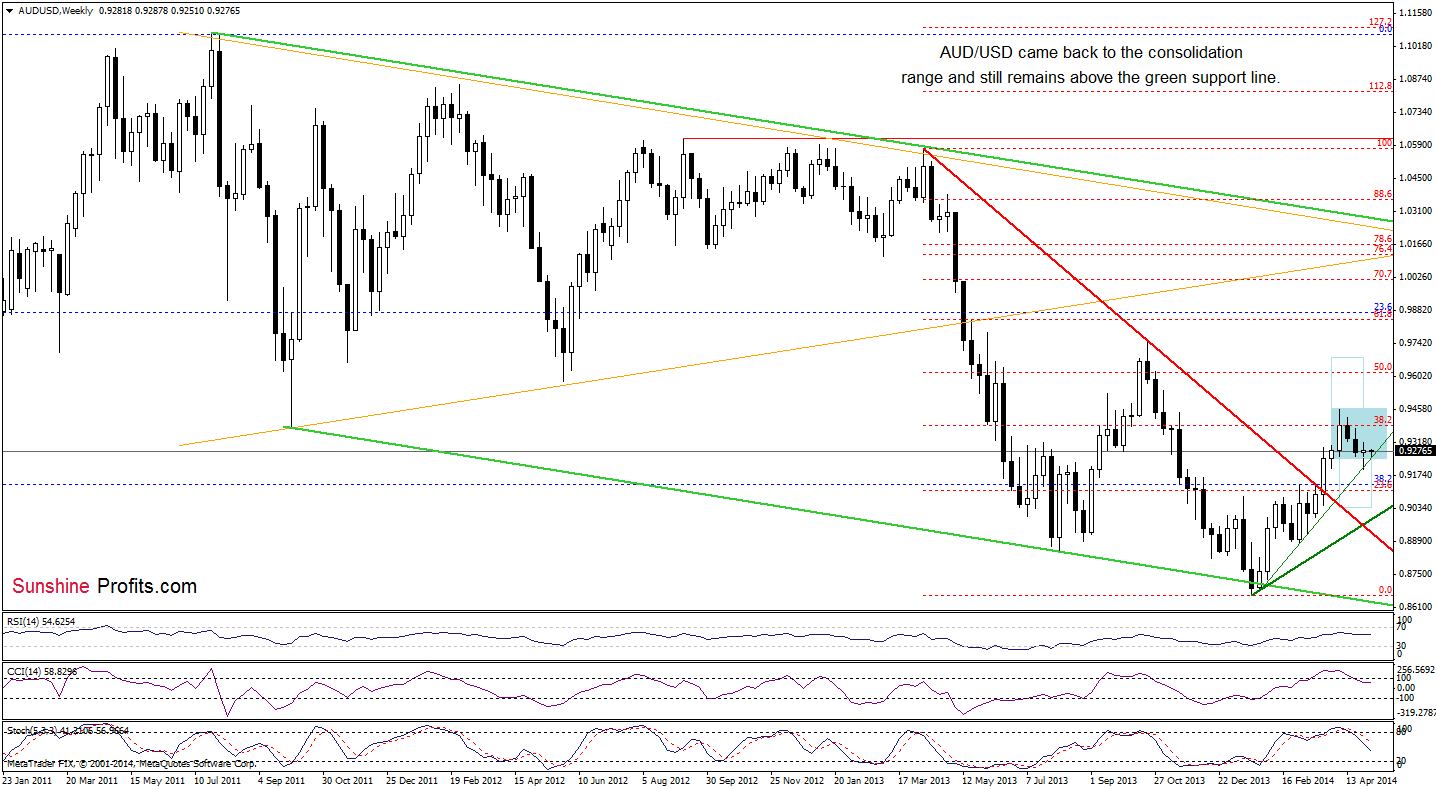
On the weekly chart, we see that AUD/USD bounced off the upper green line and came back above the lower border of the consolidation range. Although this is a bullish sign, the exchange reversed and slipped to this important support once again. Taking this fact into account and combining it with sell signals generated by the CCI and Stochastic Oscillator, we think that another attempt to move lower can’t be ruled. In our opinion, if the pair breaks below the upper green line (around 0.9247), the current decline will likely accelerate and we may see a drop to around 0.9046. Please note that at this level the size of the downswing corresponds to the height of the consolidation range.
Once we know the medium-term situation, let’s move on to the daily chart.
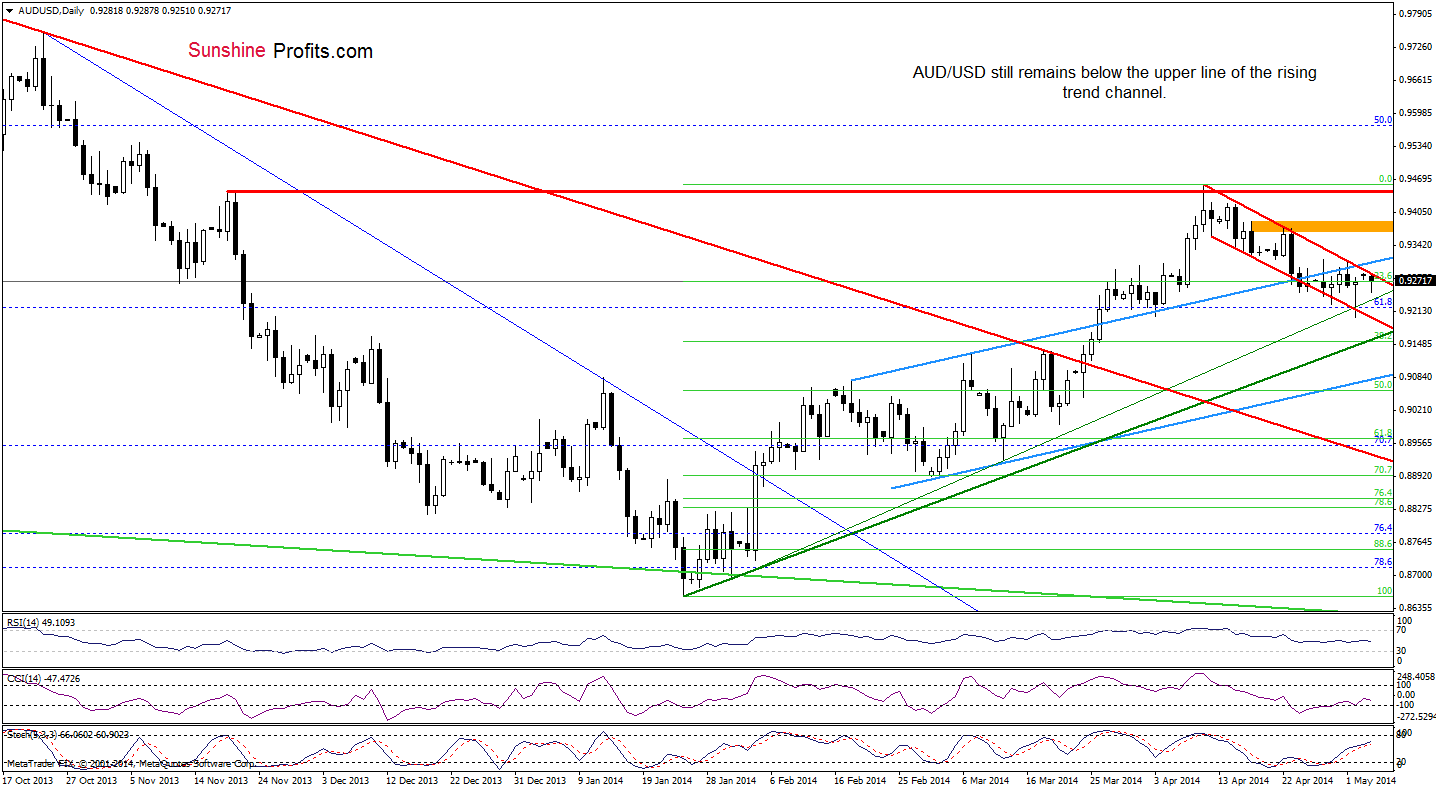
Looking at the daily chart, we see that the situation hasn’t changed much. Although AUD/USD moved higher earlier today, the pair still remains below two important resistance lines: the upper line of the rising trend channel and the declining red line based on the Apr.10 and Apr.22 highs (which successfully stopped further improvement in the previous week). Therefore, what we wrote on Friday, is up-to-date:
(…) as long as there won’t be a confirmed breakout above these resistance lines, further deterioration is still in play. In this case, if the pair drops below the green rising support line (based on the Jan.31 and March 12 lows), we’ll likely see another move lower and a drop to around 0.9154, where the lower green support line (created by the 2014 and Jan.31 lows) intersects the 38.2% Fibonacci retracement based on the entire Jan.-Apr. rally.
Very short-term outlook: bearish
Short-term outlook: bearish
MT outlook: bearish
LT outlook: bearish
Trading position (short-term): Short. Stop-loss order: 0.9410 and initial price target: the lower border of the blue rising trend channel (currently at 0.9060). We will keep you informed should anything change, or should we see a confirmation/invalidation of the above.
Thank you.
Nadia Simmons
Forex & Oil Trading Strategist
Przemyslaw Radomski, CFA
Founder, Editor-in-chief
Gold & Silver Trading Alerts
Forex Trading Alerts
Oil Investment Updates
Oil Trading Alerts

