
Earlier today, the U.S. dollar moved higher against the common currency after strong U.S. employment data. The Labor Department showed that the U.S. economy added 288,000 jobs in the previous month, well above expectations for a 210,000 increase. The report also showed that the U.S. unemployment rate dropped to 6.3% in April, while analysts had expected a fall to 6.6%. In reaction to these better-than-expected numbers, the euro declined sharply, approaching its important support. Will history repeat itself once again?
In our opinion the following forex trading positions are justified - summary:
- EUR/USD: none
- GBP/USD: none
- USD/JPY: none
- USD/CAD: none
- USD/CHF: none
- AUD/USD: short (stop-loss order: 0.9410; initial price target: 0.9060)
EUR/USD
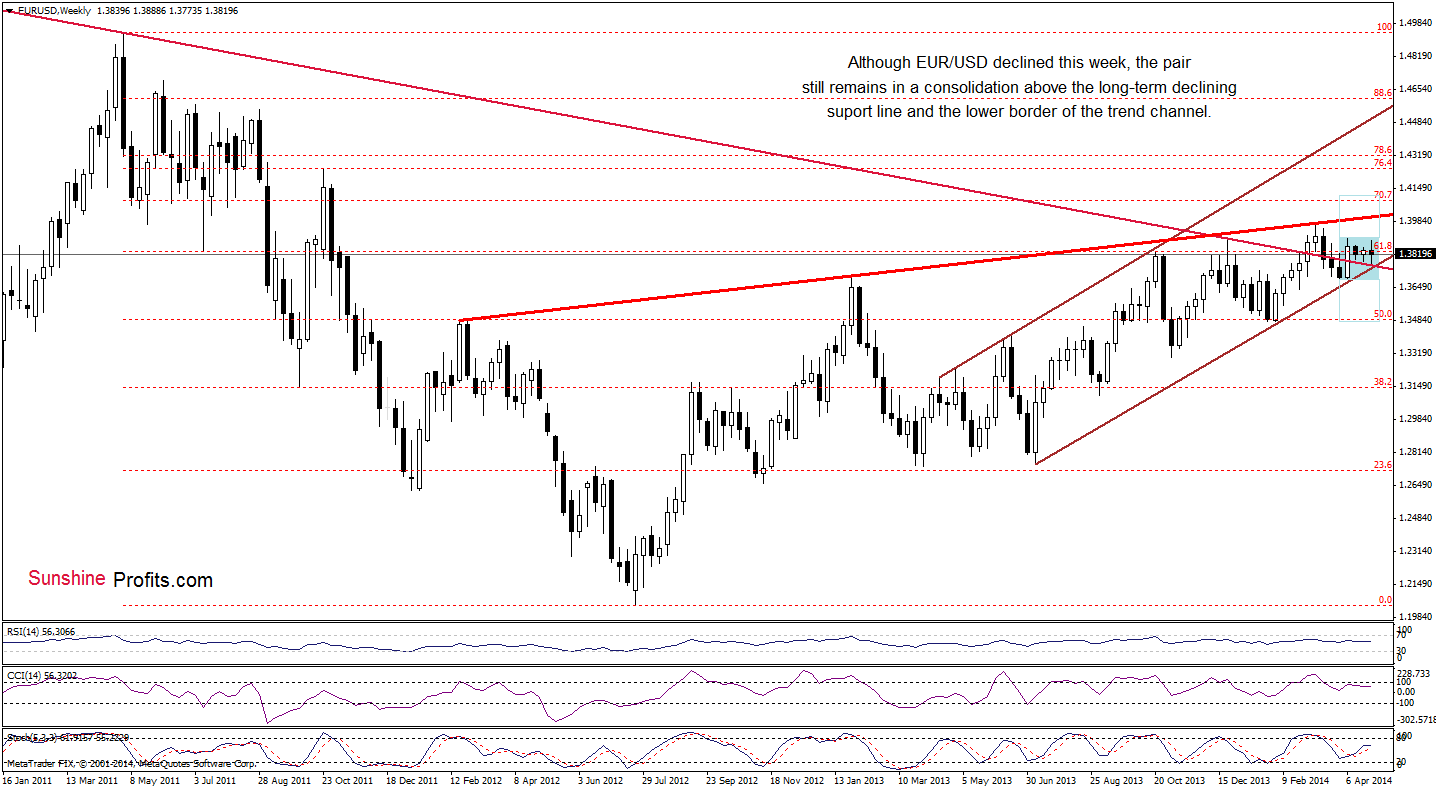
Looking at the weekly chart, we see that EUR/USD gave up earlier gains and declined below the previous week low. Although this is a bearish signal, the exchange rate approached the long-term declining line (currently around 1.3760), which still serves as strong support. Taking this fact into account, another attempt to move higher should not surprise us. Nevertheless, even if the pair rebounds, the upper line of the consolidation (marked with light blue) around 1.3905, will likely pause or stop further improvement.
Once we know the above, let’s take a look at the daily chart.
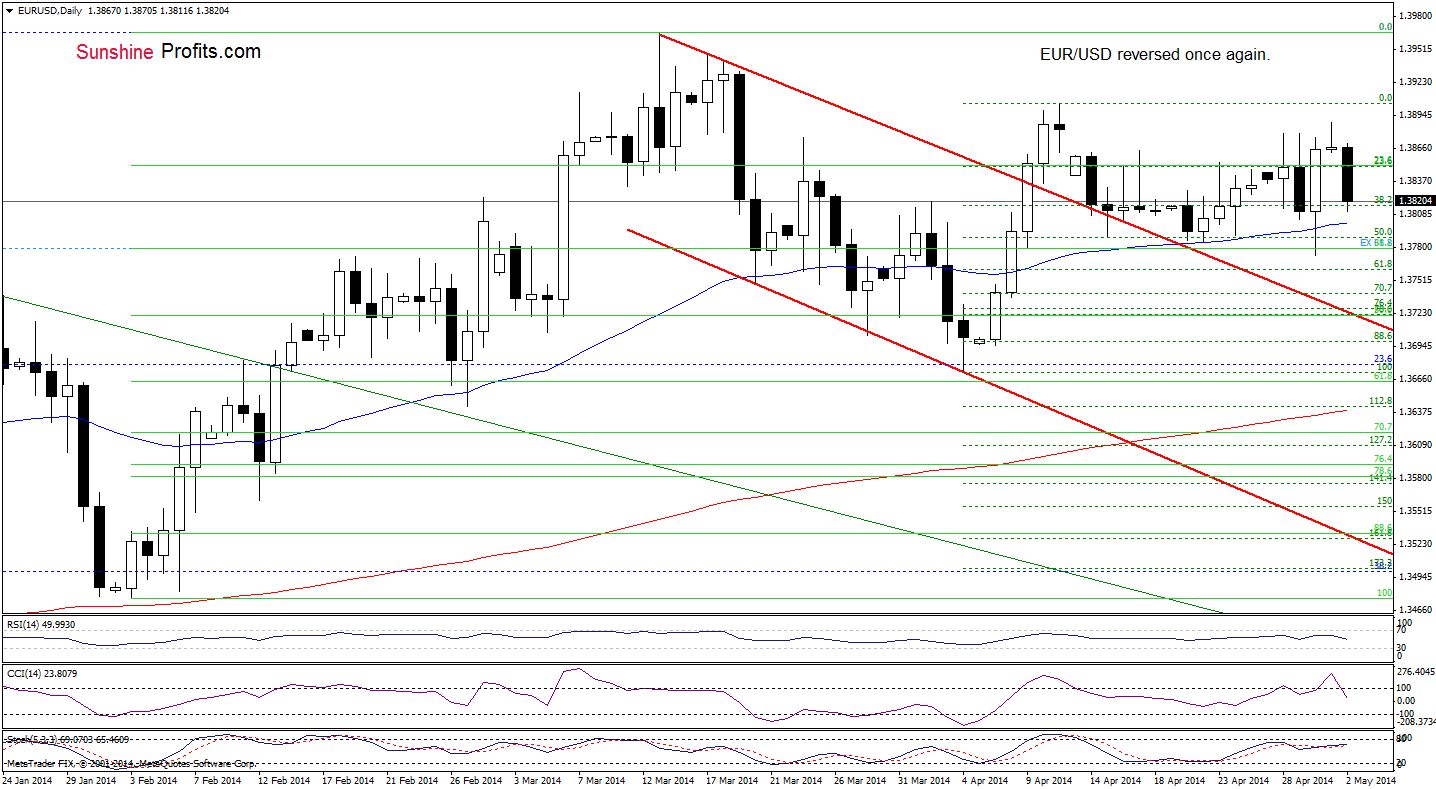
As you see on the above chart, although EUR/USD moved higher and broke above the recent highs yesterday, the pair reversed and invalidated the breakout earlier today. Similarly to what we saw in the previous days, this show of weakness triggered further deterioration and the exchange rate declined sharply in the following hours. With this downswing EUR/USD approached the 50-day moving average (currently around 1.3802) once again.
When we take a closer look at the daily chart, we see that this support successfully stopped pullbacks in the recent days. Since Apr.22 every attempt to move lower failed and the pair rebounded. Therefore, if history repeats itself once again, we may see a corrective upswing in the near future and the upside target will be yesterday’s high. Nevertheless, we should keep in mind that the CCI generated a sell signal, while the Stochastic Oscillator is close to doing it, which suggests that another attempt to move lower in the coming days should not surprise us.
Please note that if EUR/USD closes the day below the 50-day moving average (in the coming week), declines will likely accelerate and the initial downside target will be the 61.8% Fibonacci retracement (based on the April rally) around 1.3760 (in this area is also the long-term declining line marked on the weekly chart.
Very short-term outlook: mixed with bearish
Short-term outlook: mixed with bearish bias
MT outlook: bearish
LT outlook: bearish
Trading position: In our opinion no positions are justified from the risk/reward perspective. We will keep you informed should anything change, or should we see a confirmation/invalidation of the above.
AUD/USD
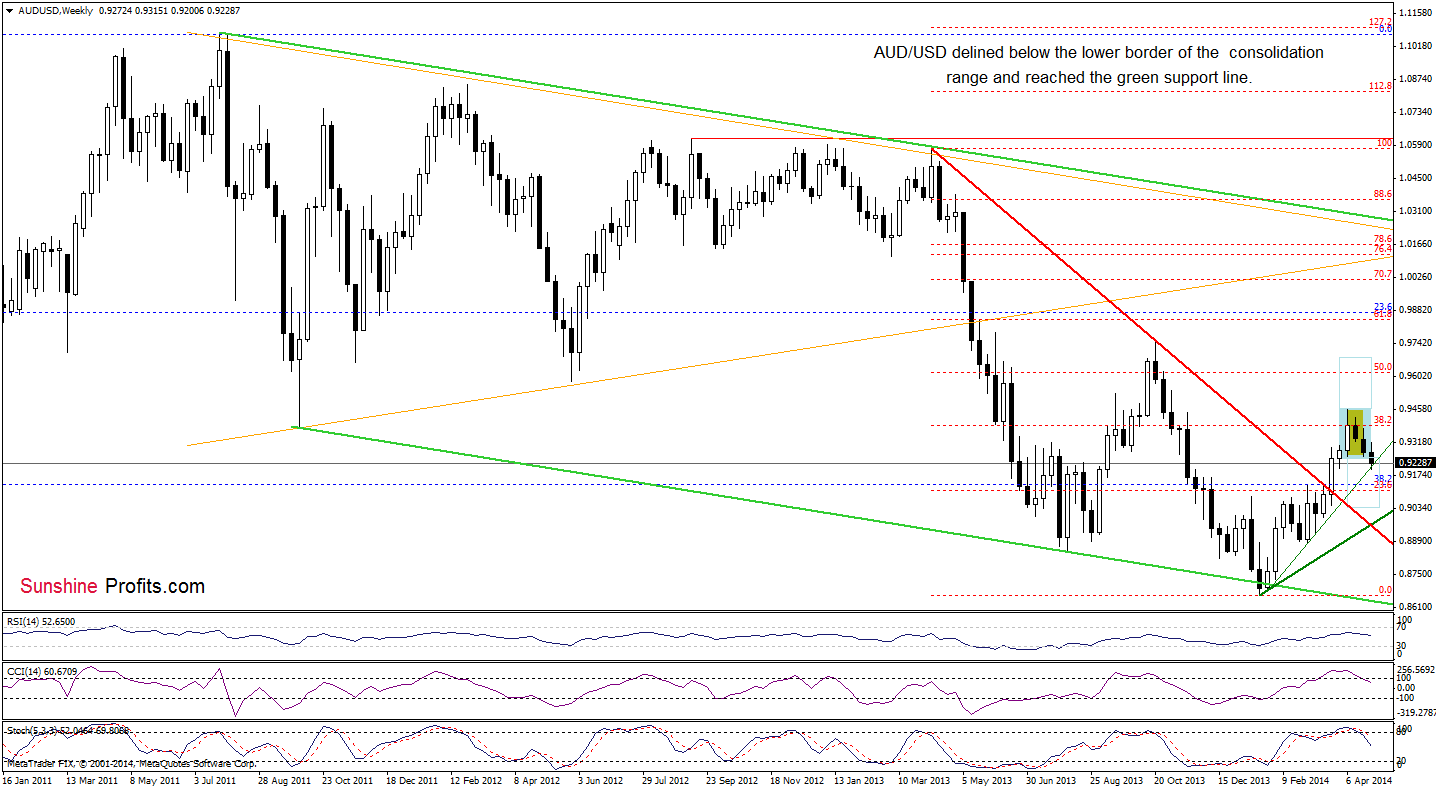
On the weekly chart, we see that AUD/USD dropped below the lower border of the consolidation range and slipped below (so far only temporarily) the upper green support line. Therefore, what we wrote in our previous Forex Trading Alert is up-to-date.
(…) From this perspective, it seems that the current decline will accelerate after a breakdown below the thin green support line based on the February and March lows (around 0.9211 at the moment). If this is the case, we may see further deterioration and a drop to around 0.9046 (at this level the size of the downswing corresponds to the height of the consolidation range). Please keep in mind that sell signals generated by the CCI and Stochastic Oscillator remain in place, supporting the bearish case.
Once we know the medium-term situation, let’s move on to the daily chart.
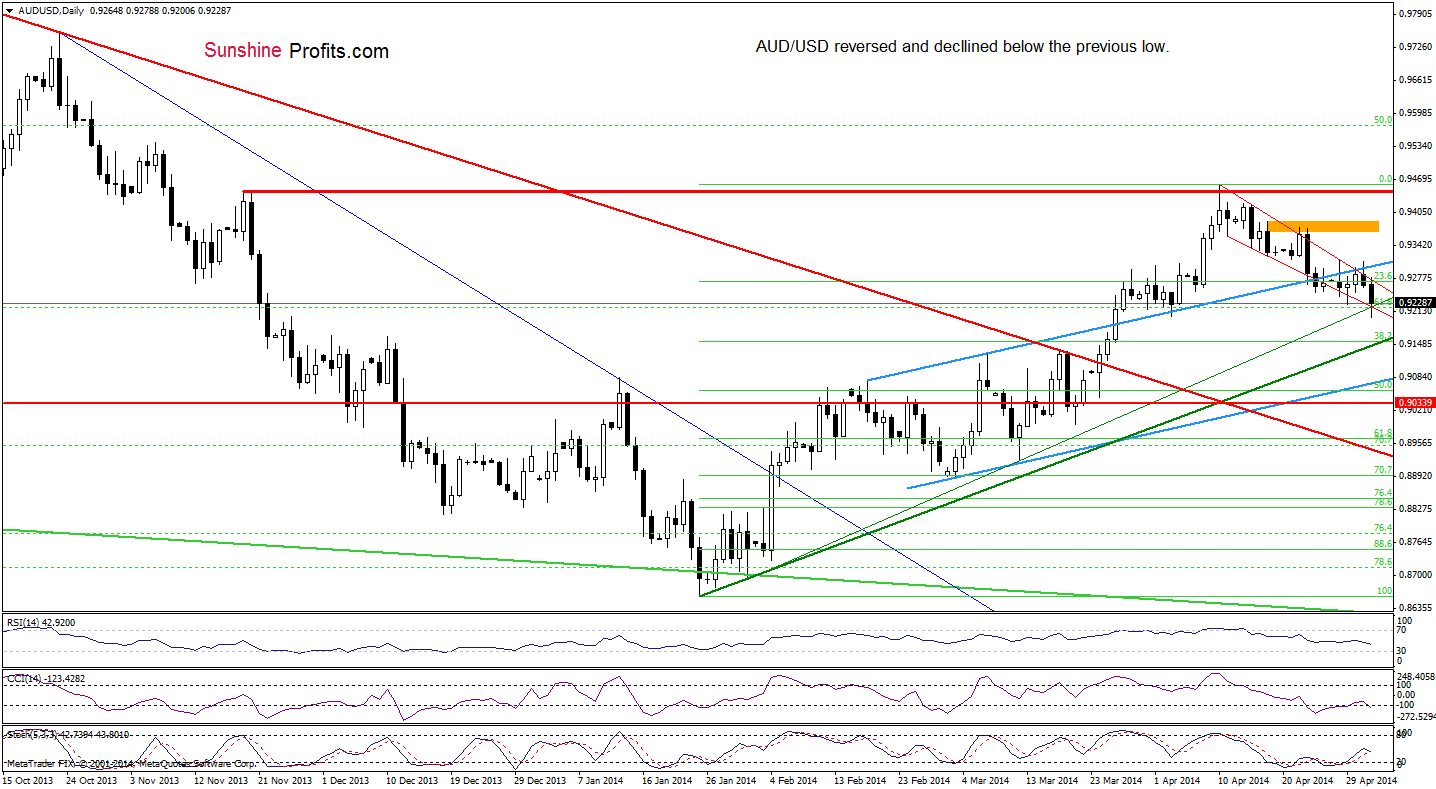
Quoting our last Forex Trading Alert:
(...) AUD/USD extended gains and reached a strong resistance zone created by the higher line of the declining trend channel (marked with red) and the upper border of the blue rising trend channel. If this area holds, we will likely see another attempt to move lower. In this case, the initial downside target will be around 0.9239, where the red lower line is. If this support is broken, the exchange rate may drop to the green rising support line based on the Jan.31 and March 12 lows (currently around 0.9209). At this point, it’s worth nothing that slightly below this level is the Apr.3 low, which reinforces this support area.
The first thing that catches the eye on the daily chart is a drop to the above-mentioned levels. Yesterday, the exchange rate reversed and declined below both resistance lines, invalidating earlier breakout, which was a strong bearish signal that triggered further deterioration earlier today. Although AUD/USD rebounded the support area, it still remains below the higher line of the declining trend channel and the upper border of the blue rising trend channel. In our opinion, as long as there won’t be a confirmed breakout above these resistance lines, further deterioration is still in play. In this case, if the pair drops below the green rising support line (based on the Jan.31 and March 12 lows), we’ll likely see another move lower and a drop to around 0.9154, where the lower green support line (created by the 2014 and Jan.31 lows) intersects the 38.2% Fibonacci retracement based on the entire Jan.-Apr. rally.
Very short-term outlook: bearish
Short-term outlook: bearish
MT outlook: bearish
LT outlook: bearish
Trading position (short-term): Short. Stop-loss order: 0.9410 and initial price target: the lower border of the blue rising trend channel (currently at 0.9060). We will keep you informed should anything change, or should we see a confirmation/invalidation of the above.
Finishing today‘s Forex Trading Alert we would like to let you know that, based on the feedback that we received from you (thank you!), we will adjust our way of providing forex analysis once again. Each day, we’ll be providing the analysis of the currency pairs that are the pair that we have an open position in and those that are particularly interesting on a given day (because they reach an important support/ resistance or we are very likely to open a position in them shortly). Additionally, we’ll post a complete overview (all six major currency pairs) once a week. We'll start next Friday and we'll keep the current system until that day.
Thank you.
Nadia Simmons
Forex & Oil Trading Strategist
Przemyslaw Radomski, CFA
Founder, Editor-in-chief
Gold & Silver Trading Alerts
Forex Trading Alerts
Oil Investment Updates
Oil Trading Alerts

