
Similarly to what we saw yesterday, the greenback declined against major currencies as it remained under pressure ahead of tomorrow Federal Reserve minutes. Thanks to this drop, the Australian dollar broke above the previous 2014 high. Will this breakout be confirmed? Will AUD/USD rally much further? If you want to know our take on these questions, we invite you to read our today's Forex Trading Alert.
In our opinion the following forex trading positions are justified - summary:
EUR/USD
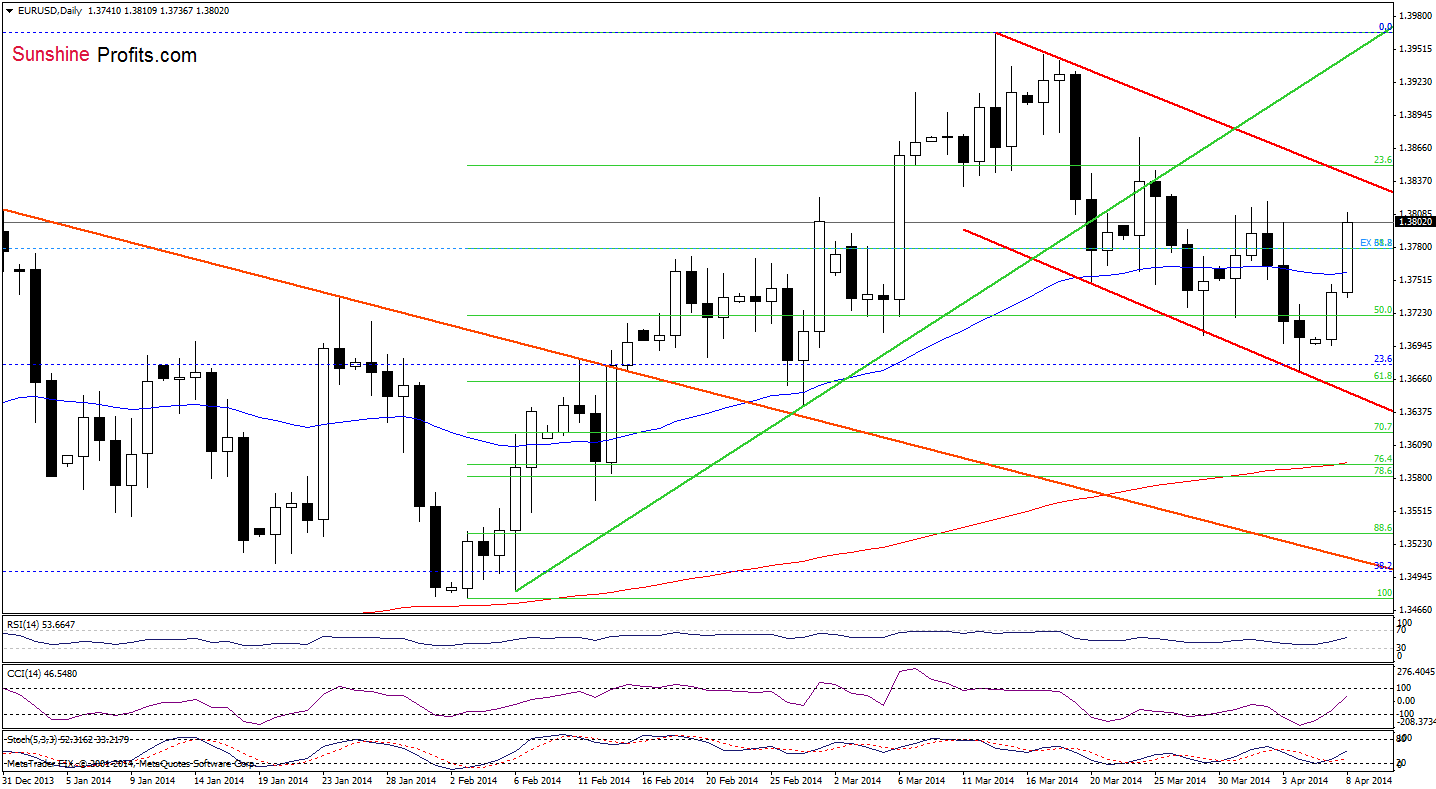
Earlier today, EUR/USD extended gains and broke above the 50-day moving average, reaching a resistance zone created by the April’s highs. If it holds, we may see a pullback to the 50-day moving average. However, taking into account the current position of the indicators (buy signals remain in place), it seems that we may see further improvement in the coming day (or days). If this is the case, the next upside target for the buyers will be the upper line of the declining trend channel (currently around 1.3843).
Before we summarize this currency pair, let’s take a look at the 4-hour chart.
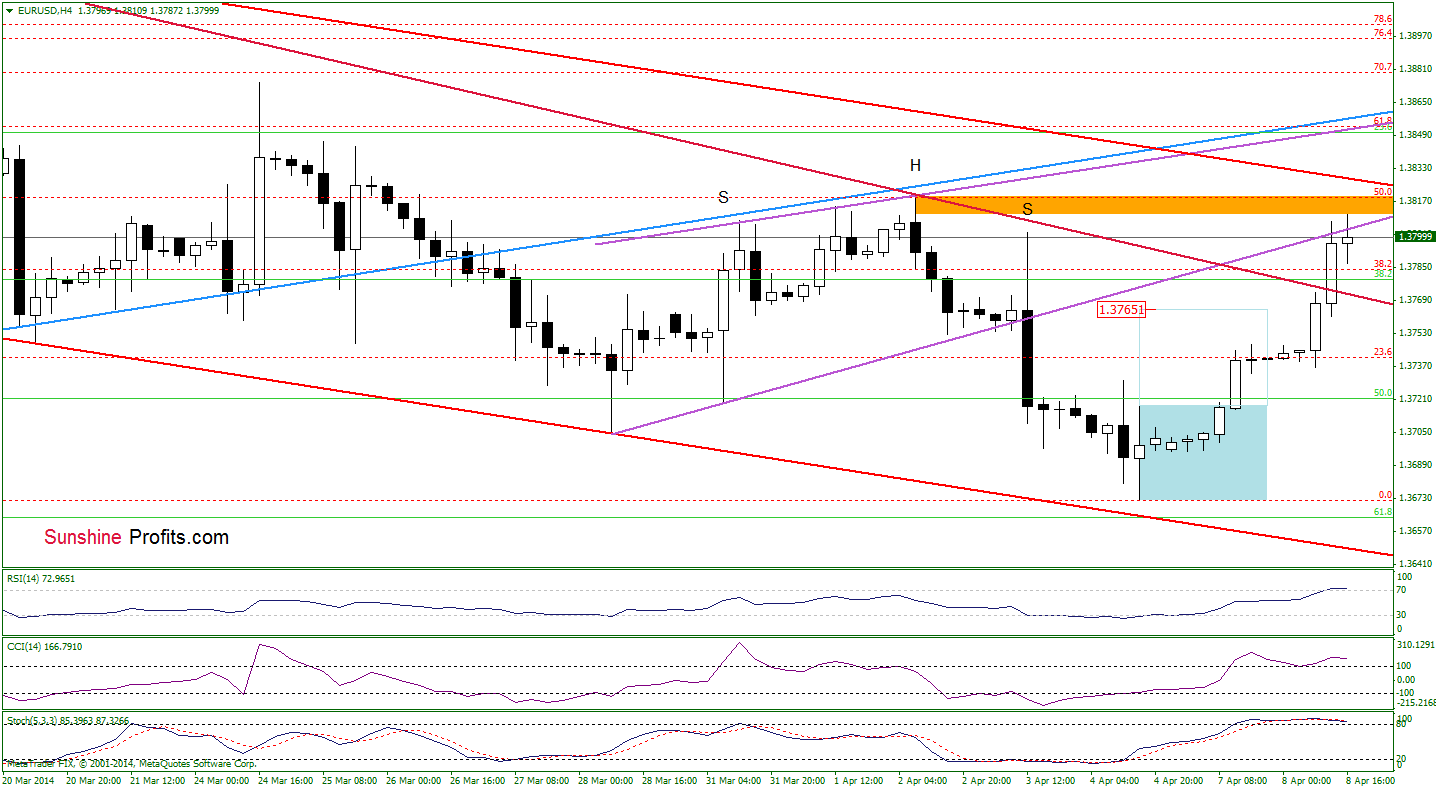
From this perspective, we see that the buyers pushed EUR/USD higher and not only reached the upside target around 1.3765 (after a breakout above the upper line of a consolidation), but also broke above the declining resistance line based on March 18 and April 2 highs. Although this is a bullish sign, the exchange rate climbed to a resistance zone created by the previously-broken resistance line (market with purple), the 50% Fibonacci retracement (based on the entire March-April decline) and the April 2 high. Additionally slightly above this area is the red declining line, which is also the upper line of the declining trend channel. Taking all the above into account and combining it with the current position of the indicators, it seems that a pause (or a correction) is just around the corner.
Very short-term outlook: mixed
Short-term outlook: mixed
MT outlook: mixed
LT outlook: bearish
Trading position: In our opinion no positions are justified from the risk/reward perspective. We will keep you informed should anything change, or should we see a confirmation/invalidation of the above.
GBP/USD
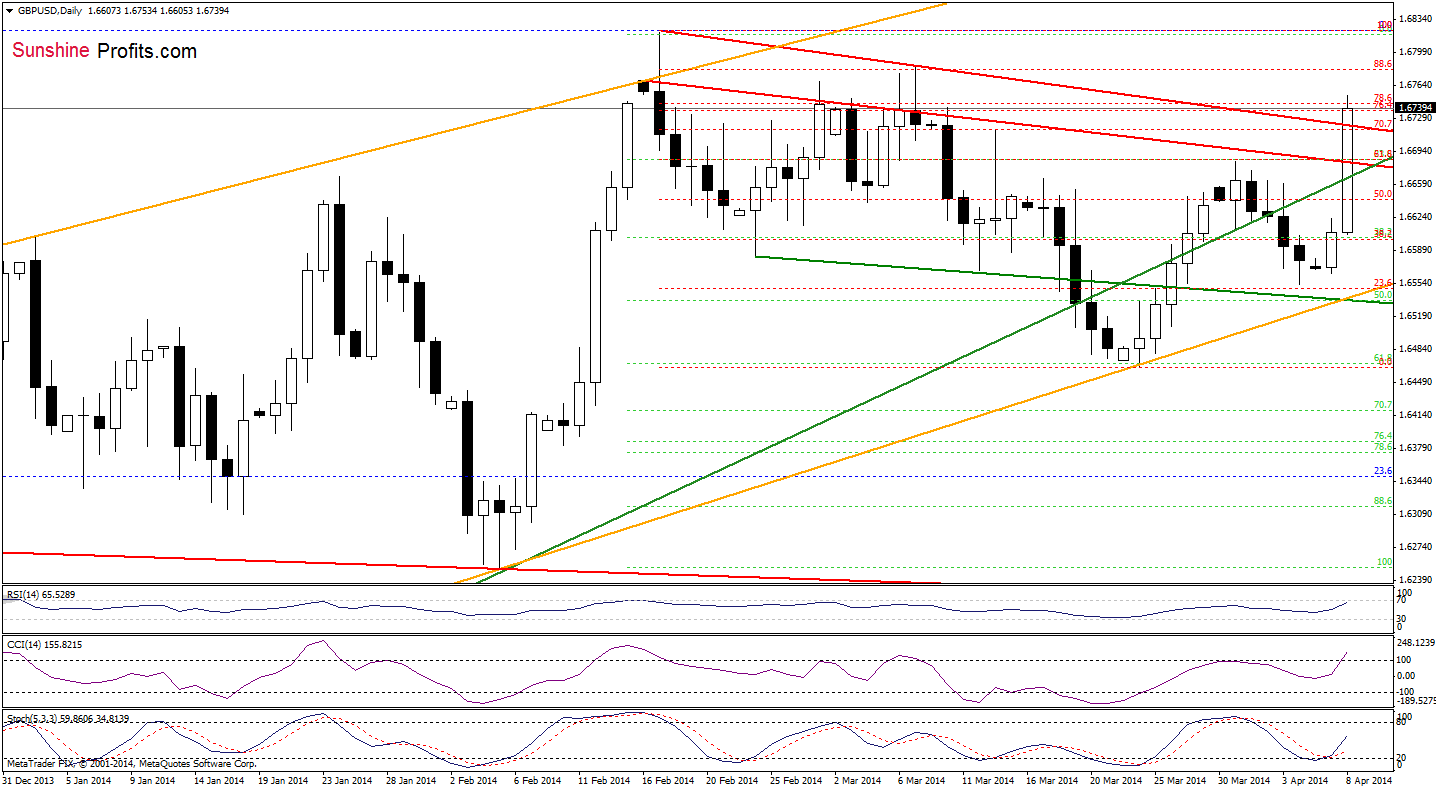
On the daily chart, we see that the situation has improved significantly as GBP/USD climbed above the previously-broken medium-term support/resistance green line and both red declining resistance lines. This is a bullish signal, which suggests further improvement. Nevertheless, we should keep in mind that the exchange rate reached a resistance zone created by the 76.4% and 78.6% Fibonacci retracements (based on the recent entire decline). If it is broken, we will likely see an increase to around 1.6784, where the March 7 high is.
Very short-term outlook: bullish
Short-term outlook: mixed
MT outlook: mixed
LT outlook: mixed
Trading position (short-term): In our opinion no positions are justified from the risk/reward perspective at the moment. We will keep you informed should anything change, or should we see a confirmation/invalidation of the above.
USD/JPY
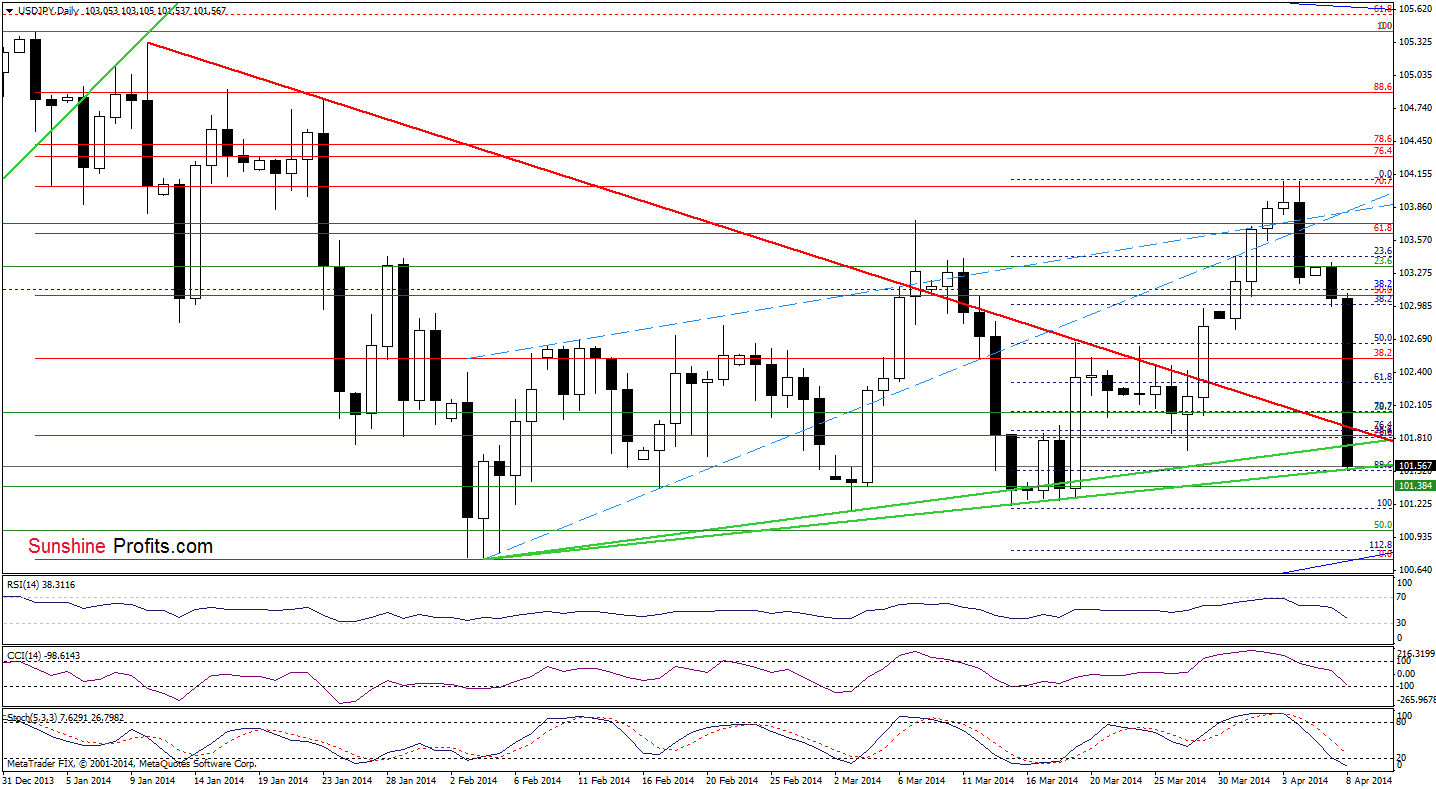
On the daily chart, we see that USD/JPY extended declines and reached the lower green support line. If it encourages buyers to act, we may see a corrective upswing to the red declining line. However, if this support is broken, we will likely see a drop to the March 14 low or even to the February low. Please note that sell signals remain in place, supporting sellers.
Very short-term outlook: bearish
Short-term outlook: mixed with bearish bias
MT outlook: bullish
LT outlook: bearish
Trading position (short-term): In our opinion no positions are justified from the risk/reward perspective at the moment. We will keep you informed should anything change, or should we see a confirmation/invalidation of the above.
USD/CAD
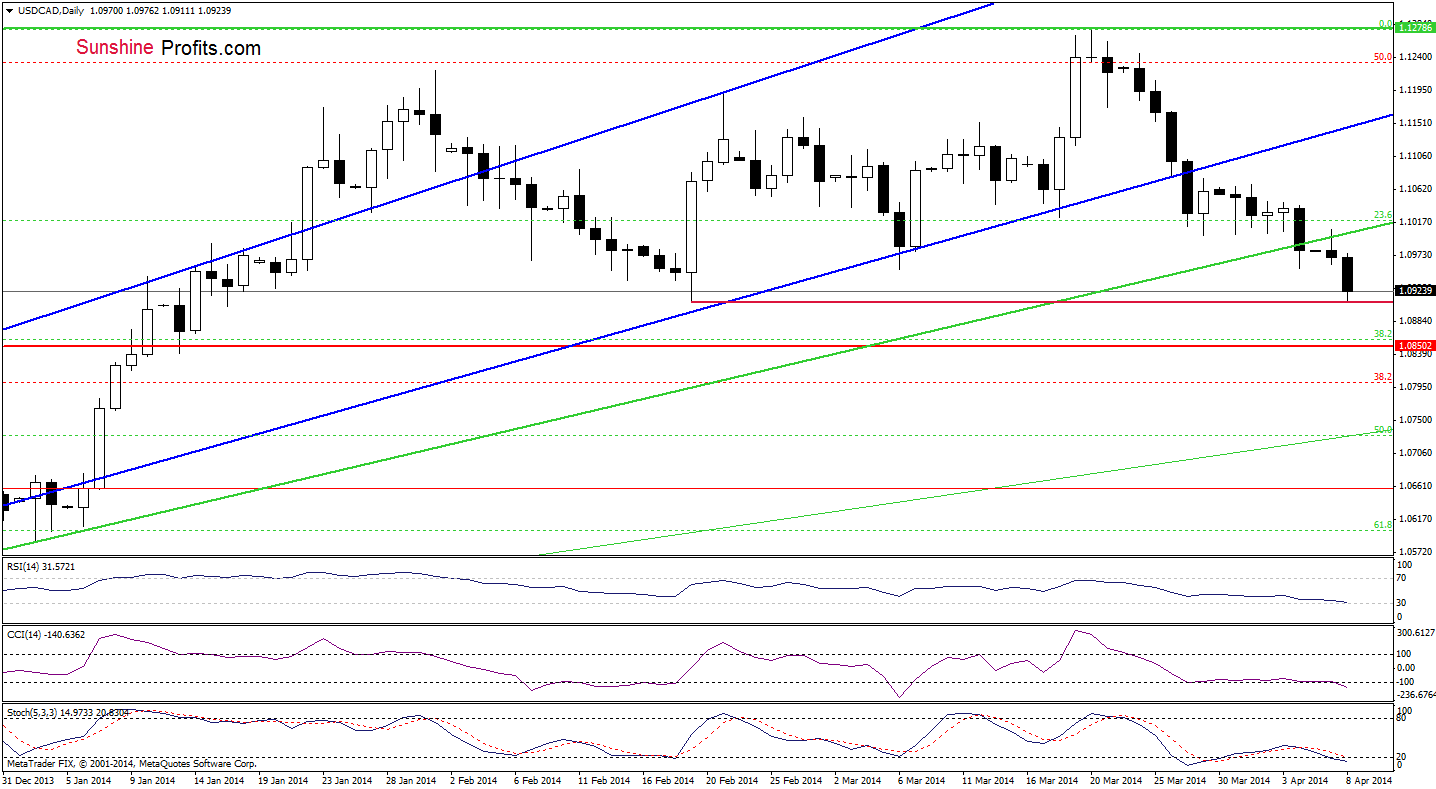
On the above chart, we see that USD/CAD broke below the March 6 bottom, which triggered further deterioration. With this downswing, the exchange rate reached its first downside target - the Feb.19 low (1.0909). If it holds, we may see a corrective upswing to the previously-broken medium-term green resistance line. However, if it is broken, the next target for the sellers will be the horizontal red support line created by the May 2010 high (around 1,0850).
Very short-term outlook: bearish
Short-term outlook: mixed with bearish bias
MT outlook: bullish
LT outlook: bearish
Trading position (short-term): In our opinion no positions are justified from the risk/reward perspective. We will keep you informed should anything change, or should we see a confirmation/invalidation of the above.
USD/CHF
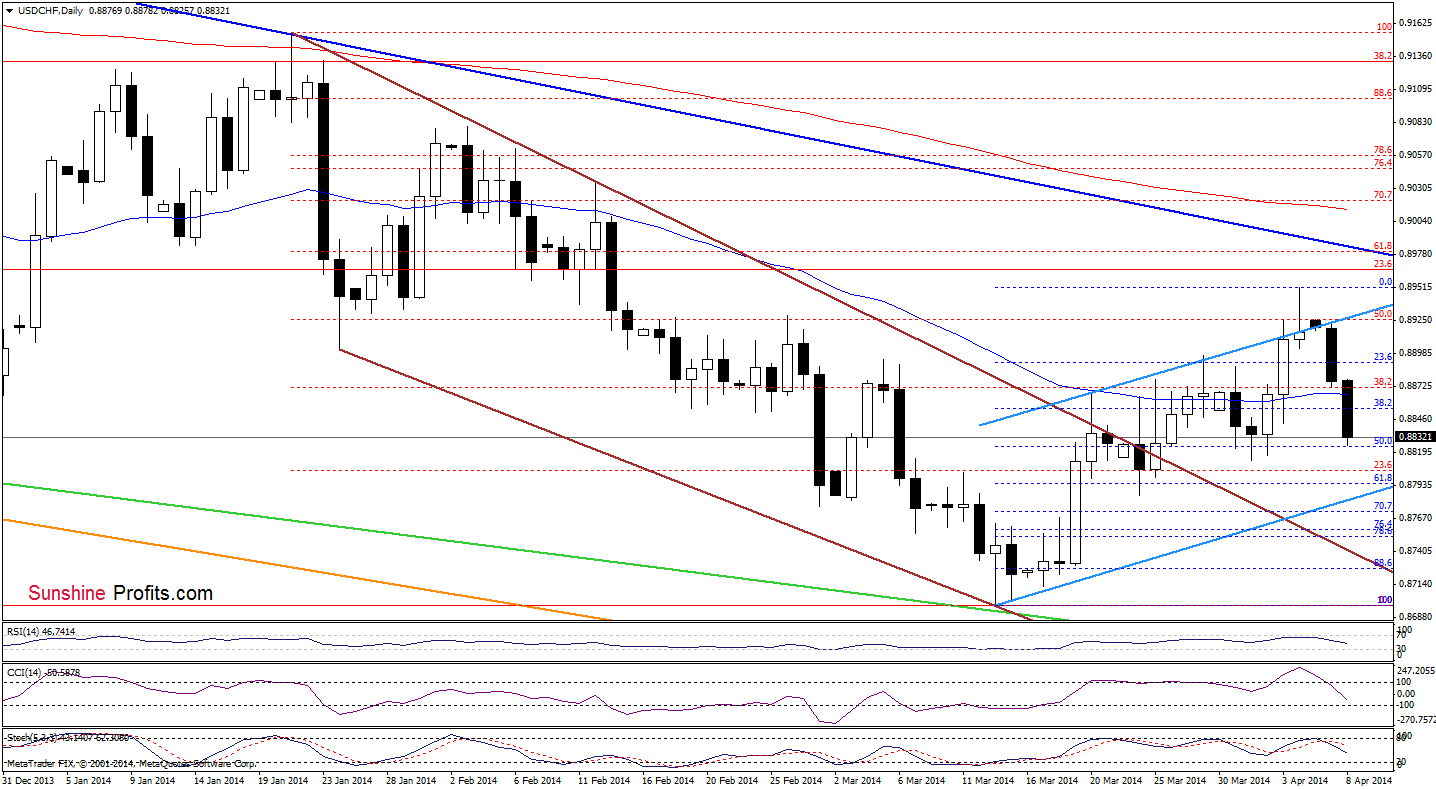
Looking at the daily chart, we see that USD/CHF also extended declines and reached the first downside target - the 50% Fibonacci retracement (based on the recent increase). If it encourages buyers to act, we may see a corrective upswing to the 50-day moving average. However, if it is broken, we will likely see a drop to the next Fibonacci retracement (around 0.8794) or even to the lower line of the blue rising trend channel (currently around 0.8781). Please note that the current position of the indicators still favors sellers.
Very short-term outlook: bearish
Short-term outlook: mixed with bearish bias
MT outlook: bearish
LT outlook: bearish
Trading position (short-term): In our opinion no positions are justified from the risk/reward perspective. We will keep you informed should anything change, or should we see a confirmation/invalidation of the above.
AUD/USD
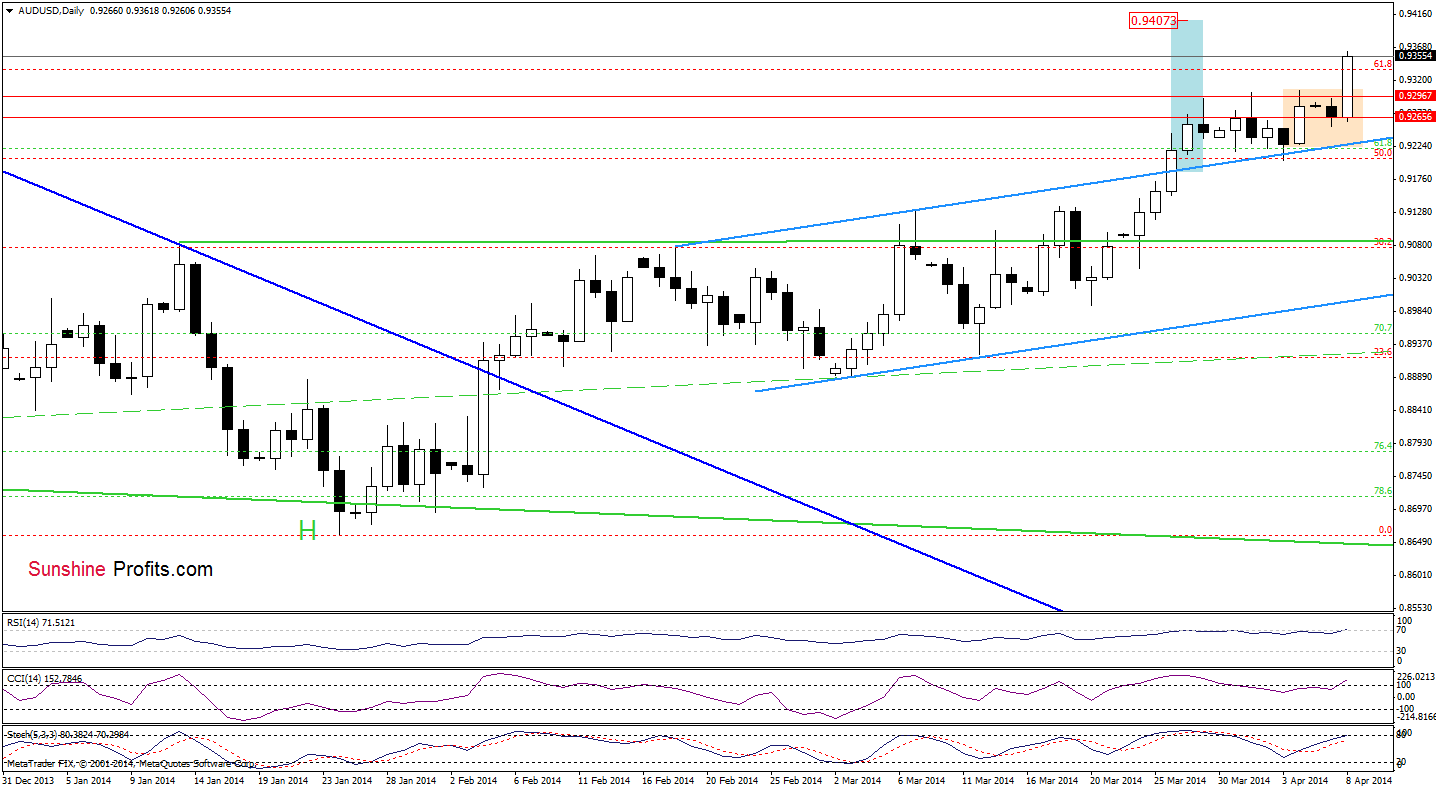
Quoting our previous Forex Trading Alert:
(…) if AUD/USD breaks above the 2014 high, the initial upside target will be the 61.8% Fibonacci retracement based on the entire Oct.-Jan. decline.
On the daily chart, we see that AUD/USD realized this scenario earlier today. Additionally, buyers mange to push the pair higher, which suggests that we may see an increase to the next upside target (after a breakout above the upper line of the rising trend channel) around 0.9407. However, we should keep in mind that the RSI and CCI are overbought, which may trigger a pullback in the coming day (or days).
Very short-term outlook: bullish
Short-term outlook: bullish
MT outlook: bearish
LT outlook: bearish
Trading position (short-term): In our opinion no positions are justified from the risk/reward perspective at the moment. We will keep you informed should anything change, or should we see a confirmation/invalidation of the above.
Thank you.
Nadia Simmons
Forex & Oil Trading Strategist
Forex Trading Alerts
Oil Investment Updates
Oil Trading Alerts

