
Earlier today, the U.S. currency extended declines against the Swiss franc and invalidated Friday’s breakout. Is it as bearish as it seems at first glance? If you want to know our take on this question, we invite you to read our today's Forex Trading Alert.
In our opinion the following forex trading positions are justified - summary:
EUR/USD
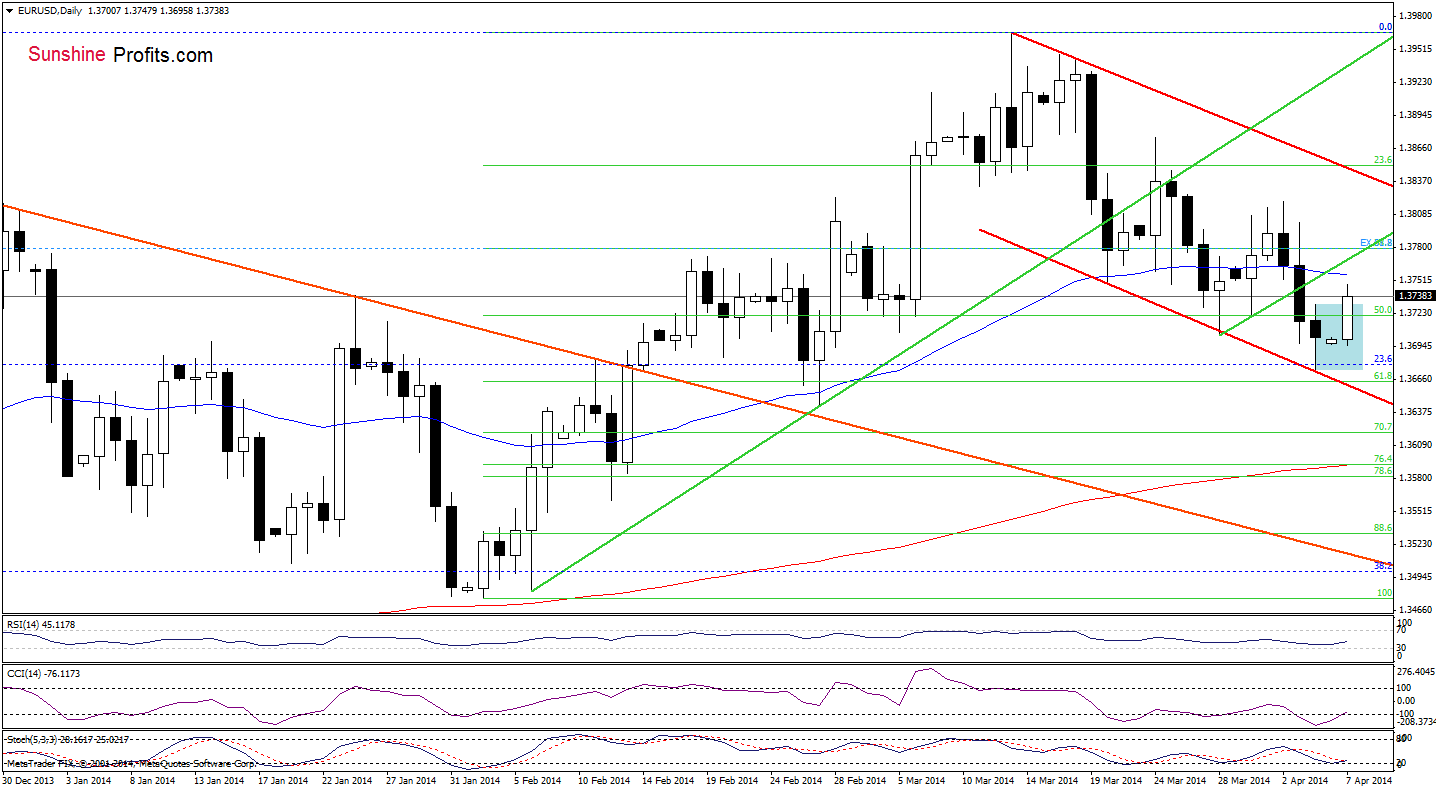
In our previous Forex Trading Alert, we wrote the following:
(…) the exchange rate (..) reached the downside target. If the support zone encourages buyers to act, we may see a corrective upswing to the previously-broken very short-term support/resistance green line (which corresponds to the 50-day moving average at the moment).
On the above chart, we see that although EUR/USD extended increases, the resistance area hasn’t been reached. Taking this fact into account and combining it with the current position of the indicators (the CCI and Stochastic Oscillator generated buy signals), it seems that we may see further improvement in the coming day (or days).
Before we summarize this currency pair, let’s take a look at the 4-hour chart.
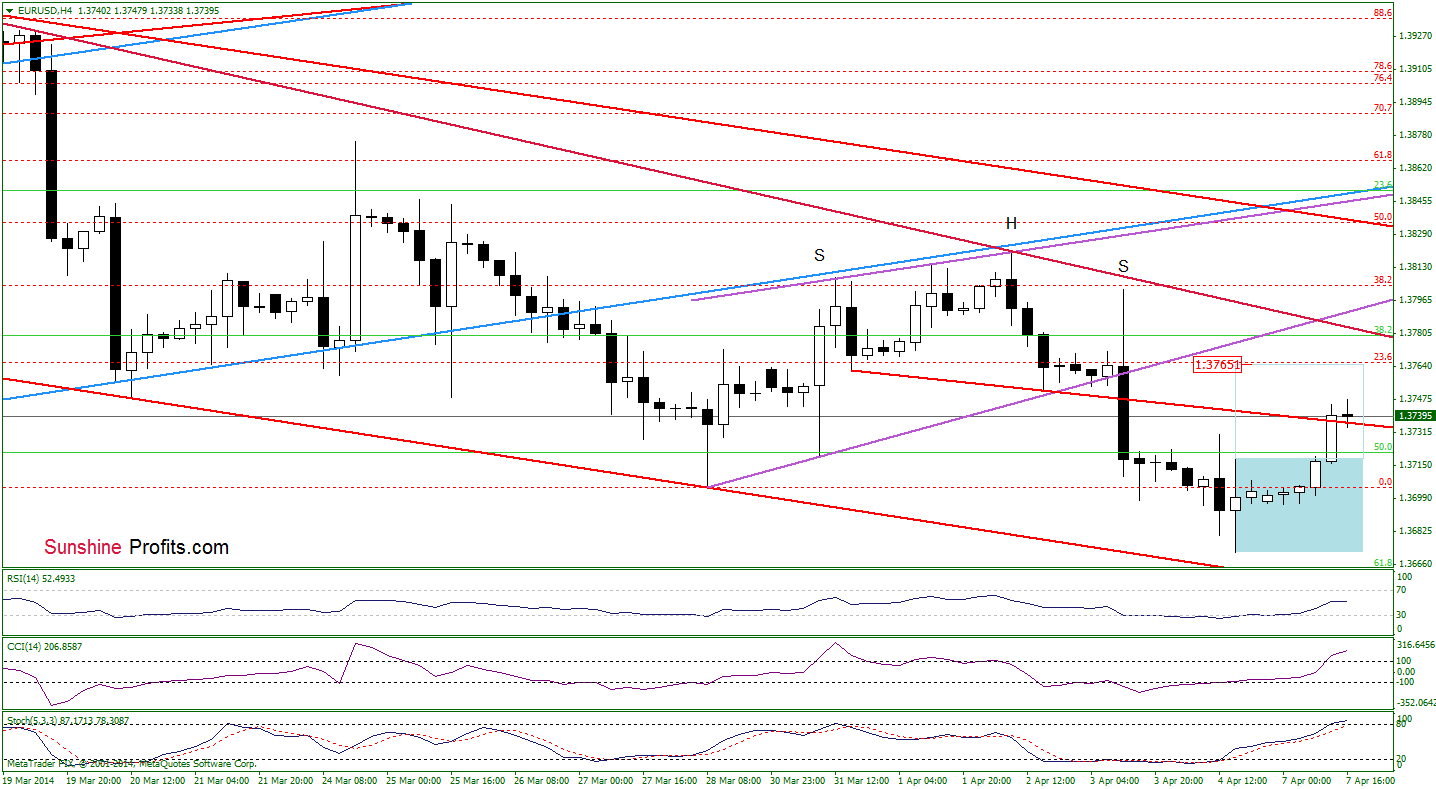
From this perspective, we see that the exchange rate came back above the previously-broken the neck line of the head and shoulders formation, which is a positive sign. Additionally, EUR/USD broke above the upper line of a consolidation (marked with blue), which suggests further improvement to around 1.3765. Nevertheless, the position of the indicators suggests that a pause (or a correction) is just around the corner.
Very short-term outlook: mixed
Short-term outlook: mixed
MT outlook: mixed
LT outlook: bearish
Trading position: In our opinion no positions are justified from the risk/reward perspective. We will keep you informed should anything change, or should we see a confirmation/invalidation of the above.
GBP/USD
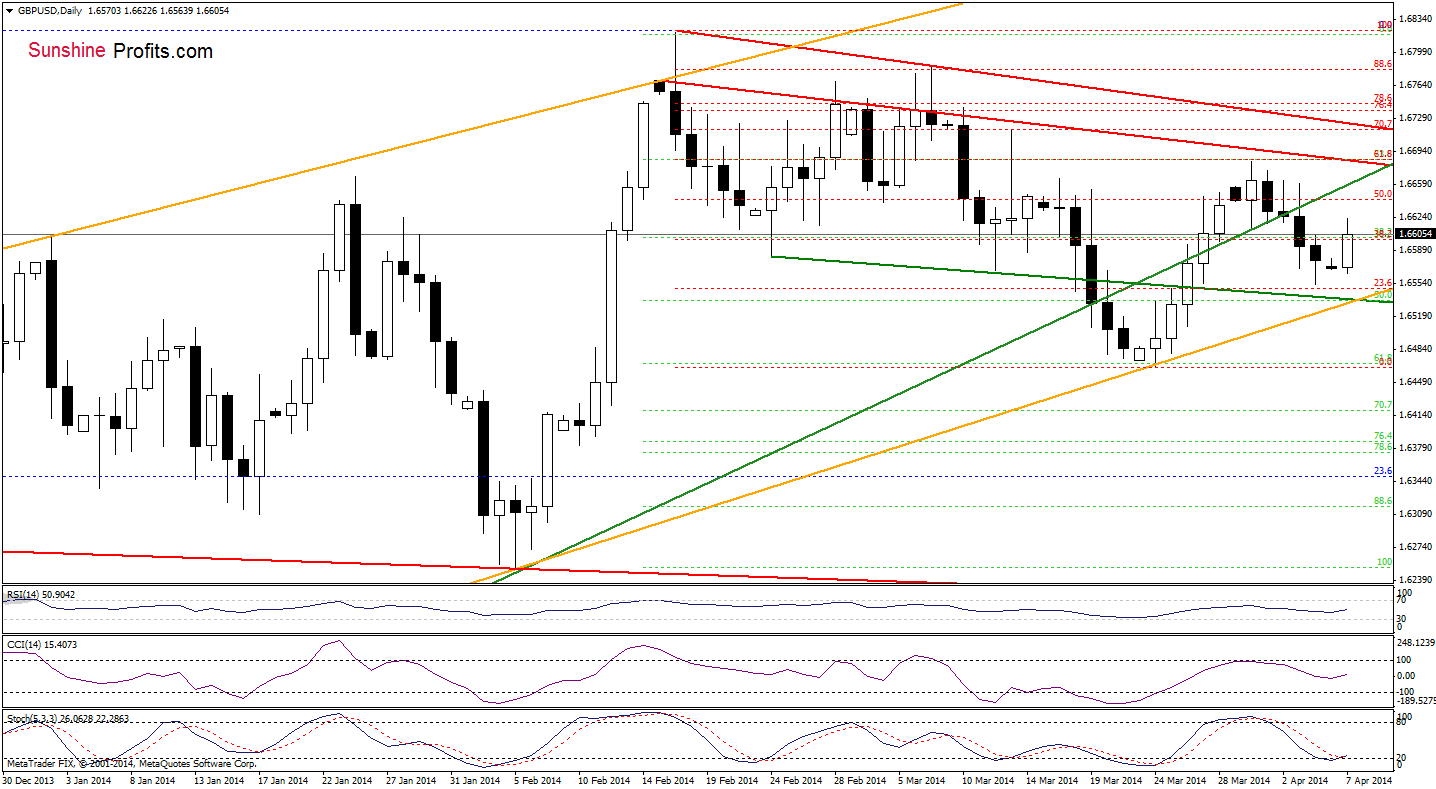
On the daily chart, we see that the situation hasn’t changed much as GBP/USD remains between the previously-broken medium-term support/resistance green line and the lower line of the orange rising trend channel (currently around 1.6531). Taking this fact into account, it seems that as long as there is no breakout above the resistance (or breakdown below the major support) a bigger upward (or downward) move is not likely to be seen.
Very short-term outlook: mixed
Short-term outlook: mixed
MT outlook: mixed
LT outlook: mixed
Trading position (short-term): In our opinion no positions are justified from the risk/reward perspective at the moment. We will keep you informed should anything change, or should we see a confirmation/invalidation of the above.
USD/JPY
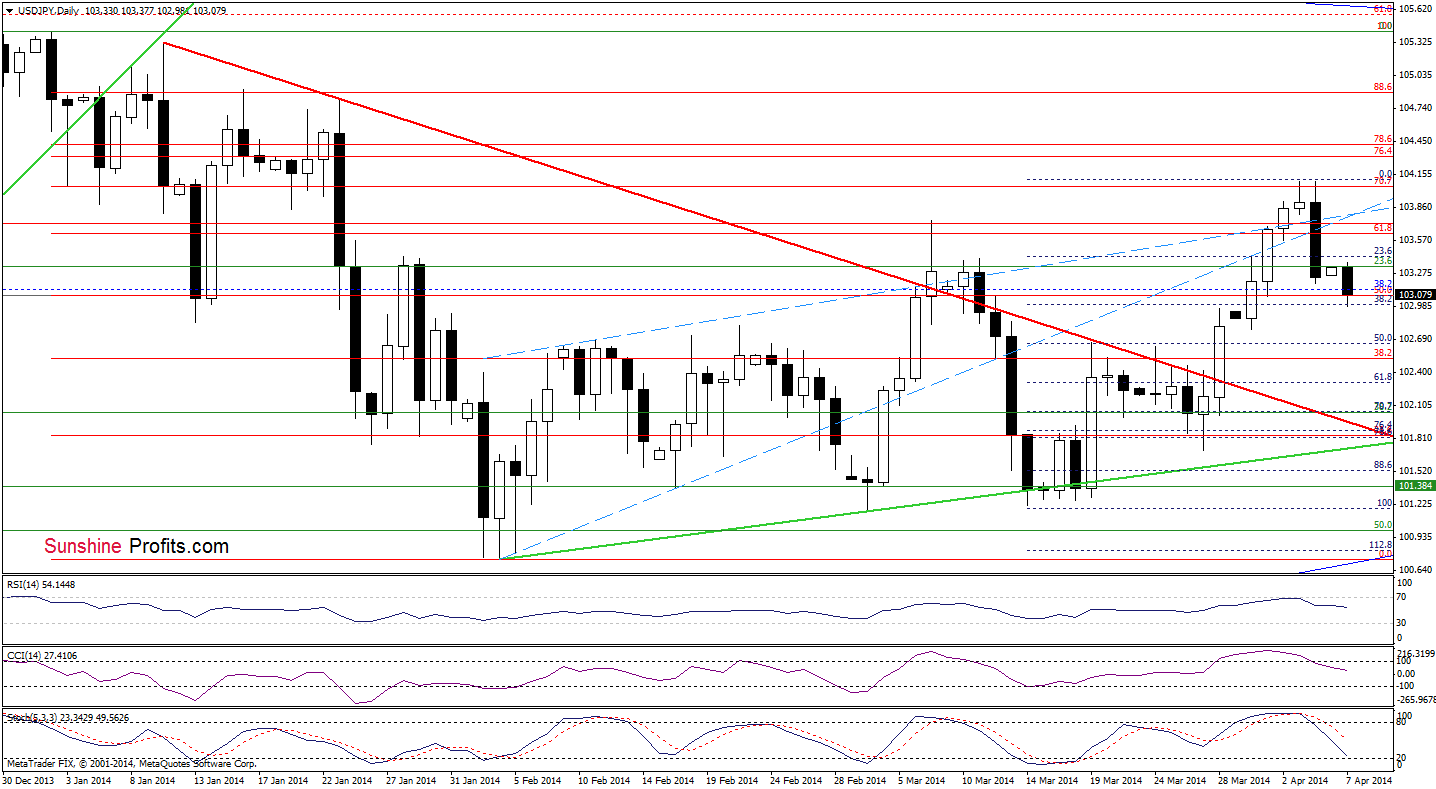
Quoting our previous Forex Trading Alert:
(..) the pair reversed and declined below the March high, which is a bearish signal. Additionally, all indicators are very close to generating sell signals, which suggests that further deterioration is likely to be seen in the coming day (or even days). If this is the case, the first downside target will be around 103, where the 38.2% Fibonacci retracement (based on the recent rally) is.
As you see on the daily chart, the sellers realized this bearish scenario earlier today, reaching the 38.2% Fibonacci retracement. From this perspective, we see that all indicators generated sell signals, which suggests further deterioration. If this is the case, the next goal for the sellers will be around 102.65, where the 50% Fibonacci retracement and the March 19 high are.
Very short-term outlook: mixed with bearish bias
Short-term outlook: mixed
MT outlook: bullish
LT outlook: bearish
Trading position (short-term): In our opinion no positions are justified from the risk/reward perspective at the moment. We will keep you informed should anything change, or should we see a confirmation/invalidation of the above.
USD/CAD
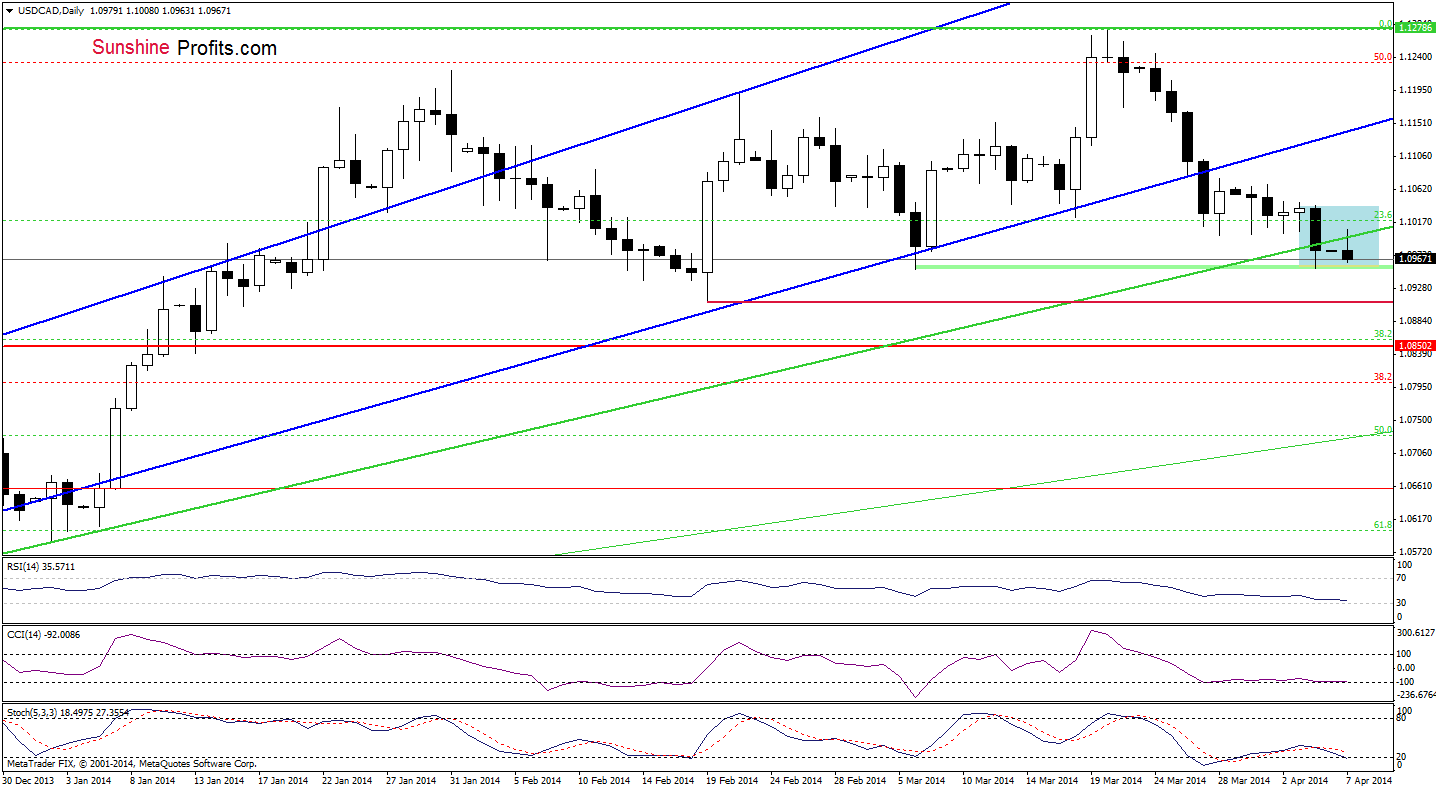
Looking at the daily chart, we see that the situation has deteriorated as the buyers didn’t manage to push USD/CAD above the medium-term green support/resistance line. Although this failed attempt triggered a pullback to Friday’s low, the exchange rate remains above the March 6 bottom. If this support level encourages buyers to act, we may see another attempt to move higher (the position of the indicators suggests that a corrective upswing is just around the corner). However, if it is broken, we may see further declines and the next downside target for the sellers will be the Feb.19 low (1.0909) or even the horizontal red support line created by the May 2010 high.
Very short-term outlook: bearish
Short-term outlook: mixed
MT outlook: bullish
LT outlook: bearish
Trading position (short-term): In our opinion no positions are justified from the risk/reward perspective. We will keep you informed should anything change, or should we see a confirmation/invalidation of the above.
USD/CHF
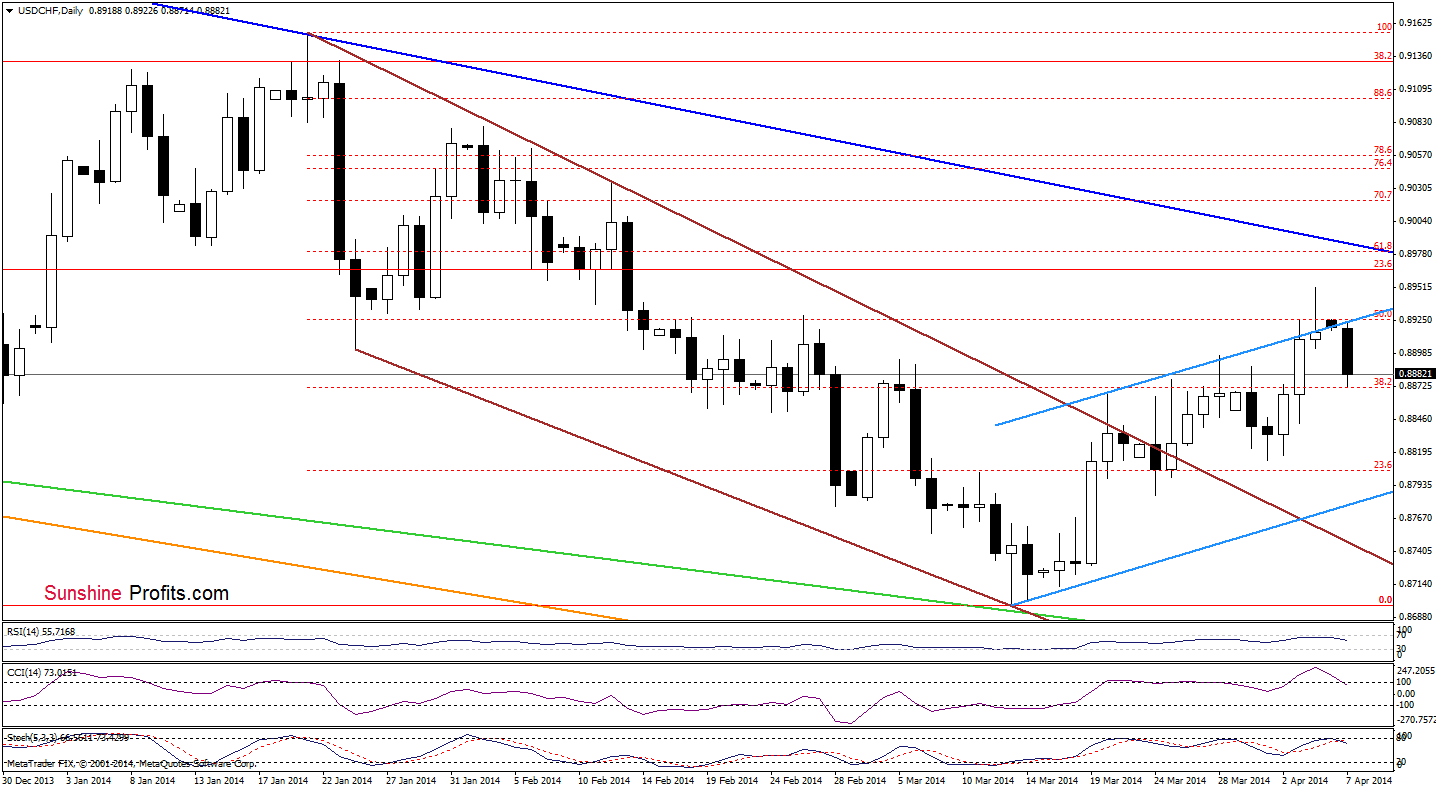
Looking at the daily chart, we see that USD/CHF invalidated a breakout above the upper line of the rising trend channel earlier today. This is a bearish signal, which suggests that we may see further deterioration in the following days – especially when we factor in sell signals generated by the indicators. If this is the case, the first downside target will be around 0.8825, where the 50% Fibonacci retracement (based on the recent increase) is.
Very short-term outlook: mixed with bearish bias
Short-term outlook: mixed
MT outlook: bearish
LT outlook: bearish
Trading position (short-term): In our opinion no positions are justified from the risk/reward perspective. We will keep you informed should anything change, or should we see a confirmation/invalidation of the above.
AUD/USD
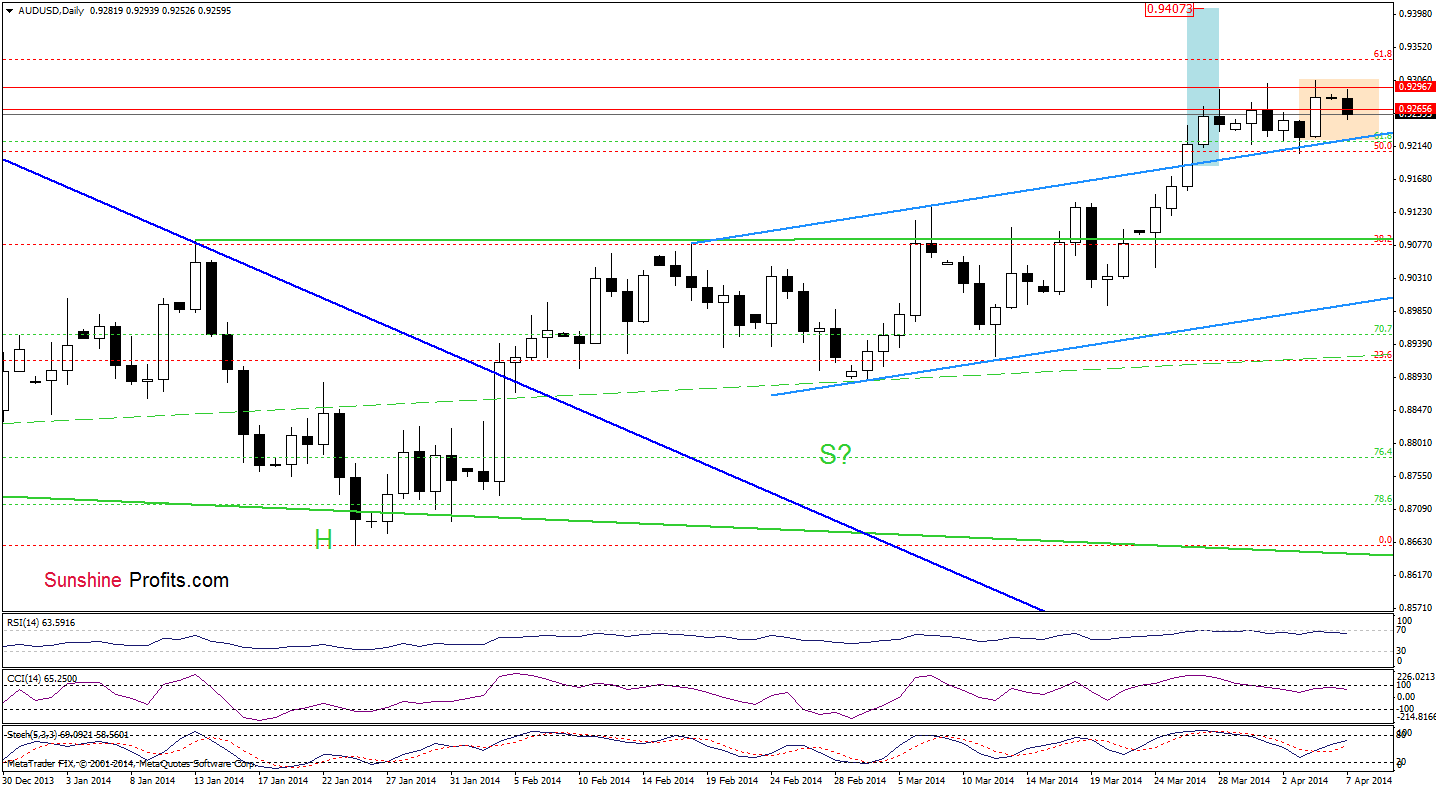
On the daily chart, we see that although AUD/USD declined earlier today, the overall situation hasn’t changed much as the exchange rate remains between a resistance zone created by lows from mid-November and the previously-broken upper line of the trend channel. Therefore, what we wrote in our previous Forex Trading Alert is still up-to-date.
(…) as long as the pair remains in this narrow range, we won’t see a bigger upswing or downswing. Please note that if AUD/USD breaks above the 2014 high, the initial upside target will be the 61.8% Fibonacci retracement based on the entire Oct.-Jan. decline. On the other hand, if the exchange rate drops below the upper line of the trend channel, the first target will be around March 7 high (0.9132).
Very short-term outlook: mixed
Short-term outlook: bullish
MT outlook: bearish
LT outlook: bearish
Trading position (short-term): In our opinion no positions are justified from the risk/reward perspective at the moment. We will keep you informed should anything change, or should we see a confirmation/invalidation of the above.
Thank you.
Nadia Simmons
Forex & Oil Trading Strategist
Forex Trading Alerts
Oil Investment Updates
Oil Trading Alerts

