
The U.S. currency moved higher and then reversed sharply after the Labor Department showed that the U.S. economy added 192,000 jobs in March, missing expectations for a 200,000 increase. The report also showed that the unemployment rate remained unchanged at 6.7% in the previous month (also below expectations for a drop to 6.6%). What impact did it have on major currency pairs? What is their current outlook? If you want to know our take on this question, we invite you to read our today's Forex Trading Alert.
In our opinion the following forex trading positions are justified - summary:
EUR/USD
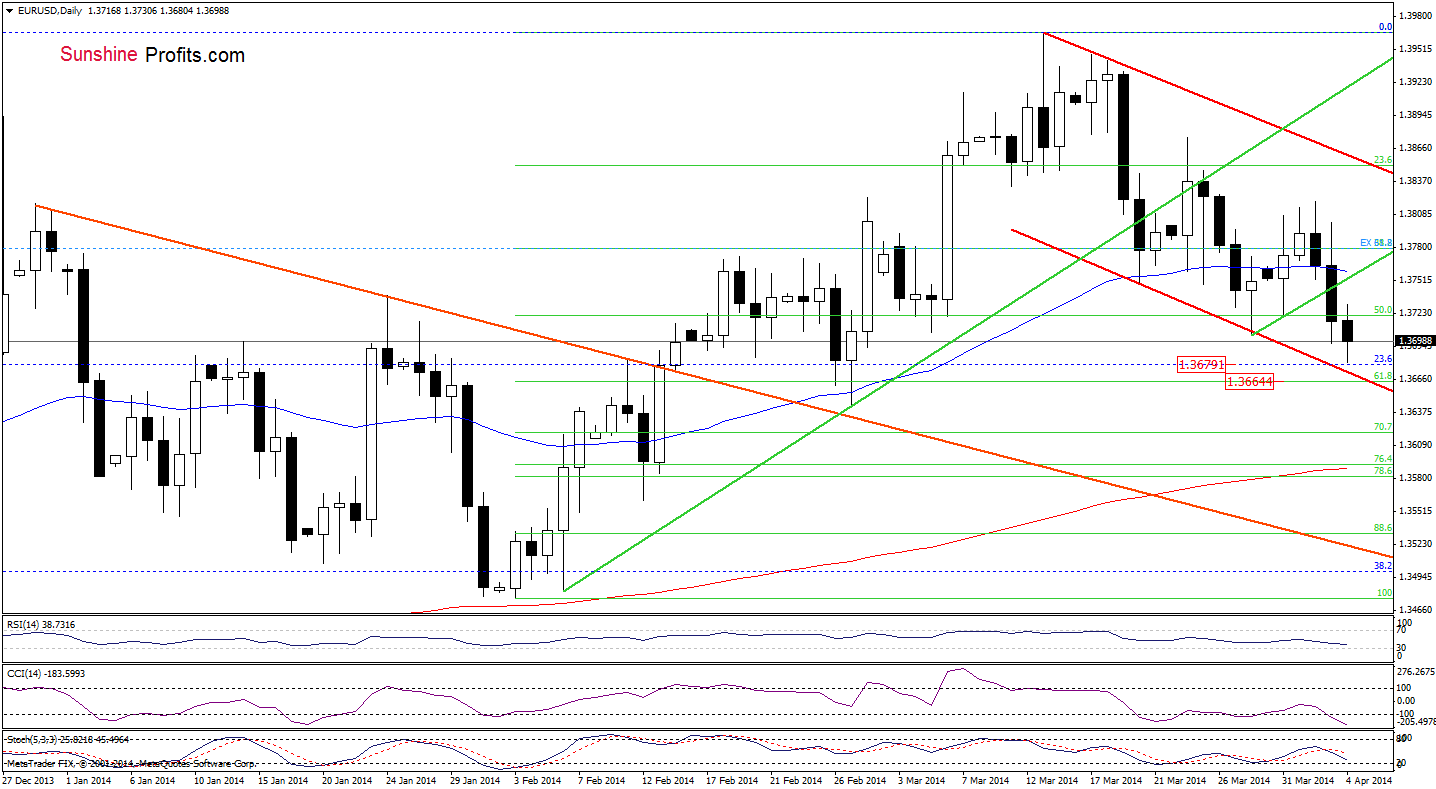
In our previous Forex Trading Alert, we wrote the following:
(…) if the exchange rate declines once again, the first downside target for the sellers will be the lower border of the declining trend channel (marked with red), which corresponds to the 23.6% Fibonacci retracement based on the entire April 2013-March 2014 increase. Slightly below these levels is also the 61.8% Fibonacci retracement based on the recent rally, which together create a strong support zone.
On the above chart, we see that the exchange rate extended declines and reached the downside target. If the support zone encourages buyers to act, we may see a corrective upswing to the previously-broken very short-term support/resistance green line (which corresponds to the 50-day moving average at the moment). However, if the sellers successfully broke below this support area, we will likely see a correction to at least 1.3642, where the Feb.27 low is.
Let’s zoom in on our picture and move on to the 4-hour chart.
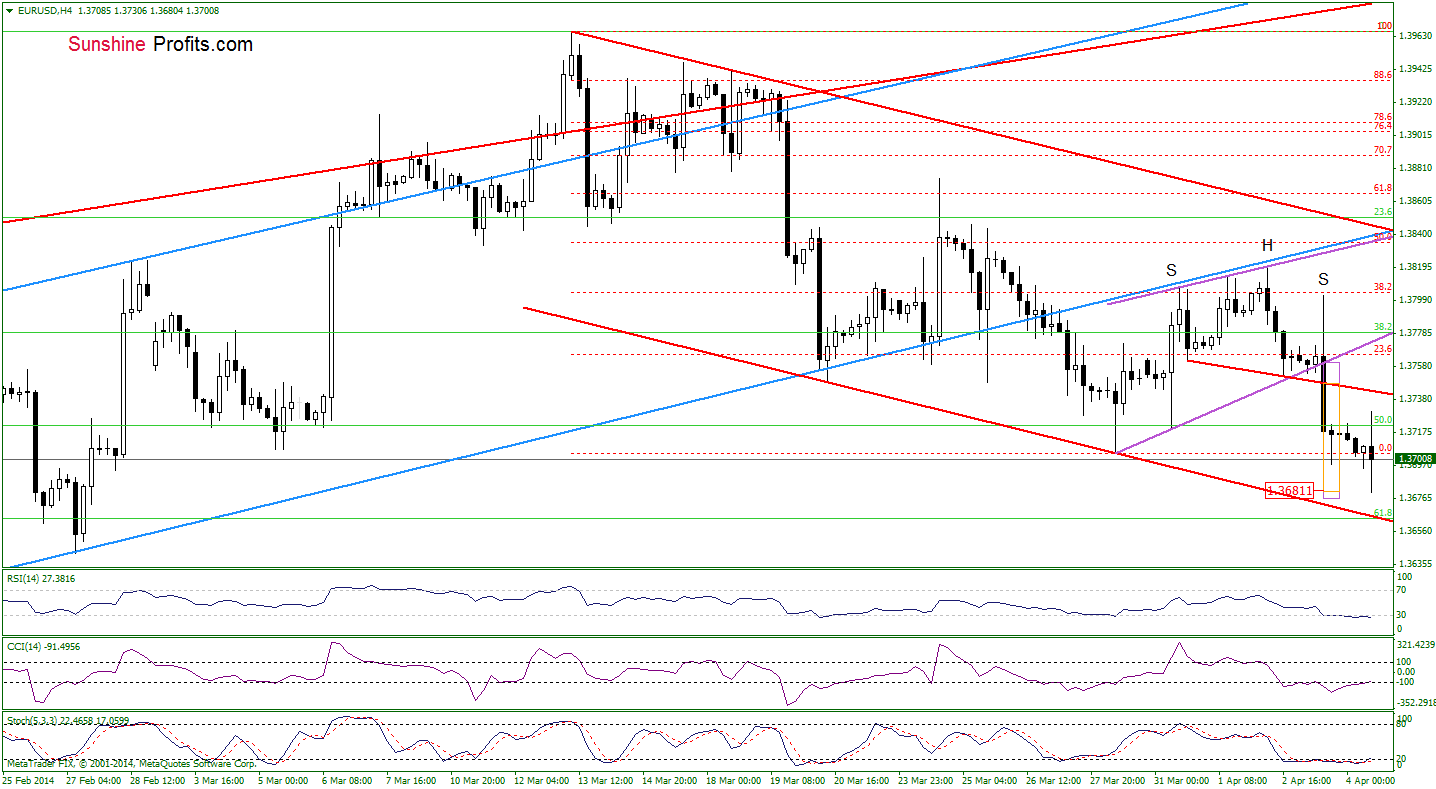
Quoting our last Forex Trading Alert:
(…) we noticed a small head-and-shoulders pattern. According to theory, a drop below the neck level will likely trigger a decline to around 1.3681. Please not that slightly below this level is also the price target, which corresponds to the height of the purple trend channel.
As you see on the above chart, the sellers realized this bearish scenario earlier today as EUR/USD dropped to an intraday low of 1.3672. Slightly below this level is the red declining support line, which stopped further deterioration in the previous month (currently at 1.3665). If history repeats itself once again, we may see a corrective upswing in the near future - especially when we take into account the fact that all indicators are oversold (additionally, there is a positive divergence between the CCI and the exchange tare).
Very short-term outlook: bearish
Short-term outlook: mixed
MT outlook: mixed
LT outlook: bearish
Trading position: In our opinion no positions are justified from the risk/reward perspective. We will keep you informed should anything change, or should we see a confirmation/invalidation of the above.
GBP/USD
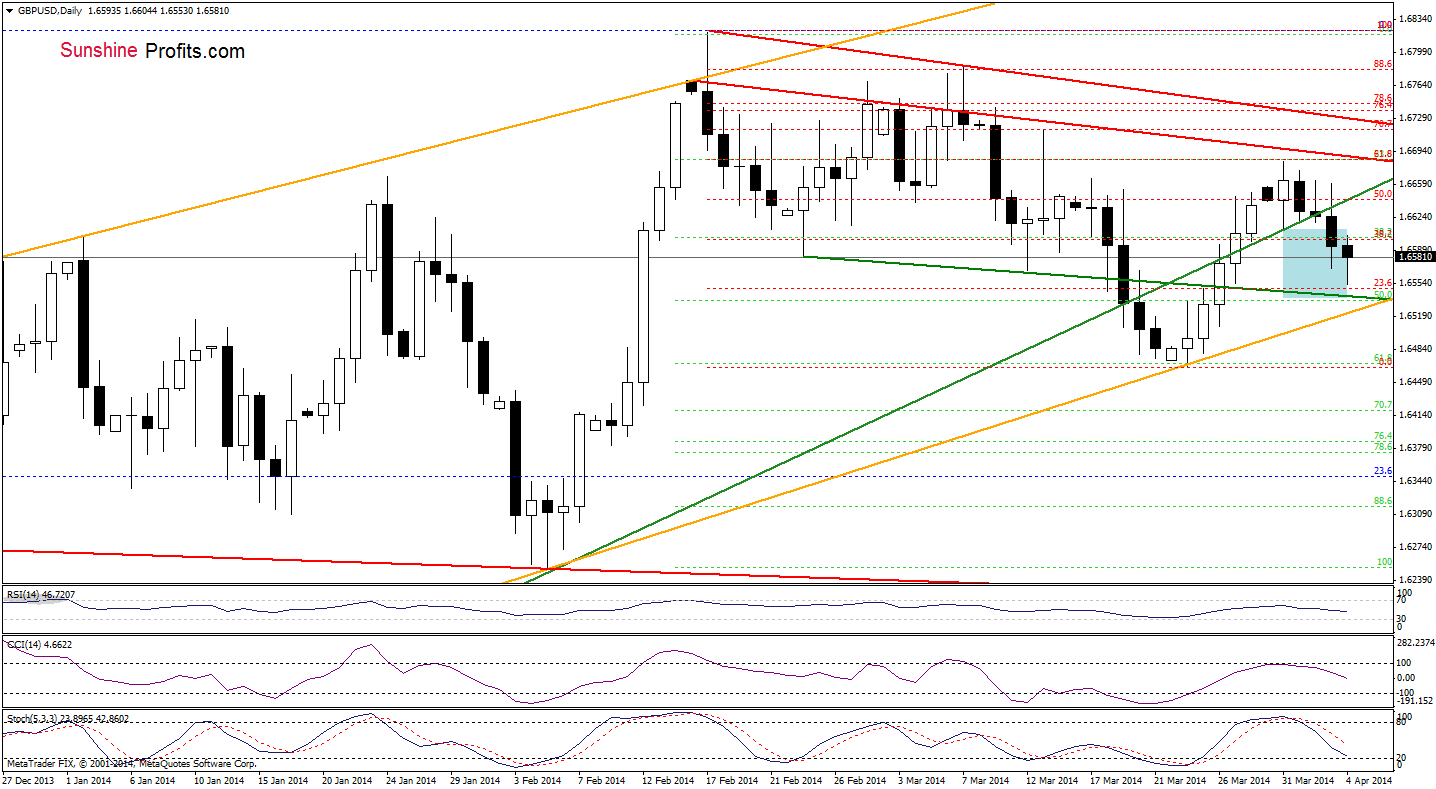
Yesterday, we wrote the following:
(…) taking into account the current position of the indicators (sell signals generated by the indicators remain in place), it seems that we will see further deterioration in the coming day (or days). If this is the case, the first downside target for the sellers will be the previously-broken green support line (currently around 1.6542).
Looking at the above chart, we see that the sellers almost realized this bearish scenario as GBP/USD dropped to an intraday low of 1.6553. Similarly to what we wrote in the case of EUR/USD, if this support encourages buyers to act, we will likely see a corrective upswing to the previously-broken medium-term support/resistance green line. The current position of the indicators still supports sellers, however, even if the pair drops below today’s low, the space for further declines will be likely limited by the lower border of the orange rising trend channel (currently around 1.6520).
Very short-term outlook: bearish
Short-term outlook: mixed
MT outlook: mixed
LT outlook: mixed
Trading position (short-term): In our opinion no positions are justified from the risk/reward perspective at the moment. We will keep you informed should anything change, or should we see a confirmation/invalidation of the above.
USD/JPY
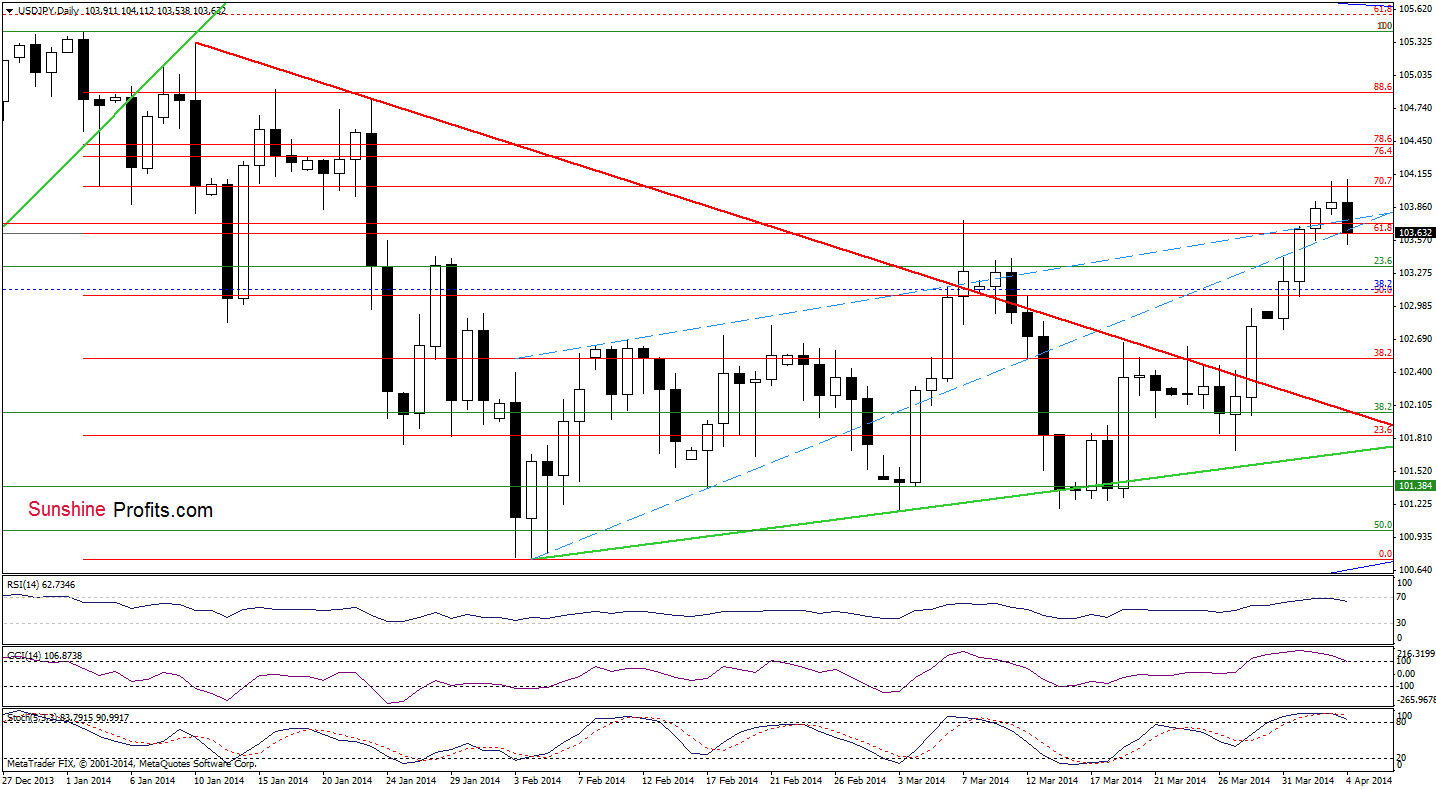
Quoting our previous Forex Trading Alert:
(…) the pair (…) reached the 70.7% Fibonacci retracement (the next upside target). However, taking into account the fact that bodies of the recent candles are getting smaller (which suggests a decreasing power of buyers) and combining it with the current position of the indicators (the RSI approached the level of 70, while the CCI and Stochastic Oscillator are overbought), it seems that a correction is just around the corner – especially if the indicators generate sell signals.
As you see on the daily chart, although USD/JPY hit a fresh monthly high, the pair reversed and declined below the March high, which is a bearish signal. Additionally, all indicators are very close to generating sell signals, which suggests that further deterioration is likely to be seen in the coming day (or even days). If this is the case, the first downside target will be around 103, where the 38.2% Fibonacci retracement (based on the recent rally) is. If it is broken, the next goal for the sellers will be around 102.65, where the 50% Fibonacci retracement and the March 19 high are.
Very short-term outlook: mixed with bearish bias
Short-term outlook: mixed
MT outlook: bullish
LT outlook: bearish
Trading position (short-term): In our opinion no positions are justified from the risk/reward perspective at the moment. We will keep you informed should anything change, or should we see a confirmation/invalidation of the above.
USD/CAD
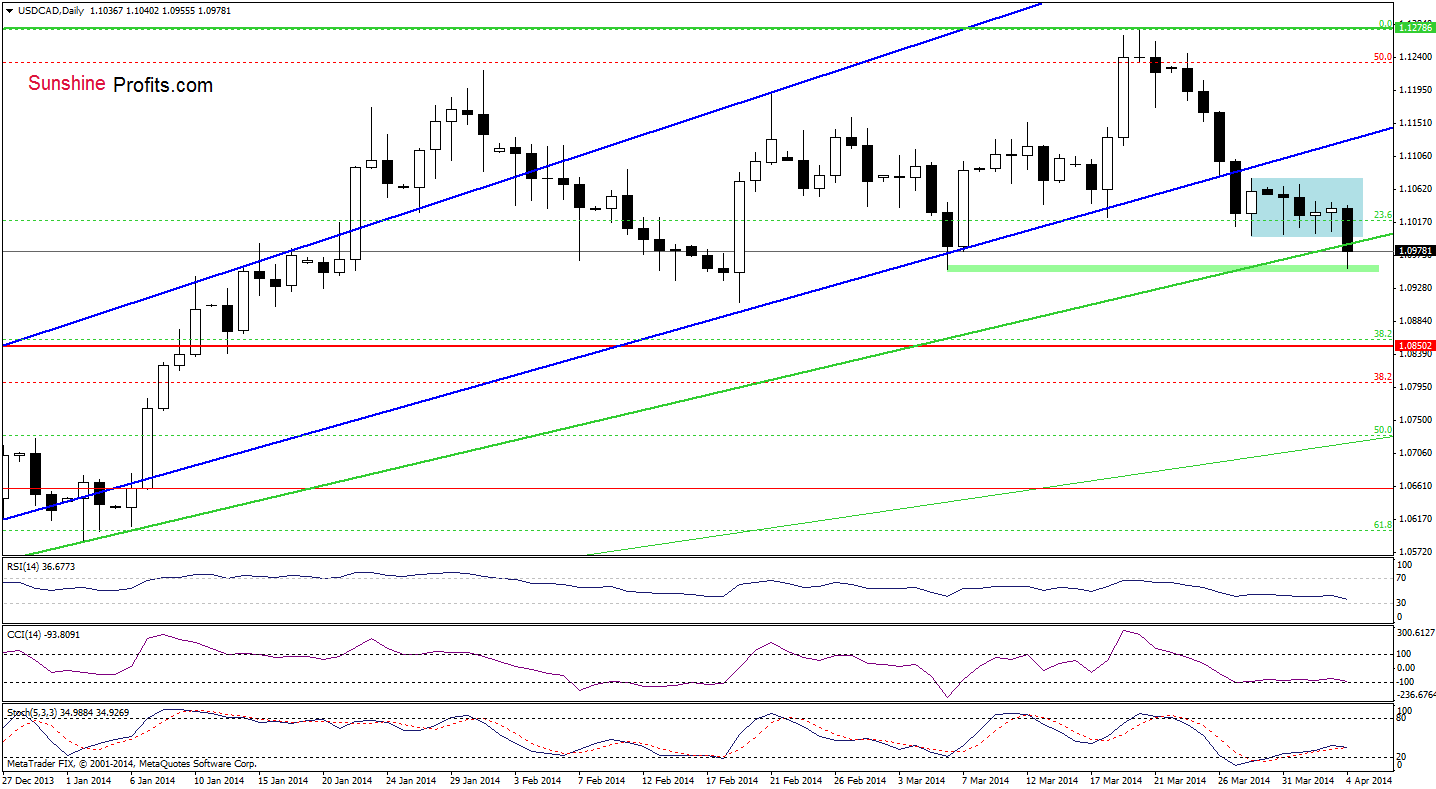
Looking at the above chart, we see that the situation has deteriorated slightly as USD/CAD dropped below the lower border of a consolidation. With this downswing, the pair broke below the medium-term green support line and almost touched the March 6 low. Earlier today, this support triggered a corrective upswing, however as long as the exchange rate remains below the medium-term support line, another attempt to move lower can’t be ruled out. Please note that if USD/CAD extends declines, the next downside target for the sellers will be the Feb.19 low (1.0909) or even the horizontal red support line created by the May 2010 high. Nevertheless, looking at the position of the indicators, we see positive divergences between the CCI, Stochastic Oscillator and the exchange rate, which suggests that we may see a bigger corrective upswing in the near future.
Very short-term outlook: bearish
Short-term outlook: mixed
MT outlook: bullish
LT outlook: bearish
Trading position (short-term): In our opinion no positions are justified from the risk/reward perspective. We will keep you informed should anything change, or should we see a confirmation/invalidation of the above.
USD/CHF
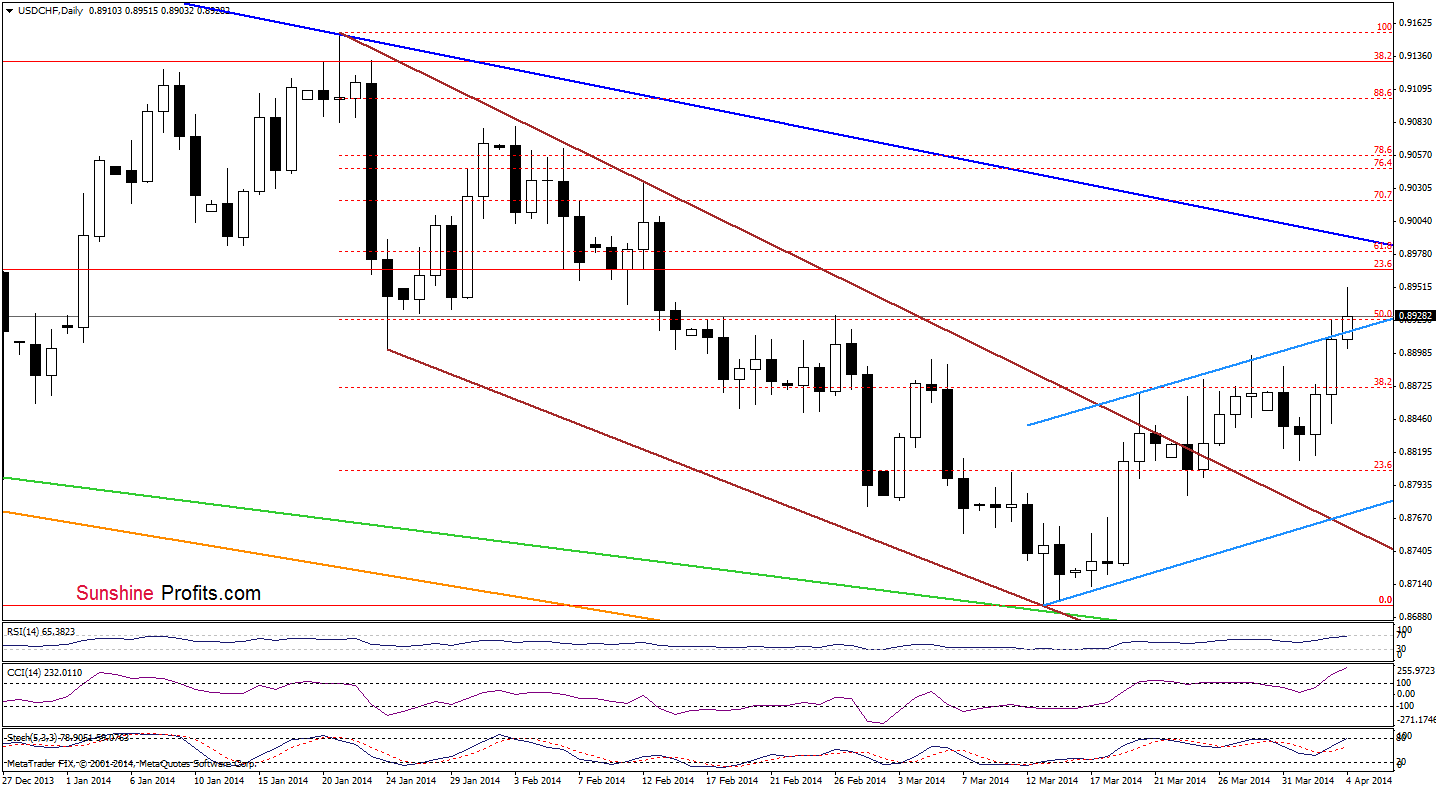
Looking at the daily chart, we see that USD/CHF extended gains and broke above the upper line of the rising trend channel earlier today. According to theory, such price action should trigger further improvement. However, the space for growth may be limited by a resistance zone created by the 61.8% Fibonacci retracement and the medium-term declining line (marked with blue). Please note that the CCI is overbought, while the RSI reached its highest level since the beginning of the year, which prescribe caution.
Very short-term outlook: mixed
Short-term outlook: mixed
MT outlook: bearish
LT outlook: bearish
Trading position (short-term): In our opinion no positions are justified from the risk/reward perspective. We will keep you informed should anything change, or should we see a confirmation/invalidation of the above.
AUD/USD
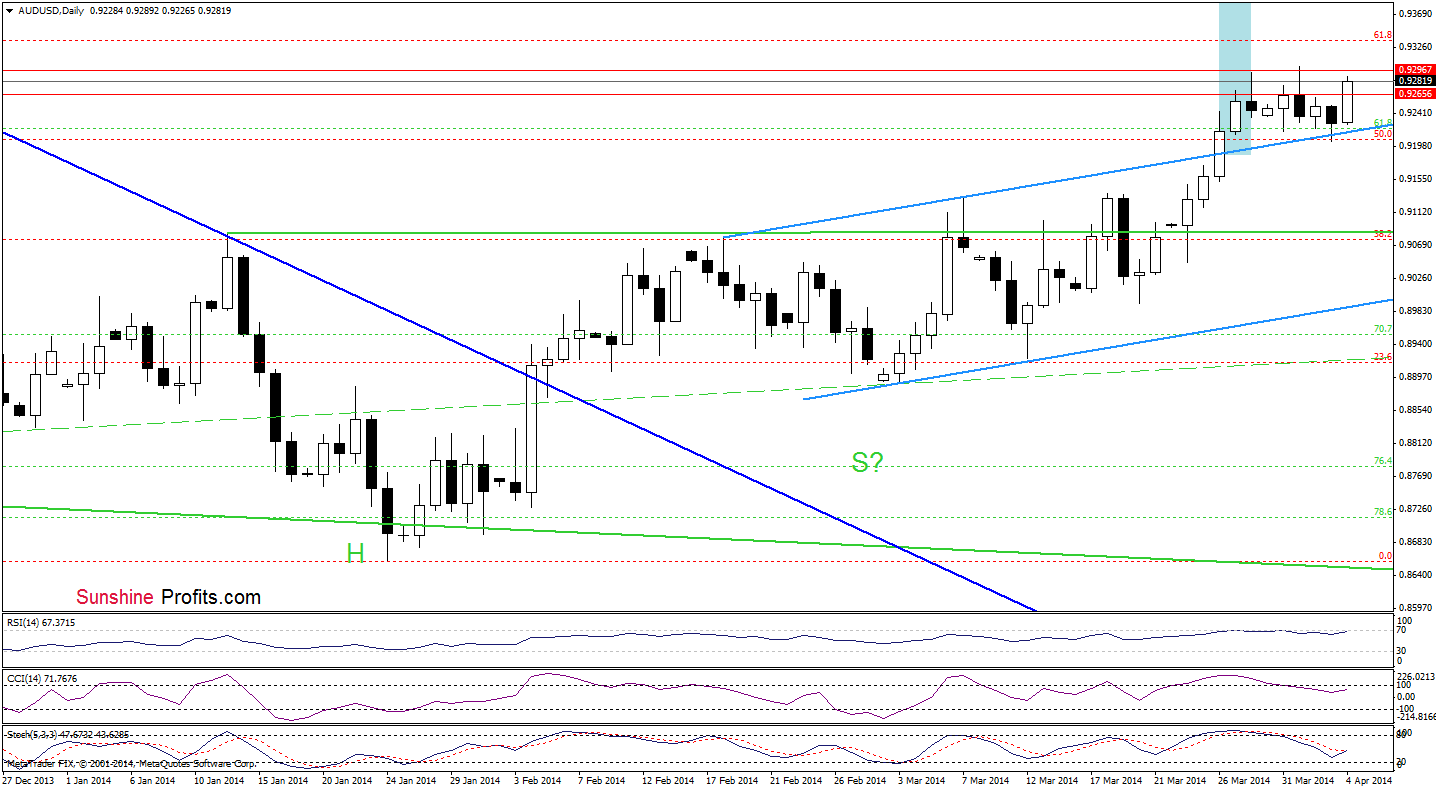
Looking at the above chart, we see that although AUD/USD increased earlier today, the overall situation hasn’t changed much as the exchange rate remains between a resistance zone created by lows from mid-November and the previously-broken upper line of the trend channel. Therefore, as long as the pair remains in this narrow range, we won’t see a bigger upswing or downswing. Please note that if AUD/USD breaks above the 2014 high, the initial upside target will be the 61.8% Fibonacci retracement based on the entire Oct.-Jan. decline. On the other hand, if the exchange rate drops below the upper line of the trend channel, the first target will be around March 7 high (0.9132).
Very short-term outlook: mixed
Short-term outlook: bullish
MT outlook: bearish
LT outlook: bearish
Trading position (short-term; our opinion): In our opinion no positions are justified from the risk/reward perspective at the moment. We will keep you informed should anything change, or should we see a confirmation/invalidation of the above.
Thank you.
Nadia Simmons
Forex & Oil Trading Strategist
Forex Trading Alerts
Oil Investment Updates
Oil Trading Alerts

