
Earlier today, the U.S. currency moved higher against major currencies after the ADP report showed that the U.S. private sector added 191,000 jobs in March (slightly below expectations for an increase of 195,000). In the following hours, the greenback extended gains after the Commerce Department showed that U.S. factory orders increased 1.6% in February (above forecasts for a 1.2% rise). What impact did it have on major currency pairs? What is their current outlook? If you want to know our take on this question, we invite you to read our today's Forex Trading Alert.
In our opinion the following forex trading positions are justified - summary:
EUR/USD
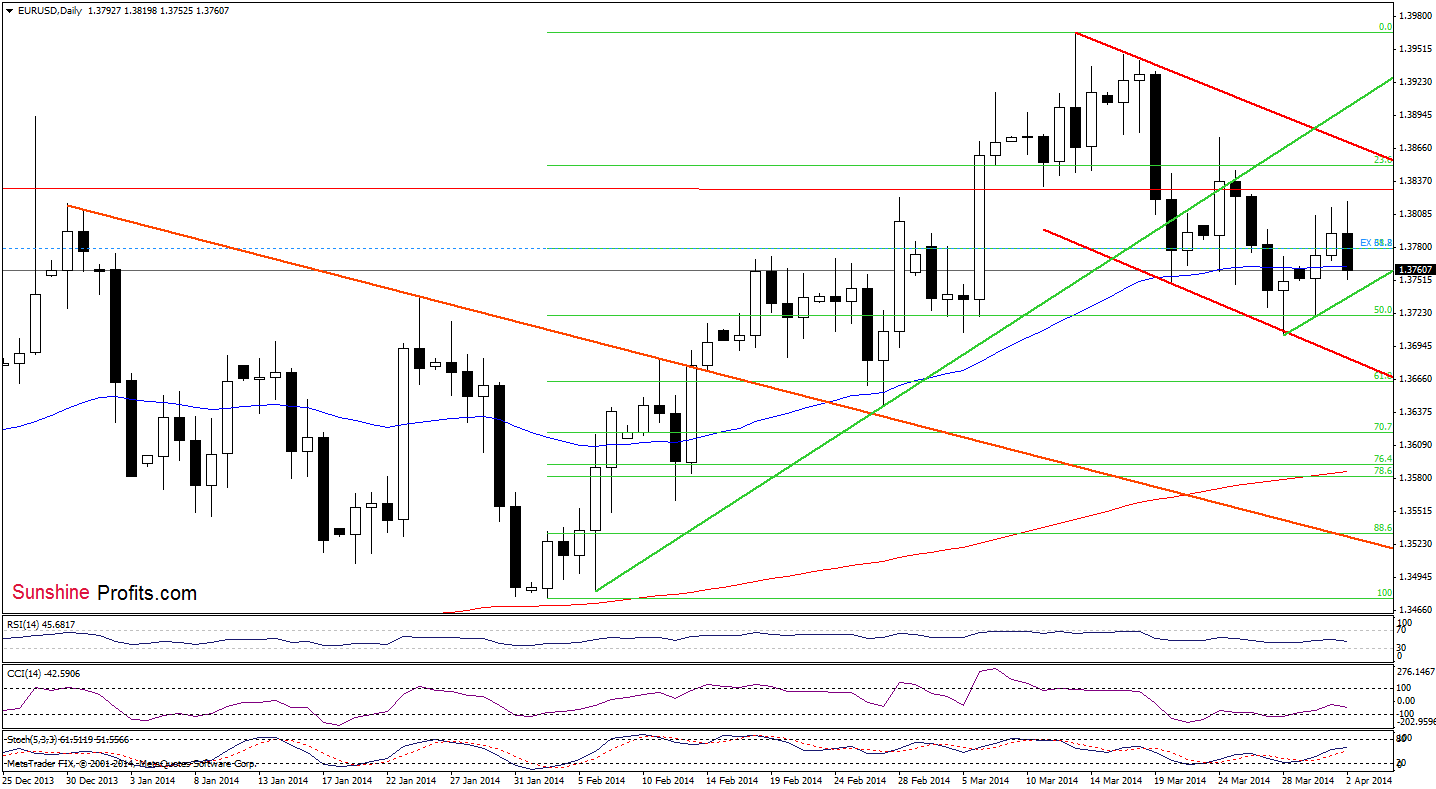
Although EUR/USD extended gains and increased to an intraday high of 1.3819, the pair gave up the gains and declined to slightly below the 50-day moving average. From this perspective, it seems that if this support is successfully broken, the exchange rate will drop to the very short-term support line based on the recent lows. Will we see such price action in the following hours? Let’s take a look at the 4-hour chart and try to find an answer to this question.
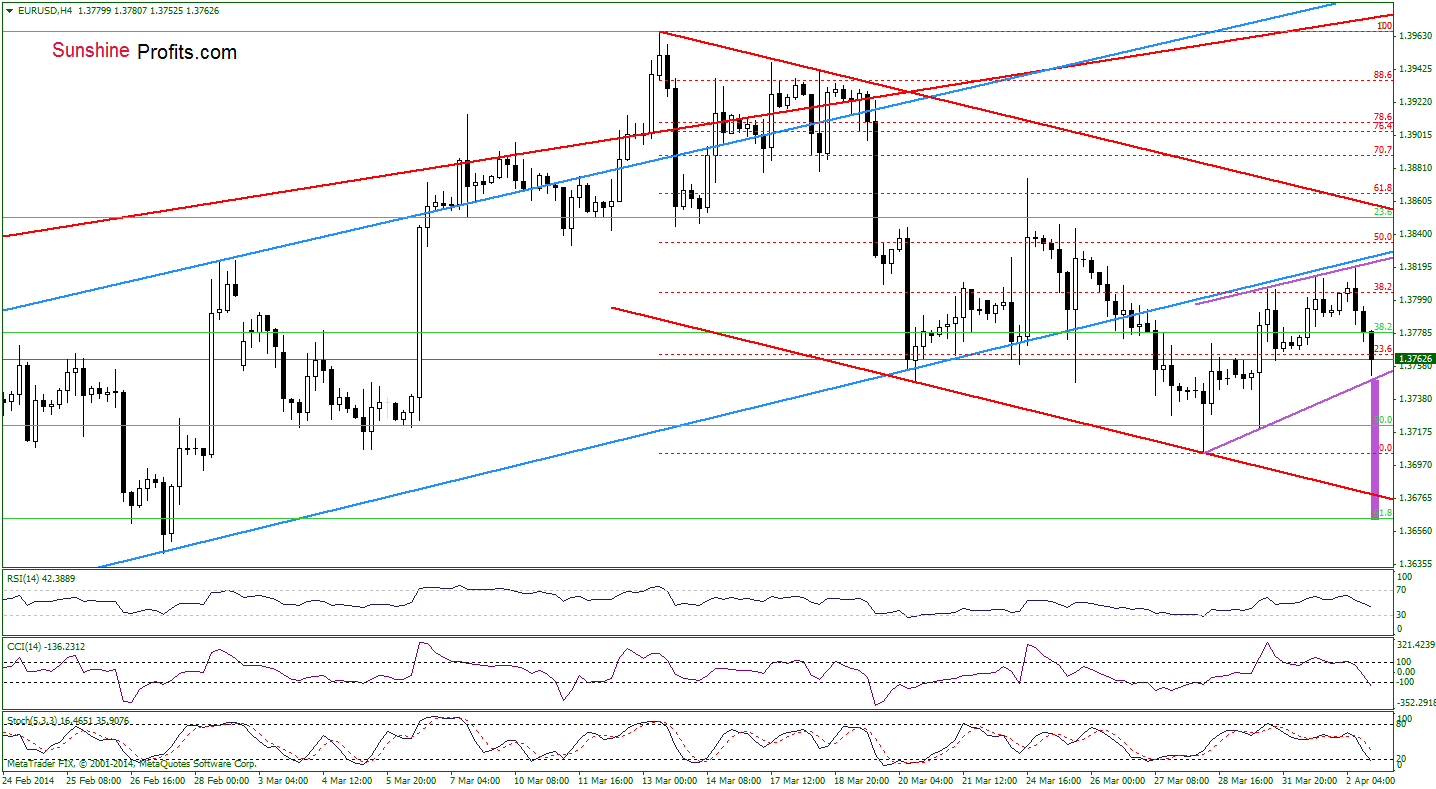
From this perspective, we see that the main reason for today's decline was the lower border of the blue rising trend channel. The proximity to this resistance in combination with sell signals generated by the indicators encouraged sellers to act and triggered a pullback. With this downswing, the exchange rate approached the support line based on recent lows. If EUR/USD declines below this line, we will likely see a test of the strength of the 50% Fibonacci retracement level. If this support is broken, the next downside target will be the March 28 low. At this point, it’s worth noting that if we draw a parallel line to the support line based on the recent lows, we will receive a small rising trend channel (marked with purple). If the sellers successfully push the exchange rate below the lower border of this formation, we may see a drop even to the 61.8% Fibonacci retracement level (based on the entire February-March increase).
Very short-term outlook: mixed with bearish bias
Short-term outlook: mixed
MT outlook: mixed
LT outlook: bearish
Trading position: In our opinion no positions are justified from the risk/reward perspective. We will keep you informed should anything change, or should we see a confirmation/invalidation of the above.
GBP/USD
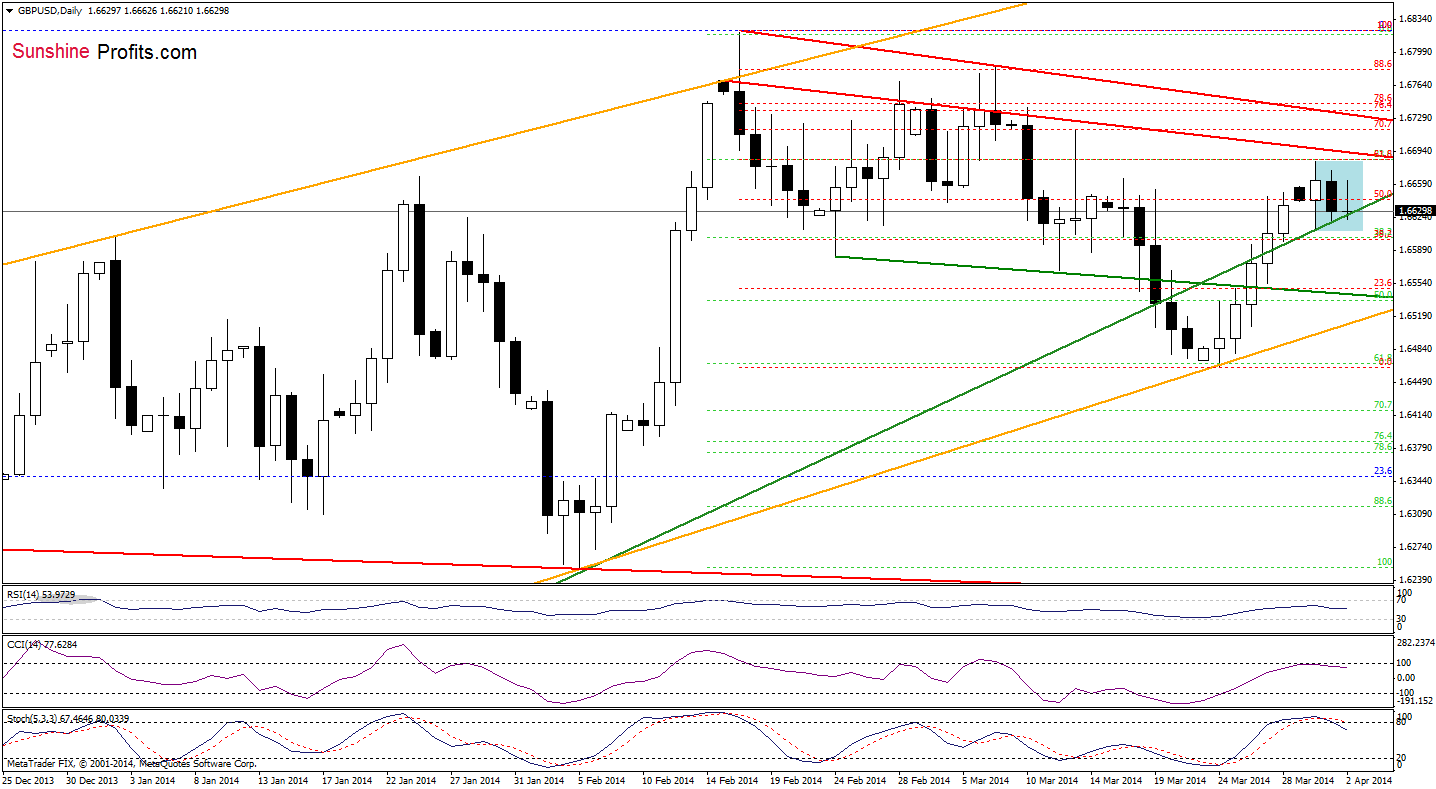
As you see on the daily chart, the situation hasn’t changed much as GBP/USD remains in a consolidation between Monday’s high and low (still remains above the medium-term green support line, which is a positive signal). Nevertheless, we should keep in mind that the current position of the indicators (the CCI and Stochastic Oscillator generated sell signals) suggests that further deterioration is just around the corner. Where the pair could decline in the near future? Will the 4-hour chart give us any clues? Let’s take a look.
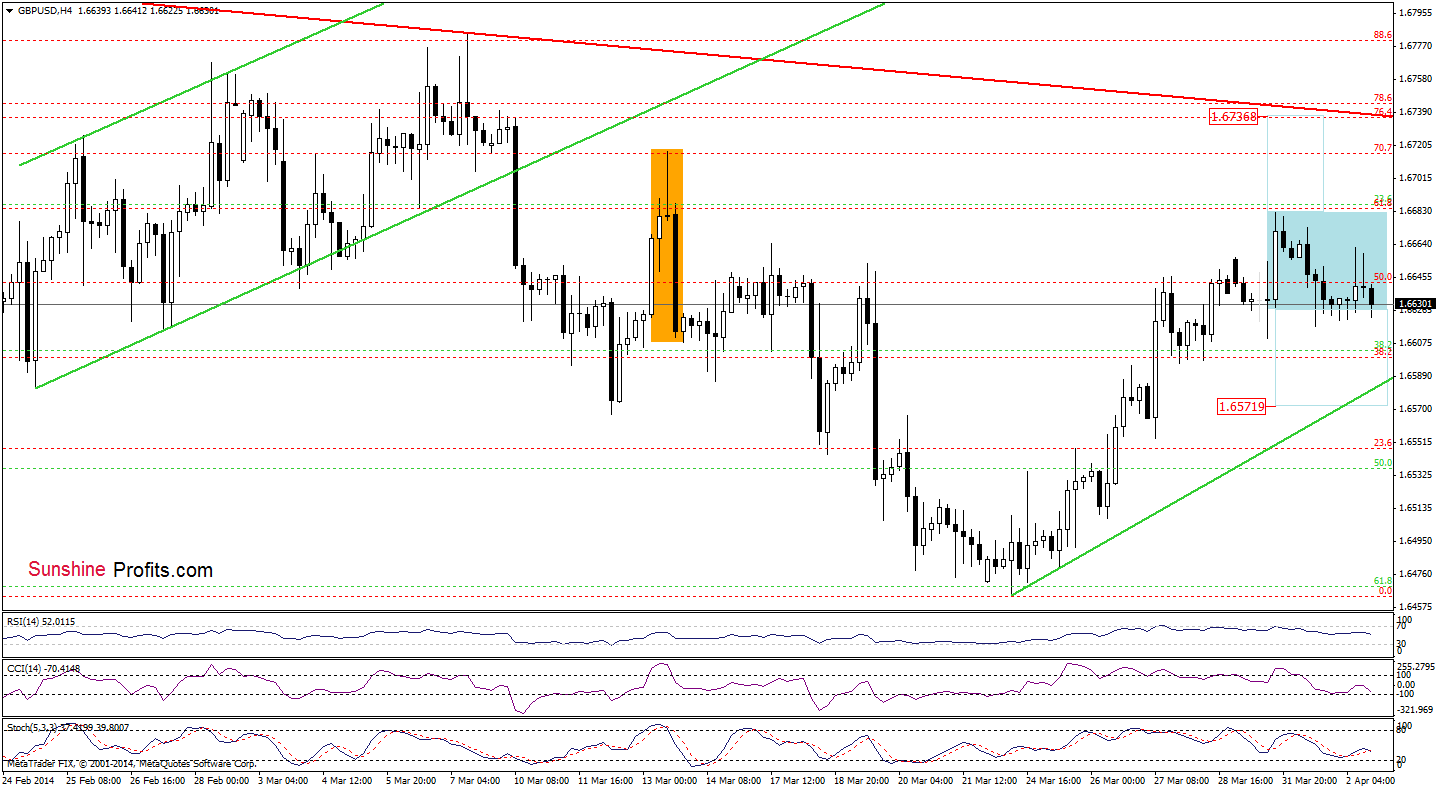
From this perspective, we see that if the sellers successfully push GBP/USD below Monday’s low of 1.6611, we may see further deterioration and the first downside target would be the green very short-term rising support line (currently at 1.6581).
Very short-term outlook: mixed with bearish bias
Short-term outlook: mixed
MT outlook: mixed
LT outlook: mixed
Trading position (short-term): In our opinion no positions are justified from the risk/reward perspective at the moment. We will keep you informed should anything change, or should we see a confirmation/invalidation of the above.
USD/JPY
Quoting our last Forex Trading Alert:
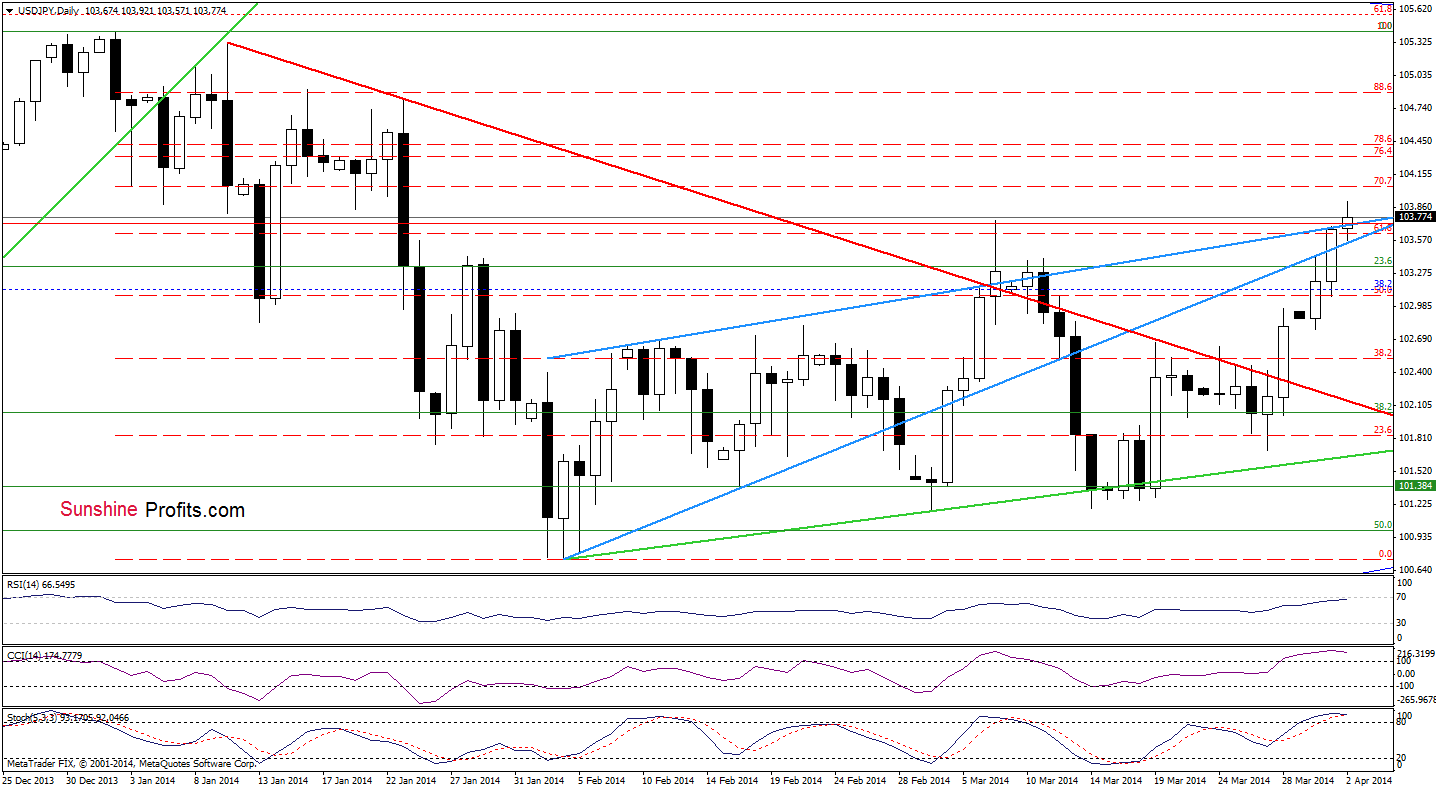
(…) USD/JPY extended gains and (…) climbed to the previously-broken lower line of the blue rising wedge. (…), if it is broken, we may see an increase to a strong resistance zone created by the 61.8% Fibonacci retracement, the upper line of the blue rising wedge and the March 7 high.
As you see on the above chart, the pair climbed once again and not only reached , but also temporarily broke above the resistance zone earlier today, which is a bullish signal. However, despite this improvement, we should keep in mind that the proximity to the 70.7% Fibonacci retracement (the next upside target for the buyers) in combination with the current position of the indicators (the RSI approached the level of 70, while the CCI and Stochastic Oscillator are overbought) may trigger a correction in the coming days – especially if the indicators generate sell signals.
Very short-term outlook: mixed
Short-term outlook: mixed
MT outlook: bullish
LT outlook: bearish
Trading position (short-term): In our opinion no positions are justified from the risk/reward perspective at the moment. We will keep you informed should anything change, or should we see a confirmation/invalidation of the above.
USD/CAD
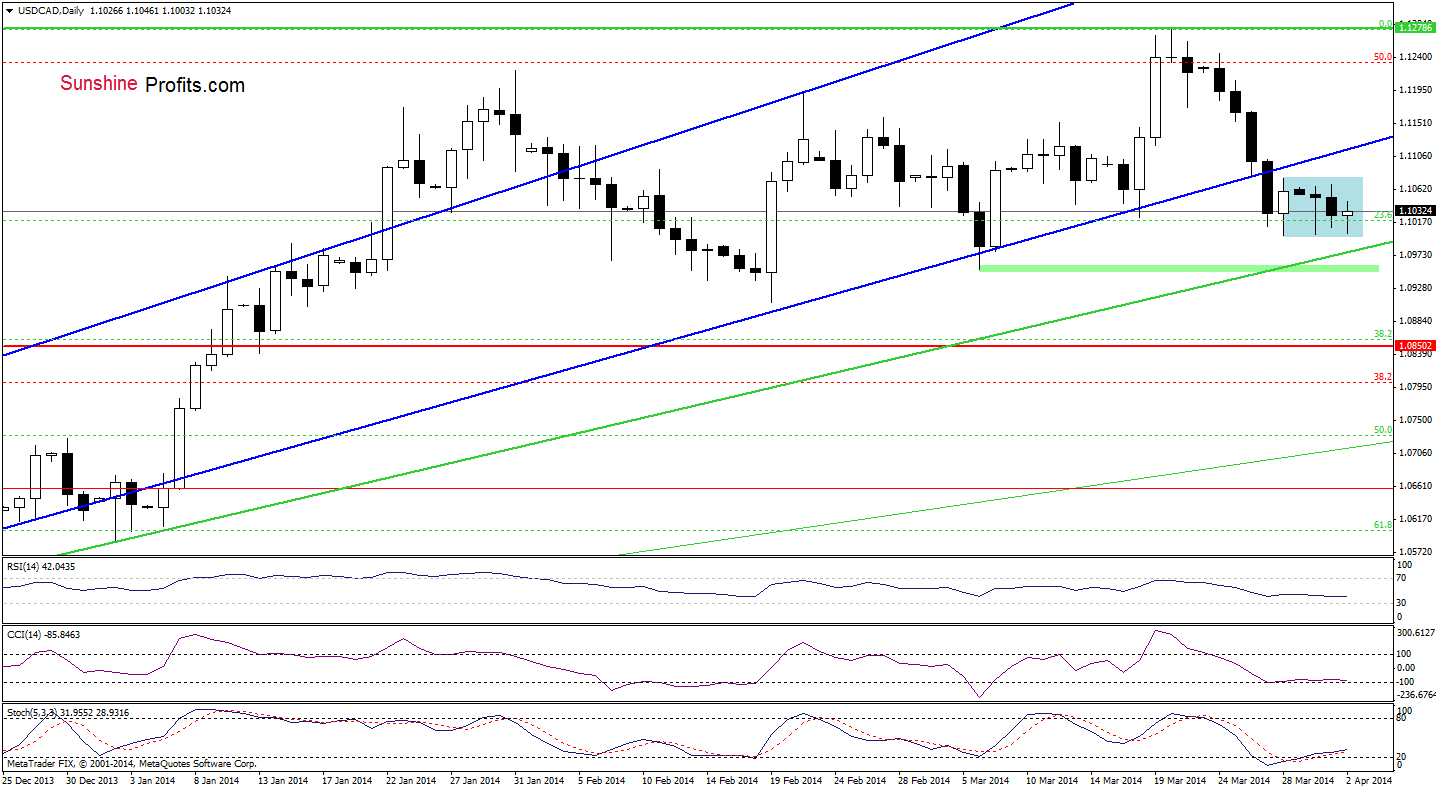
As you see on the above chart, the situation hasn’t changed much as USD/CAD remains in a consolidation between Friday’s high and low. Therefore, what we wrote in our last Forex Trading Alert is still up-to-date.
(…) If the pair extends gains, we will likely see another attempt to reach the previously-broken lower border of the rising trend channel. Please note that even if the exchange rate drops below Friday’s low, the medium-term green support line will likely stop further deterioration. At this point, it’s worth noting that the CCI and Stochastic Oscillator generated buy signals, which reinforces a pro growth scenario.
Very short-term outlook: mixed with bullish bias
Short-term outlook: mixed
MT outlook: bullish
LT outlook: bearish
Trading position (short-term): In our opinion no positions are justified from the risk/reward perspective. We will keep you informed should anything change, or should we see a confirmation/invalidation of the above.
USD/CHF
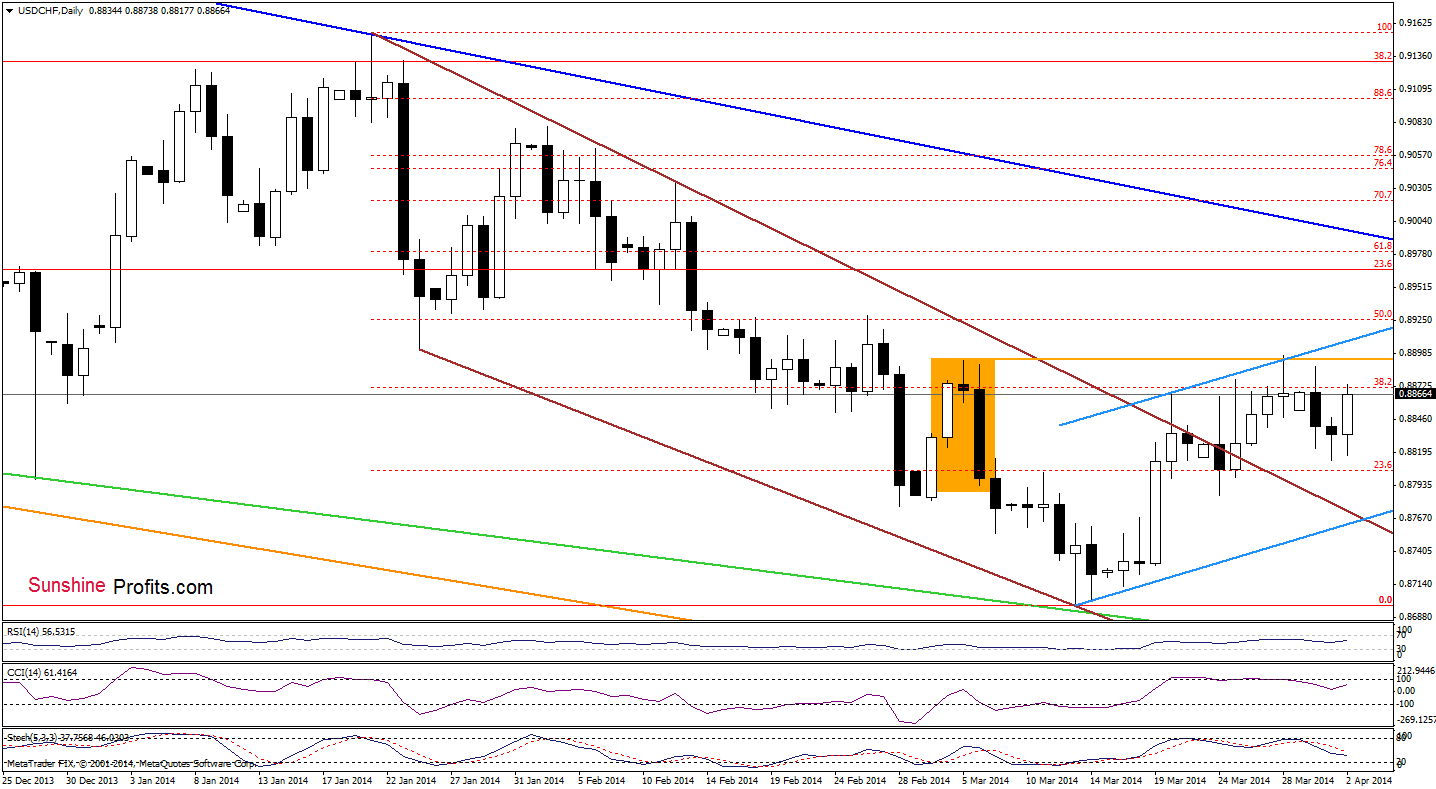
As you see on the above chart, USD/CHF reversed after yesterday’s decline and climbed to the 38.2% Fibonacci retracement once again. If this resistance level encourages sellers to act, we may see another pullback in the coming day (or days). However, if it is broken, we will likely see another attempt to move above 0.8894 and invalidate a negative impact of a bearish candlestick pattern on the exchange rate.
Before we summarize this currency pair, let’s take a look at the 4-hour chart.
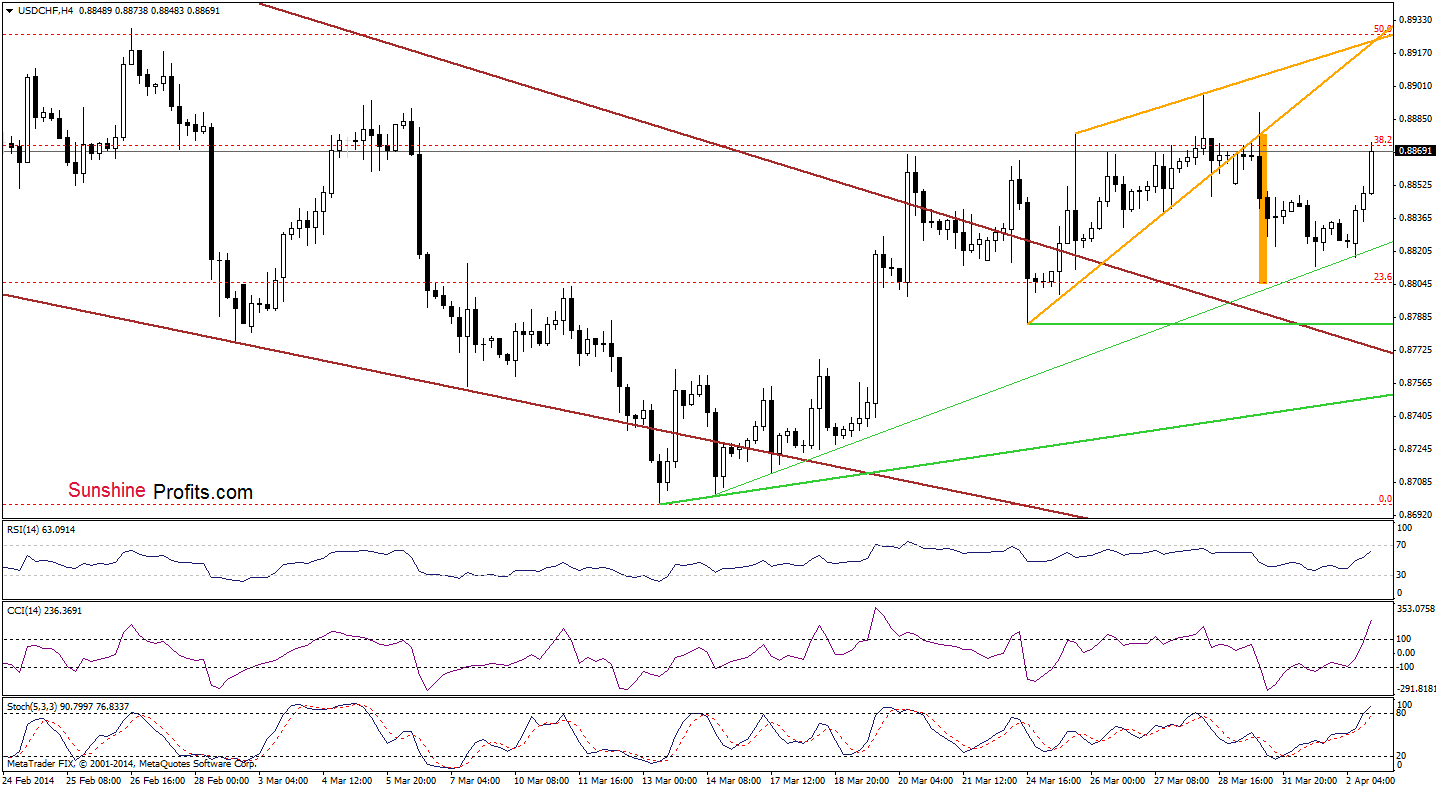
From this perspective, we see that the exchange rate almost touched the very short-term support line (marked with green) yesterday. Earlier today, we saw a re-test of the strength of this support, but the sellers didn’t manage to push the exchange rate below it, which triggered a corrective upswing in the following hours. As you see on the above chart, the CCI and Stochastic Oscillator are overbought, which suggests that we may see a pullback later in the day. If this is the case, it seems that the downside target for the sellers will be the very short-term support line once again (currently around 0.8821).
Very short-term outlook: mixed
Short-term outlook: mixed
MT outlook: bearish
LT outlook: bearish
Trading position (short-term): In our opinion no positions are justified from the risk/reward perspective. We will keep you informed should anything change, or should we see a confirmation/invalidation of the above.
AUD/USD
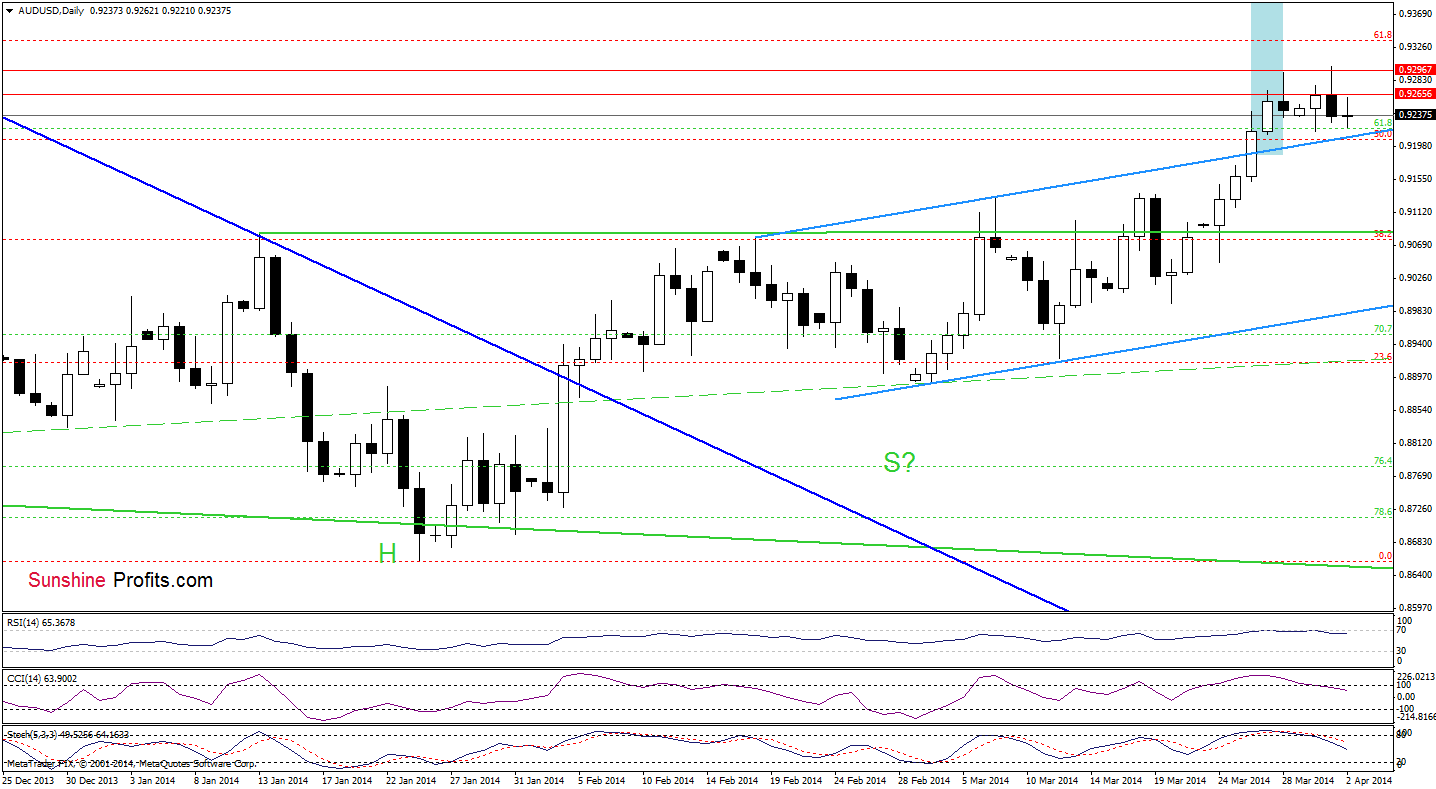
Looking at the above chart, we see that the situation hasn’t changed much as AUD/USD remains between a resistance zone created by lows from mid-November and the previously-broken upper line of the trend channel. From this perspective, it seems that as long as the pair remains in this narrow range, we won’t see a bigger upswing or downswing. Nevertheless, we should keep in mind that all sell signals remain in place, which suggests that we may see an attempt to move lower in the coming days. If this is the case, the first downside target will be around March 7 high (0.9132).
Very short-term outlook: mixed with bearish bias
Short-term outlook: bullish
MT outlook: bearish
LT outlook: bearish
Trading position (short-term; our opinion): In our opinion no positions are justified from the risk/reward perspective at the moment. However, if the pair drops below the upper line of the trend channel, we will consider opening short positions. We will keep you informed should anything change, or should we see a confirmation/invalidation of the above.
Thank you.
Nadia Simmons
Forex & Oil Trading Strategist
Forex Trading Alerts
Oil Investment Updates
Oil Trading Alerts

