
Earlier today, the U.S. dollar dropped after disappointing U.S. manufacturing activity data. The Federal Reserve Bank of New York said that its Empire State manufacturing index moved higher to 5.6 this month, from a reading of 4.5 in February, missing expectations for a rise to 6. Although today’s data also showed that U.S. industrial production rose 0.6% in February (beating expectations for a 0.1% increase), the greenback extended losses and approached its monthly low once again. What impact did it have on major currency pairs? If you want to know our take on this question, we invite you to read our today's Forex Trading Alert.
In our opinion the following forex trading positions are justified - summary:
- EUR/USD: short (stop-loss order: 1.4008)
- GBP/USD: none
- USD/JPY: none
- USD/CAD: none
- USD/CHF: none
- AUD/USD: none
EUR/USD
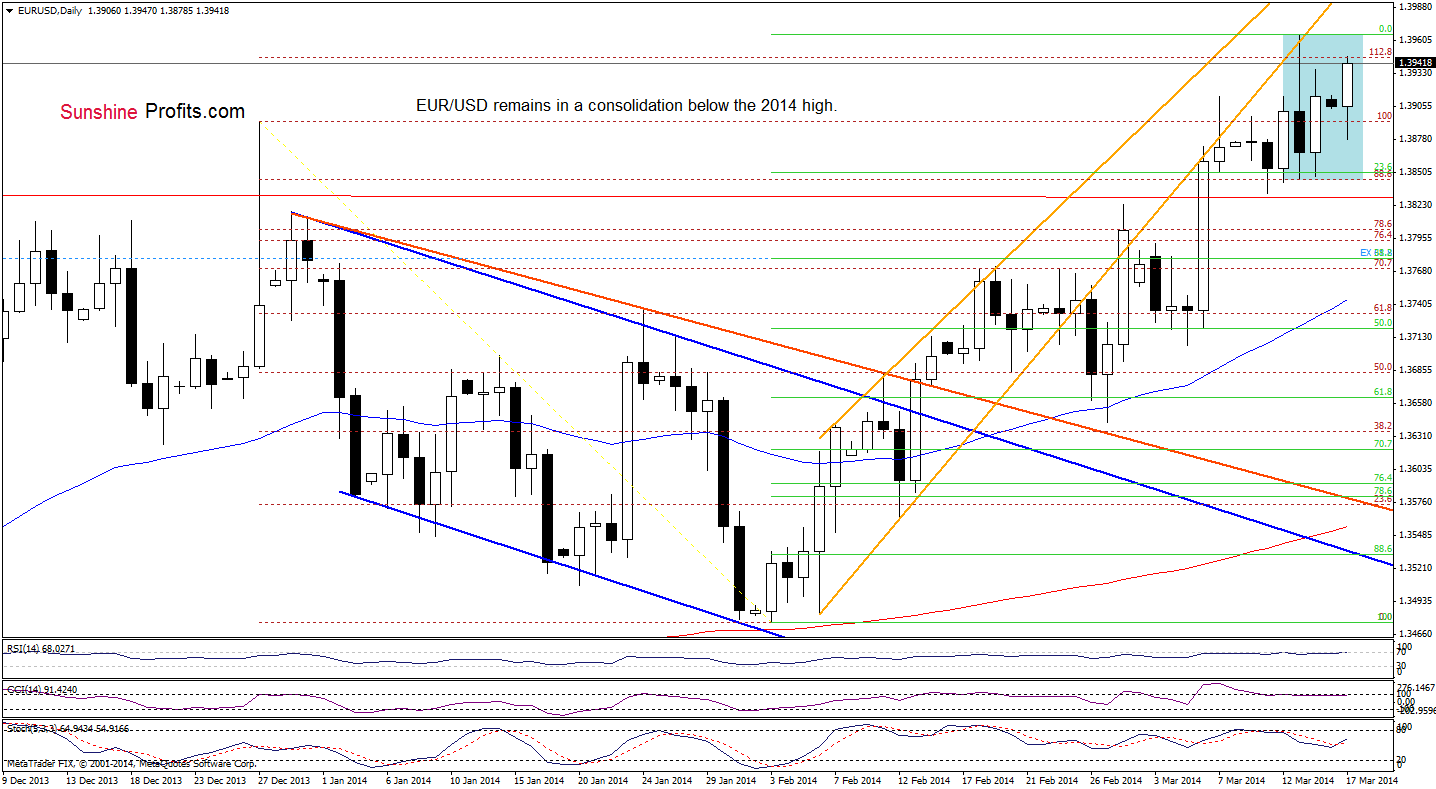
As you see on the above chart, although EUR/USD rebounded earlier today, the exchange rate still remains between Thursday high and low. From this perspective, it seems that even if the exchange rate extends gains, the orange resistance line will stop (or at least pause) further improvement. Please note that sell signals generated by the RSI and CCI still favor sellers.
Very short-term outlook: mixed
Short-term outlook: mixed with bearish bias
MT outlook: mixed
LT outlook: bearish
Trading position (short-term) in our opinion: Short. Stop-loss order: 1.4008. We will keep you informed should anything change as far as our opinion is concerned, or should we see a confirmation/invalidation of the above. The above is not an investment / trading advice and please note that trading (especially using leveraged instruments such as futures or on the forex market) involves risk.
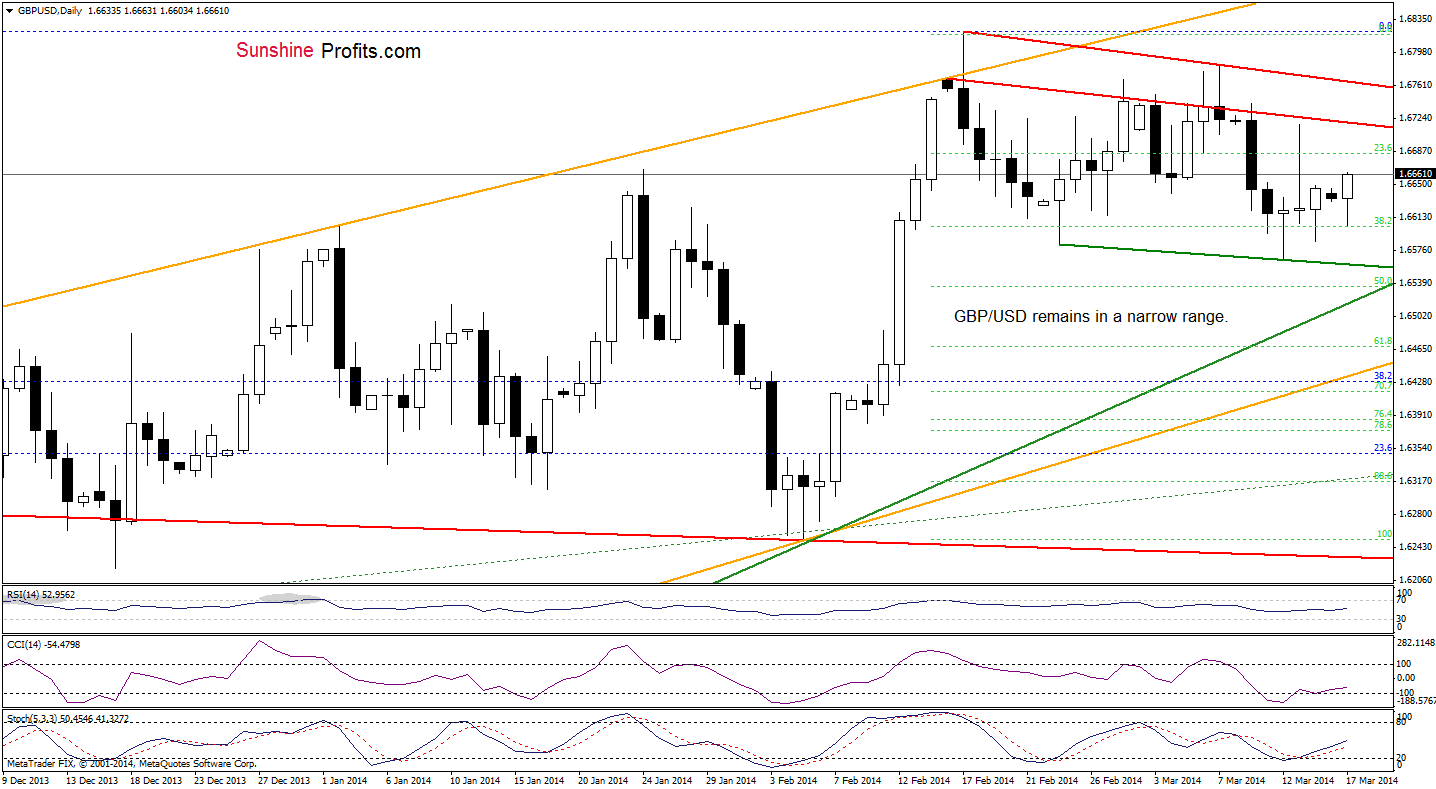
GBP/USD
In our last Forex Trading Alert, we wrote the following:
(…) GBP/USD declined to the 38.2% Fibonacci retracement. If this support level encourages buyers to act, we may see another corrective upswing in the coming day (or days). If it is broken, the next downside target will be the green support line based on the Feb.24 and yesterday’s lows.
Looking at the daily chart, we see that the exchange rate rebounded earlier today. However, despite this increase, the pair still remains below both red resistance lines, which serve as major resistance at the moment. From this perspective, as long as GBP/USD remains below these lines, a bigger upswing is not likely to be seen.
Very short-term outlook: mixed
Short-term outlook: mixed
MT outlook: mixed
LT outlook: mixed
Trading position (short-term): In our opinion no positions are justified from the risk/reward perspective at the moment. We will keep you informed should anything change, or should we see a confirmation/invalidation of the above.
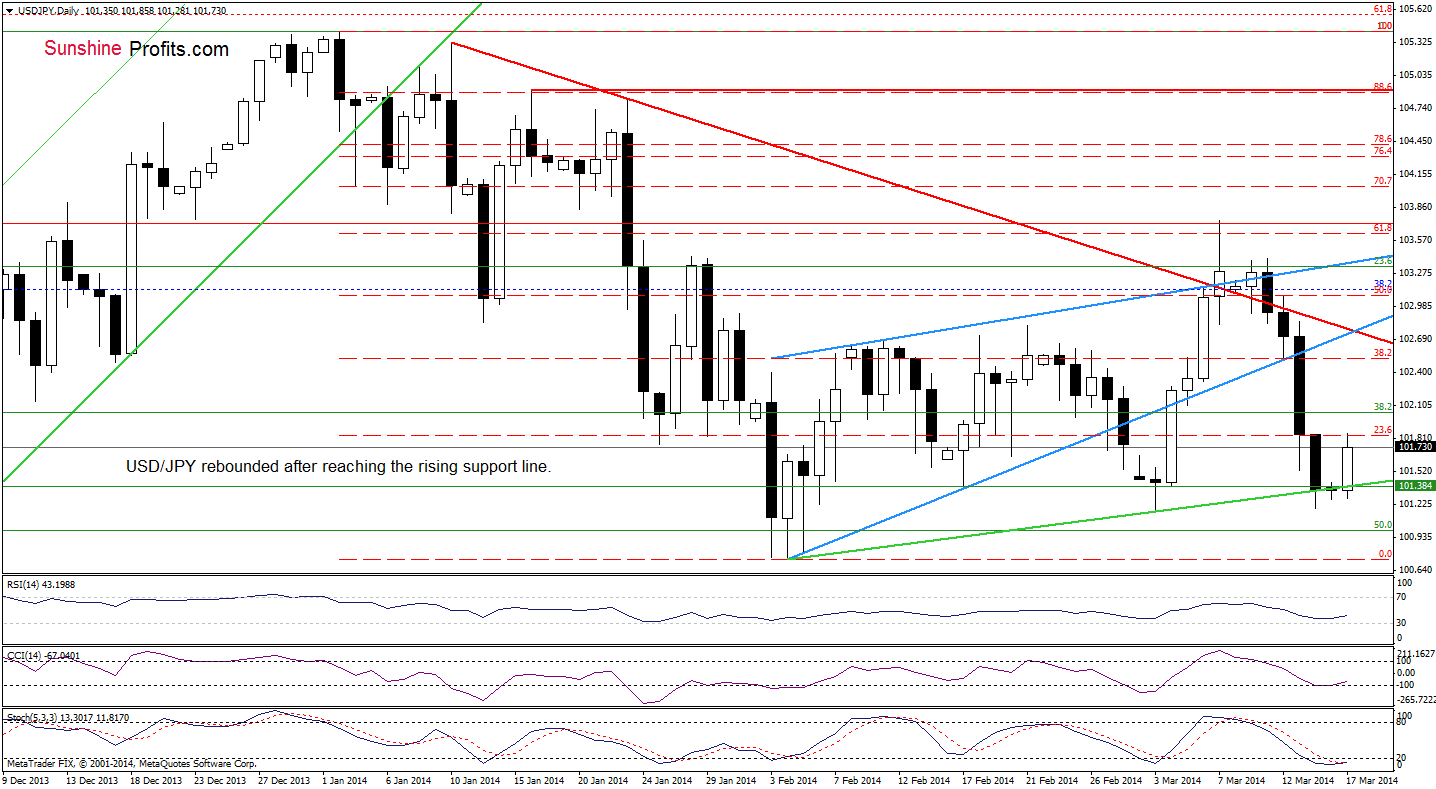
USD/JPY
Quoting our last Forex Trading Alert:
(…) USD/JPY reached the green support line. If it encourages buyers to act, we will likely see a corrective upswing in the coming day (or days). However, if it is broken, the next downside target will be the February low. When we take a closer look at the position of the indicators, we see that they still support sellers.
As you see on the above chart, the exchange rate rebounded earlier today and reached Friday high. If the pair climbs higher, the next upside target for the buyers will be around 102.16, where the 38.2% Fibonacci retracement level based on the recent decline is (you can see the current situation more clearly on the 4-hour chart below).
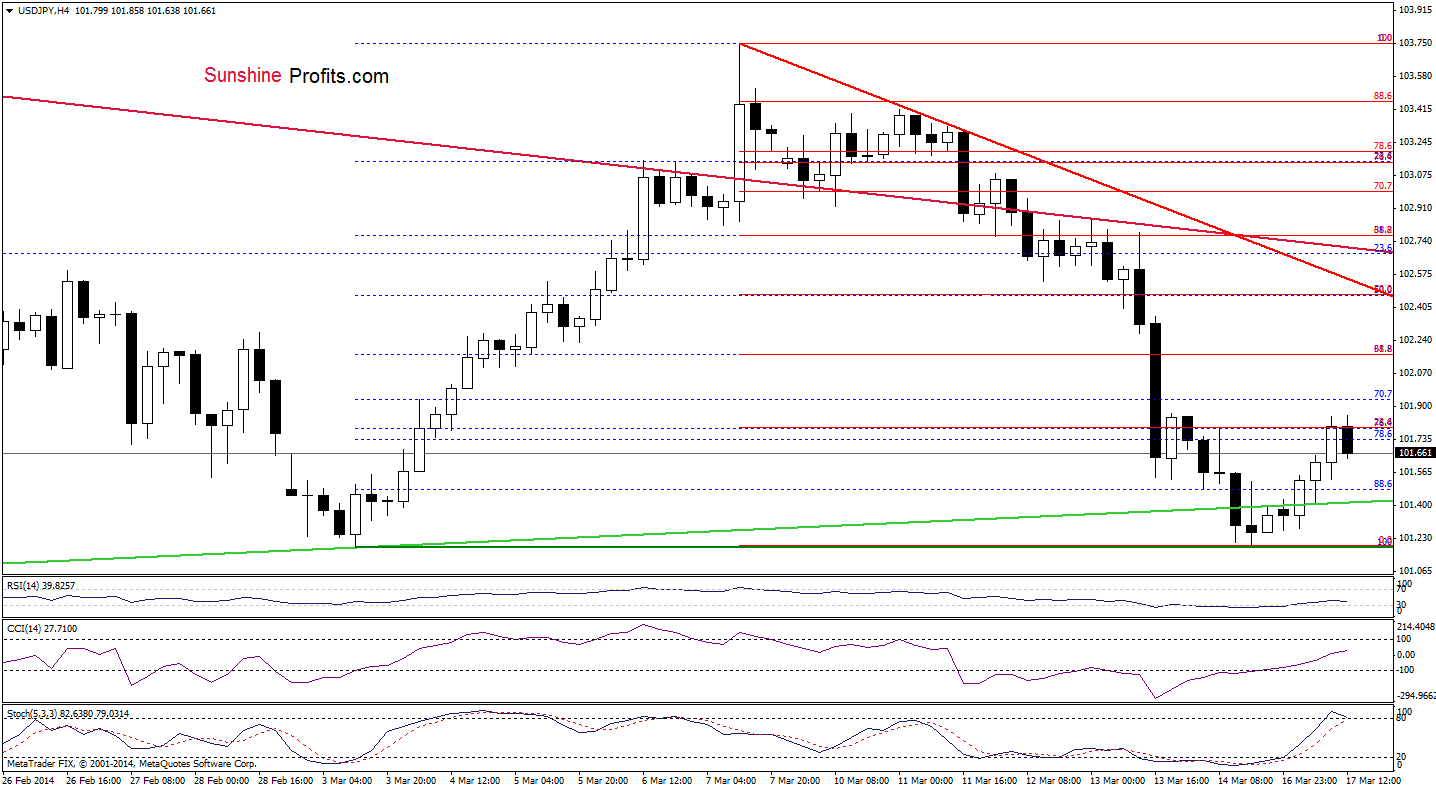
From this perspective, we see that the pair reached the 23.6% Fibonacci retracement level based on the recent decline. So far, this resistance level encouraged sellers to act and USD/JPY declined slightly. Despite this drop, the exchange rate still remains above the green support line and also above the March low. Therefore, if the buyers do not give up, we may see further improvement. Nevertheless, if they fail, we will likely see another drop to the support line (or even to the monthly low).
Very short-term outlook: bearish
Short-term outlook: mixed
MT outlook: bullish
LT outlook: bearish
Trading position (short-term): In our opinion no positions are justified from the risk/reward perspective at the moment. We will keep you informed should anything change, or should we see a confirmation/invalidation of the above.
USD/CAD
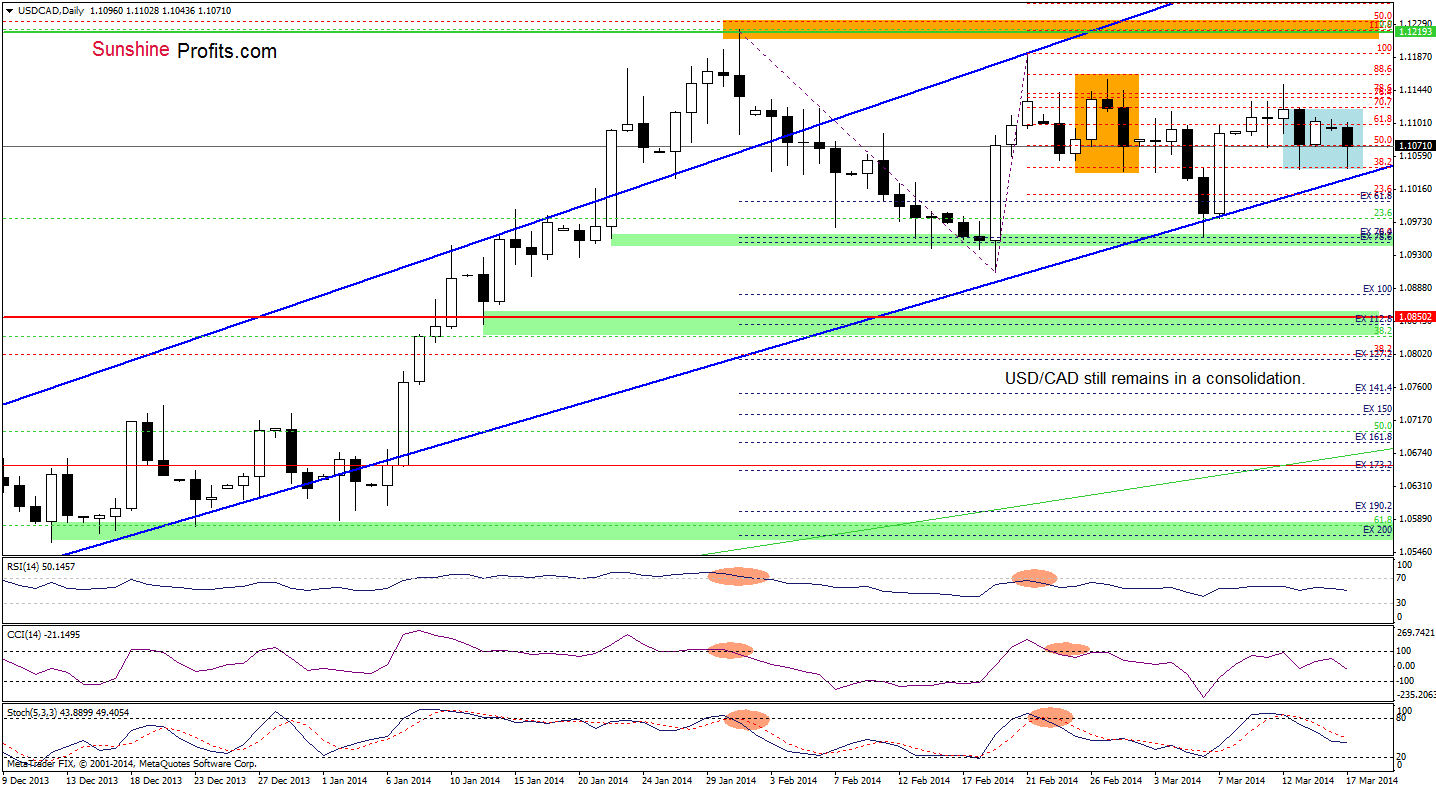
Looking at the daily chart, we see that the situation hasn’t changed much as USD/CHF still remains between Thursday high and low. So, what we wrote in our previous Forex Trading Alert is still valid.
(…) all indicators reversed and the CCI and Stochastic Oscillator generated sell signals, which suggests further deterioration. In this case, the first downside target will be the lower border of the rising trend channel (currently around 1.1009).
Very short-term outlook: mixed with bearish bias
Short-term outlook: mixed
MT outlook: bullish
LT outlook: bearish
Trading position (short-term): In our opinion no positions are justified from the risk/reward perspective. We will keep you informed should anything change, or should we see a confirmation/invalidation of the above.
USD/CHF
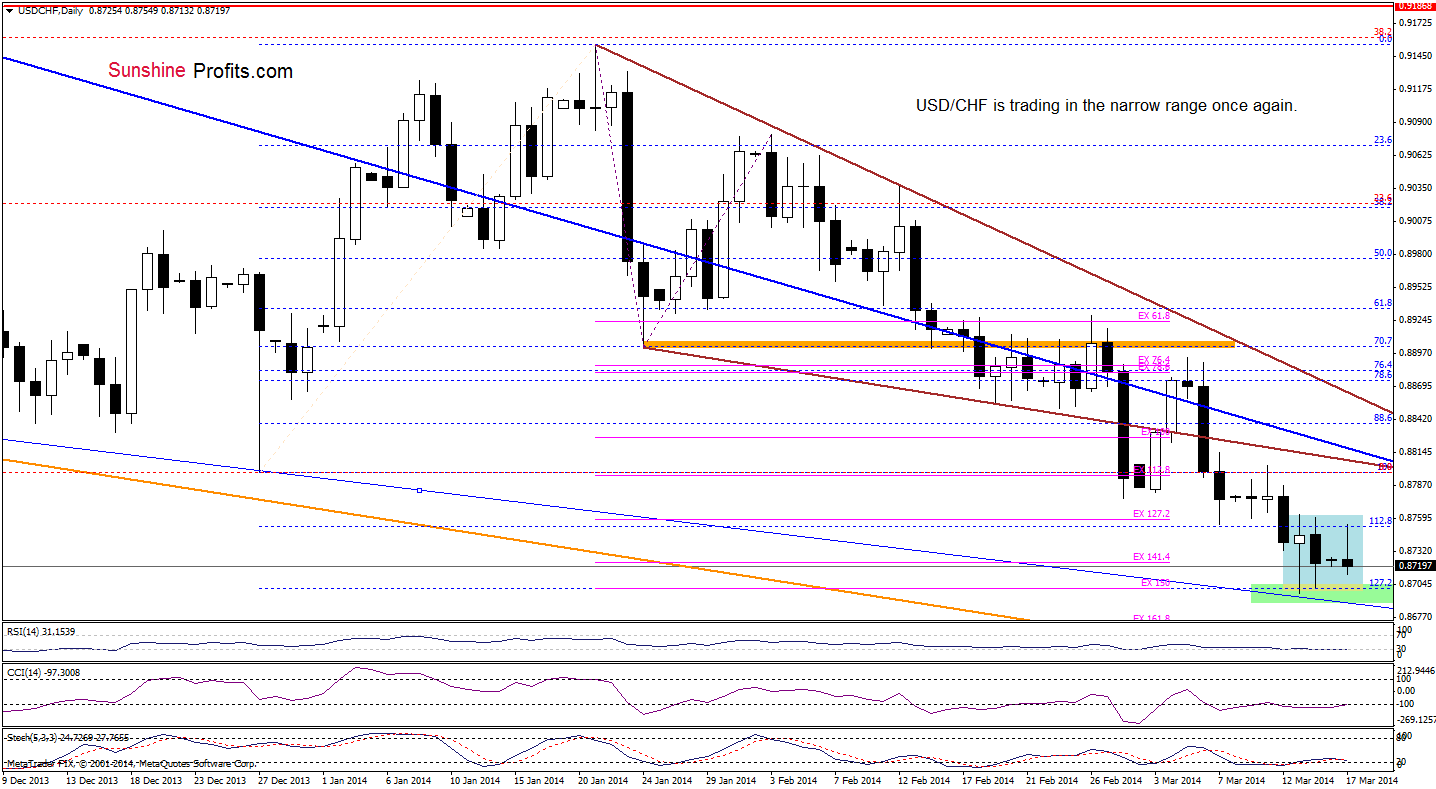
Looking at the above chart, we see that the situation hasn’t changed much as USD/CHF remains between Thursday high and low. Therefore, what we wrote in our last Forex Trading Alert is still up-to-date.
(…) sellers (…) reached the support zone. If this area encourage buyers to act, we will likely see a corrective upswing in the coming day (or days). However, if it is broken, the next downside target will be around 0.8671, where the 161.8% Fibonacci projection is. The position of the indicators hasn’t changed much. Although there is a positive divergence between the CCI and the exchange rate, the Stochastic Oscillator is oversold and the RSI slipped to its lowest level since the beginning of the month.
Very short-term outlook: mixed with bearish bias
Short-term outlook: bearish
MT outlook: bearish
LT outlook: bearish
Trading position (short-term): In our opinion, the space for further declines seems limited, so opening short positions at the moment is not a good idea. We will keep you informed should anything change, or should we see a confirmation/invalidation of the above.
AUD/USD
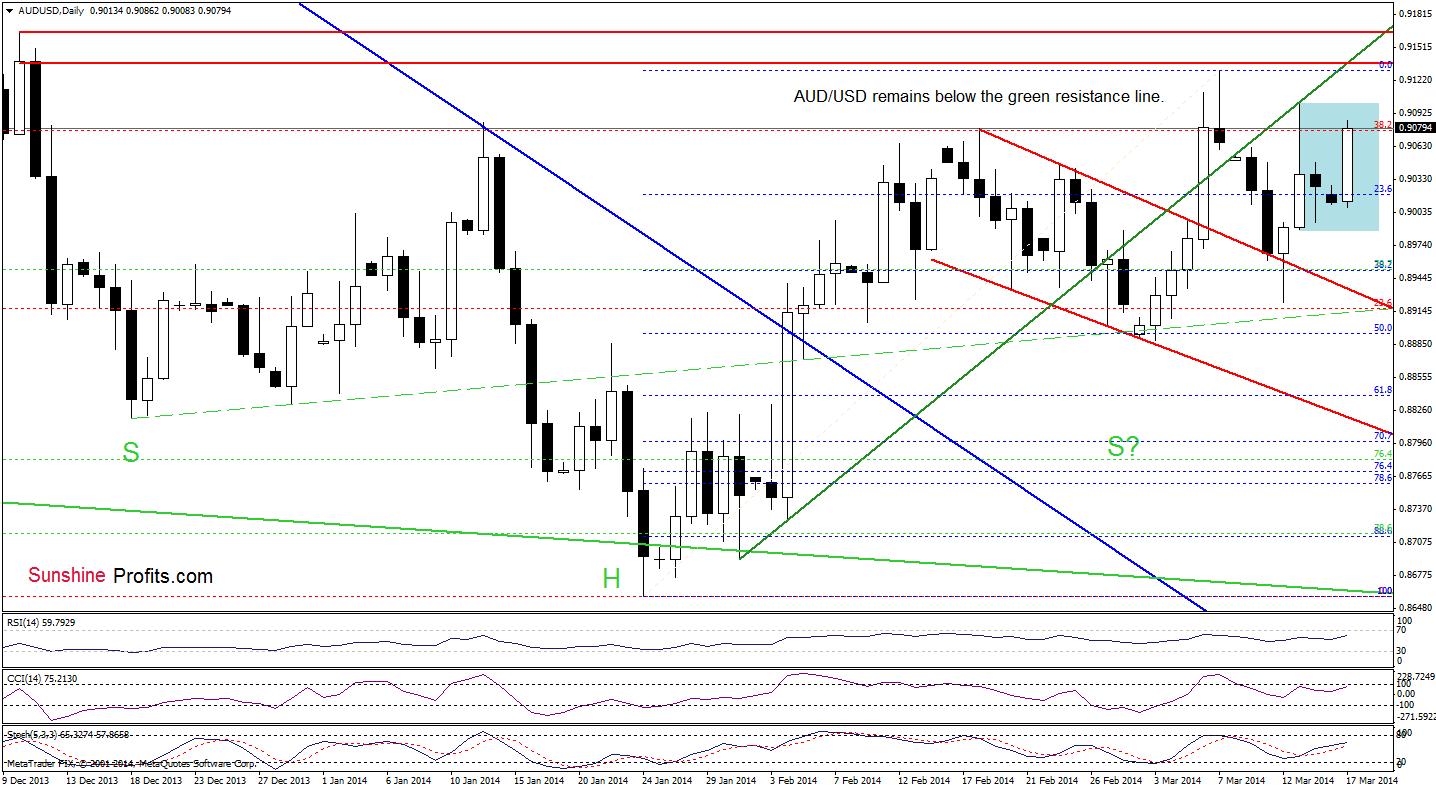
As you see on the above chart, after Friday’s drop below the 23.6% Fibonacci retracement, AUD/USD rebounded sharply earlier today. Although the exchange rate approached Wednesday high, it still remains in a consolidation. From this perspective, it seems that even if the pair breaks above the upper line of the consolidation, the green resistance line (which currently corresponds to the 2014 high) will likely to further improvement – similarly to what we saw on Wednesday.
Very short-term outlook: mixed
Short-term outlook: bullish
MT outlook: bearish
LT outlook: bearish
Trading position (short-term): In our opinion no positions are justified from the risk/reward perspective at the moment. We will keep you informed should anything change, or should we see a confirmation/invalidation of the above.
Thank you.
Nadia Simmons
Forex & Oil Trading Strategist
Forex Trading Alerts
Oil Investment Updates
Oil Trading Alerts

