
The U.S. dollar erased some losses against major currencies after stronger-than-expected U.S. employment data, which showed that the economy added 175,000 jobs in February (well above expectations for a 149,000 increase). Additionally, the U.S. private sector added 162,000 jobs last month (beating expectations for a 154,000 rise). What impact did it have on major currency pairs? What is their current outlook? If you want to know our take on this question, we invite you to read our today's Forex Trading Alert.
In our opinion the following forex trading positions are justified - summary:
EUR/USD
In our last Forex Trading Alert, we wrote:
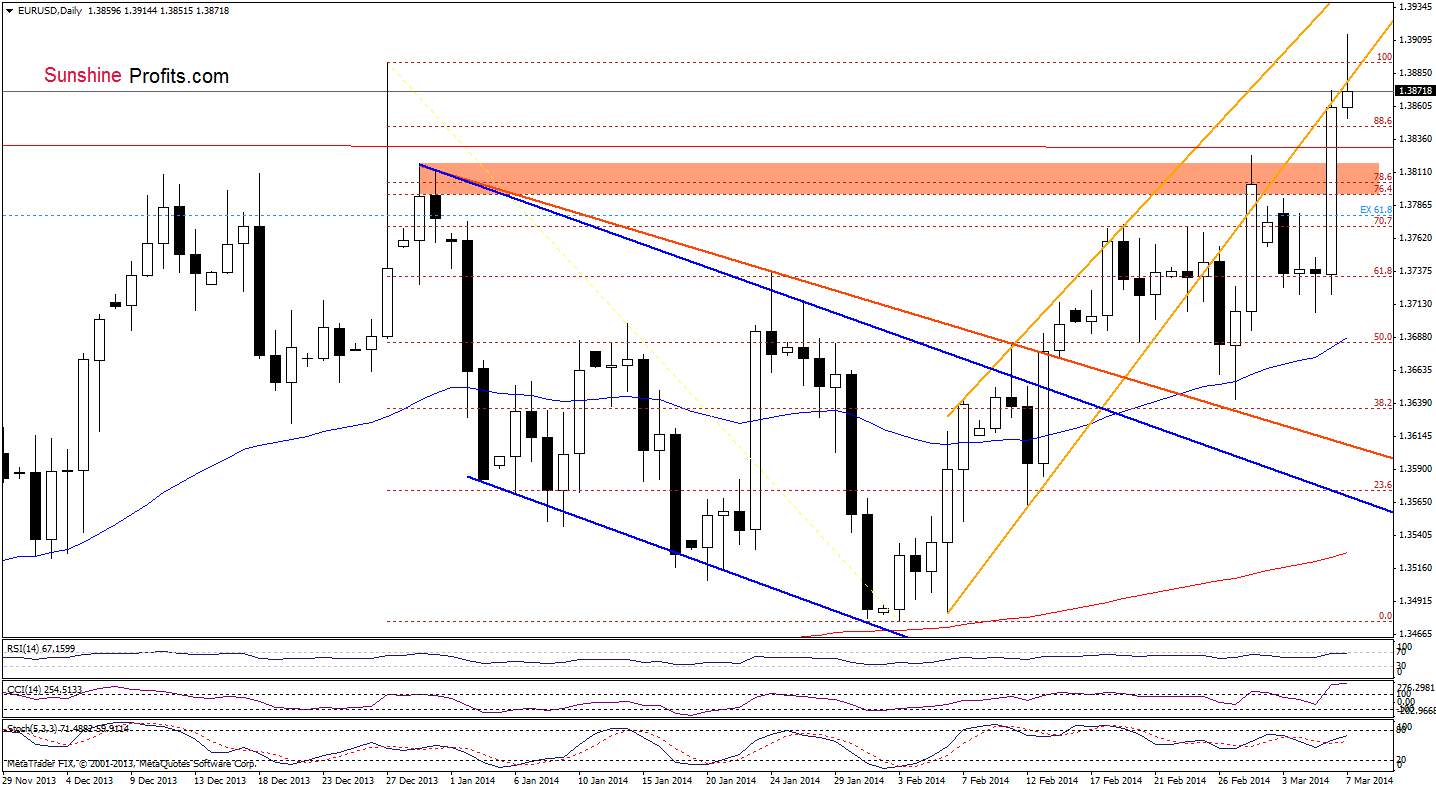
(…) EUR/USD (…) reached the lower border of the rising trend channel (marked with orange) (…) if it is broken, we may see an increase to the 2013 high (or even to the upper line of the trend channel).
As you see on the above chart, the pair extended gains and hit a fresh annual high. Despite this improvement, the exchange rate gave up the gains and slipped below the 2013 high and the lower border of the rising channel in the following hours. Nevertheless, as long as EUR/USD remains above the previous 204 high, another attempt to move higher can’t be ruled out. Looking at the current position of the indicators, we see that the RSI approached the level of 70, the CCI is still overbought and a sell signal generated by the Stochastic Oscillator remains in place (just like a negative divergence between the indicator and the exchange rate), which suggests that a correction is just around the corner.
Before we summarize this currency pair, let’s take a look at the 4-hour chart.
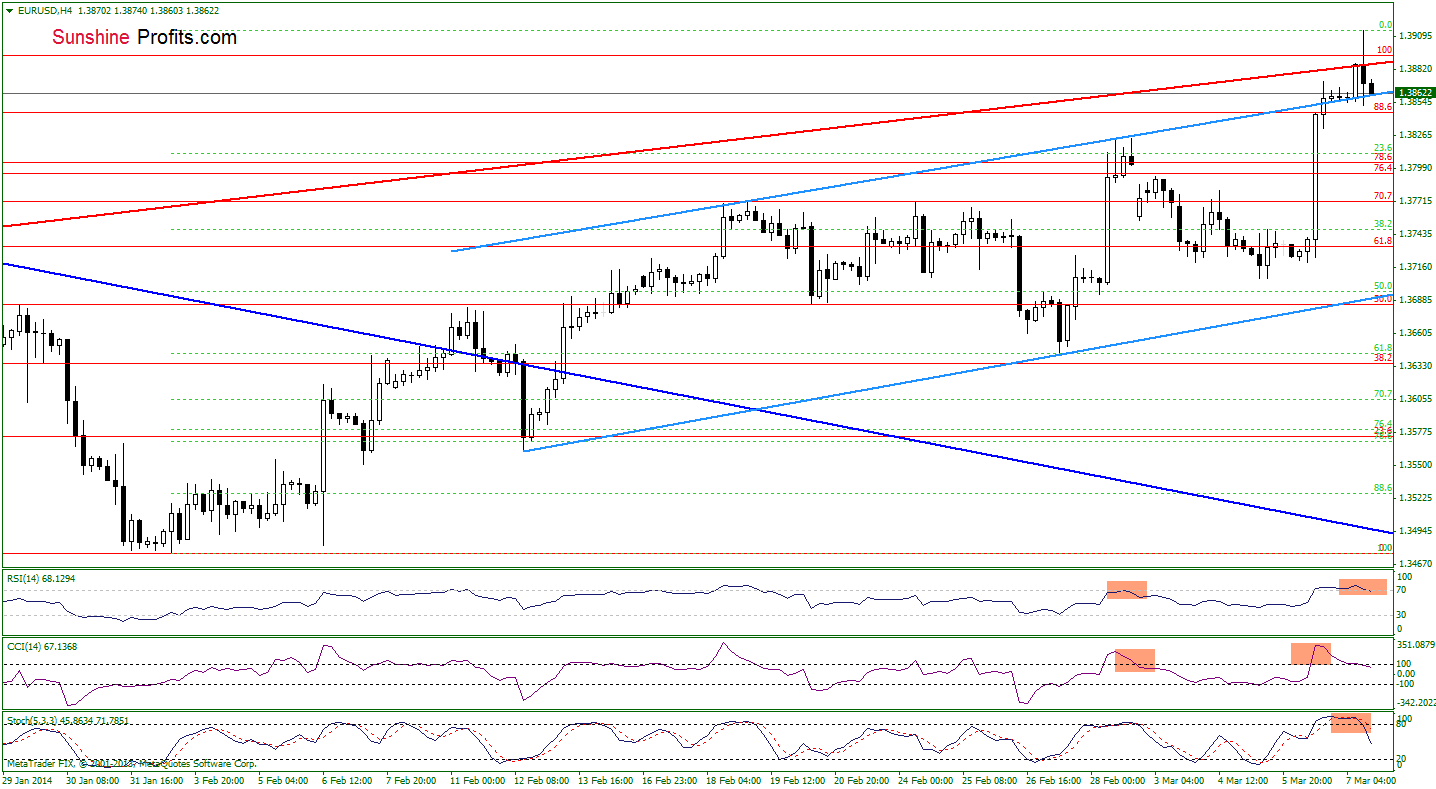
From this perspective, we see that although EUR/USD broke above the upper line of the rising trend channel (marked with blue), the pair reversed and dropped to this support line earlier today. At the same time, all indicators generated sell signals, which suggest that we may see further deterioration in the following hours. Please note that if the exchange rate declines below this important line, we will likely see a pullback to (at least) 23.6% Fibonacci retracement level based on the entire recent rally. If it is broken, the next downside target will be the 38.2% Fibonacci retracement around 1.3747.
Very short-term outlook: bullish
Short-term outlook: bullish
MT outlook: mixed
LT outlook: bearish
Trading position (short-term): In our opinion no positions are justified from the risk/reward perspective. We will keep you informed should anything change, or should we see a confirmation/invalidation of the above.
GBP/USD
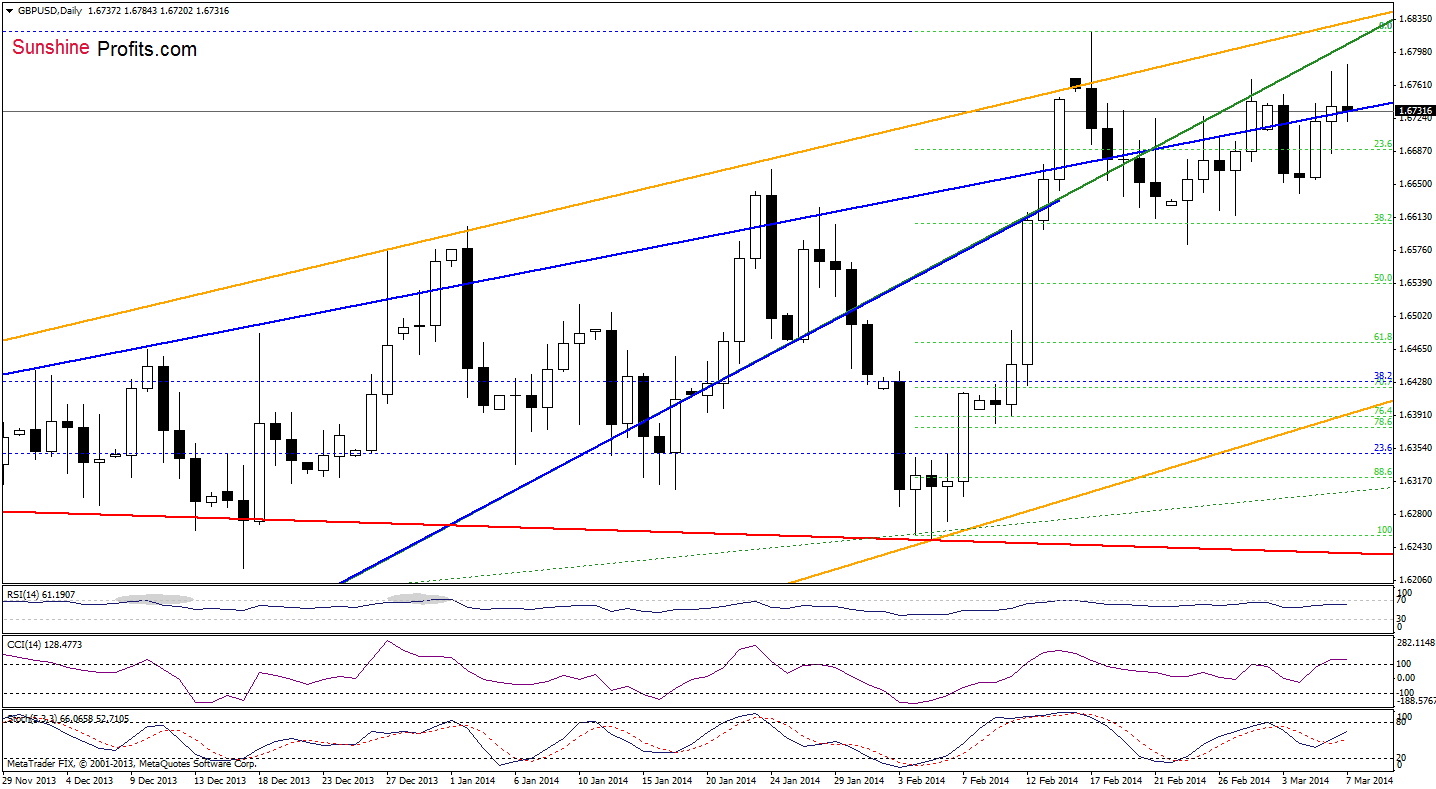
Looking at the above chart, we see that the situation hasn’t changed much as GBP/USD remains between the upper line of the rising wedge and the medium-term support/resistance green line, which serves as the nearest resistance at the moment. Therefore, we should keep in mind, what we wrote in our Forex Trading Alert (posted on Wednesday), discussing the situation in the 4-hour chart.
(…) we may see an upswing to the upper line of the rising channel (…) it seems that as long as there is no breakout above the upper line of this formation (or breakdown below the lower border) a bigger upswing (or downswing) is not likely to be seen.
To see this situation more clearly, let’s take a look at the 4-hour chart.
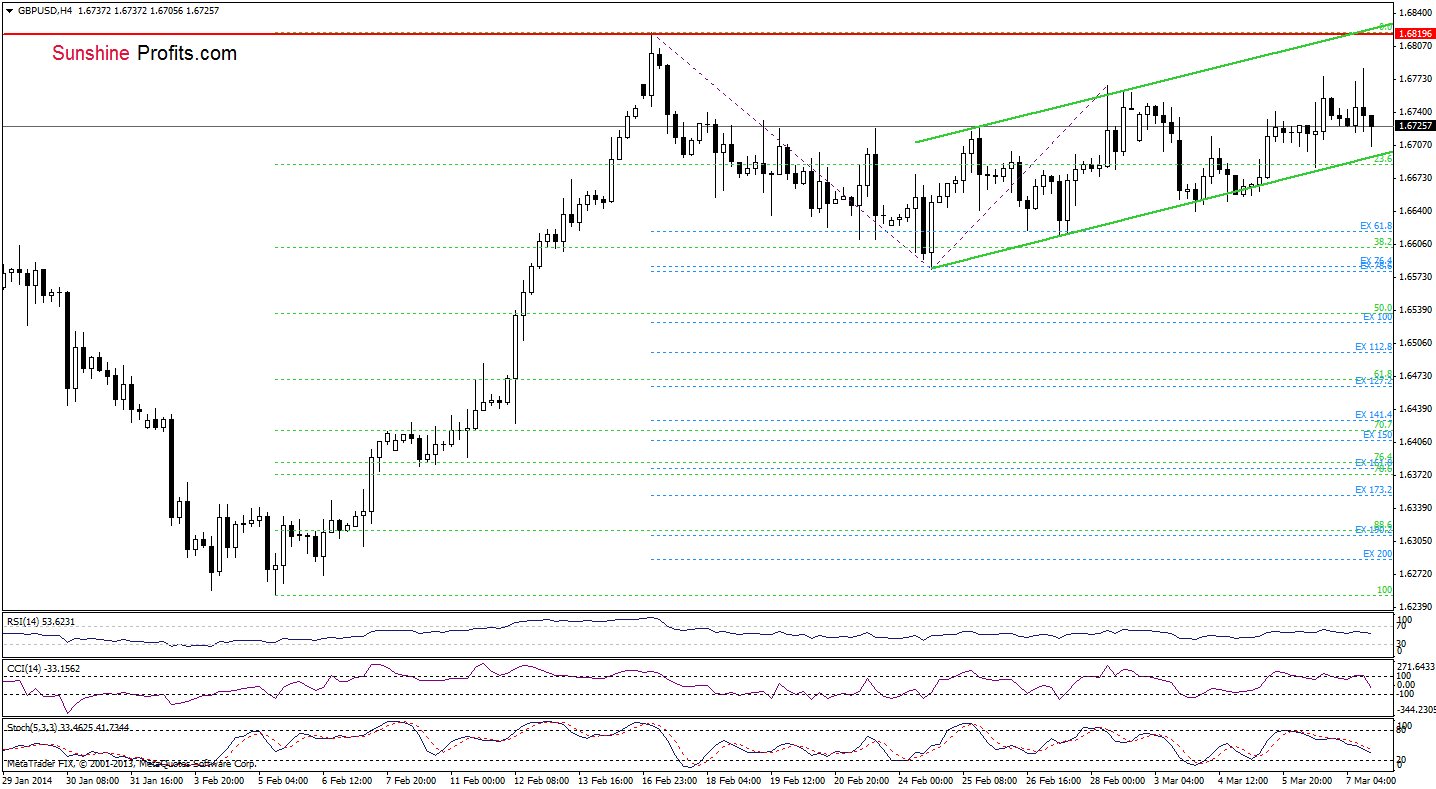
From this perspective, we see that sell signals generated by the indicators remain in place, therefore, if the pair declines below the lower line of the trend channel, we will likely see a drop to the March 4 low or even to the 38.2% Fibonacci retracement based on the recent rally.
Very short-term outlook: mixed
Short-term outlook: mixed
MT outlook: mixed
LT outlook: mixed
Trading position (short-term): In our opinion no positions are justified from the risk/reward perspective at the moment. We will keep you informed should anything change, or should we see a confirmation/invalidation of the above.
USD/JPY
Quoting our last Forex Trading Alert:
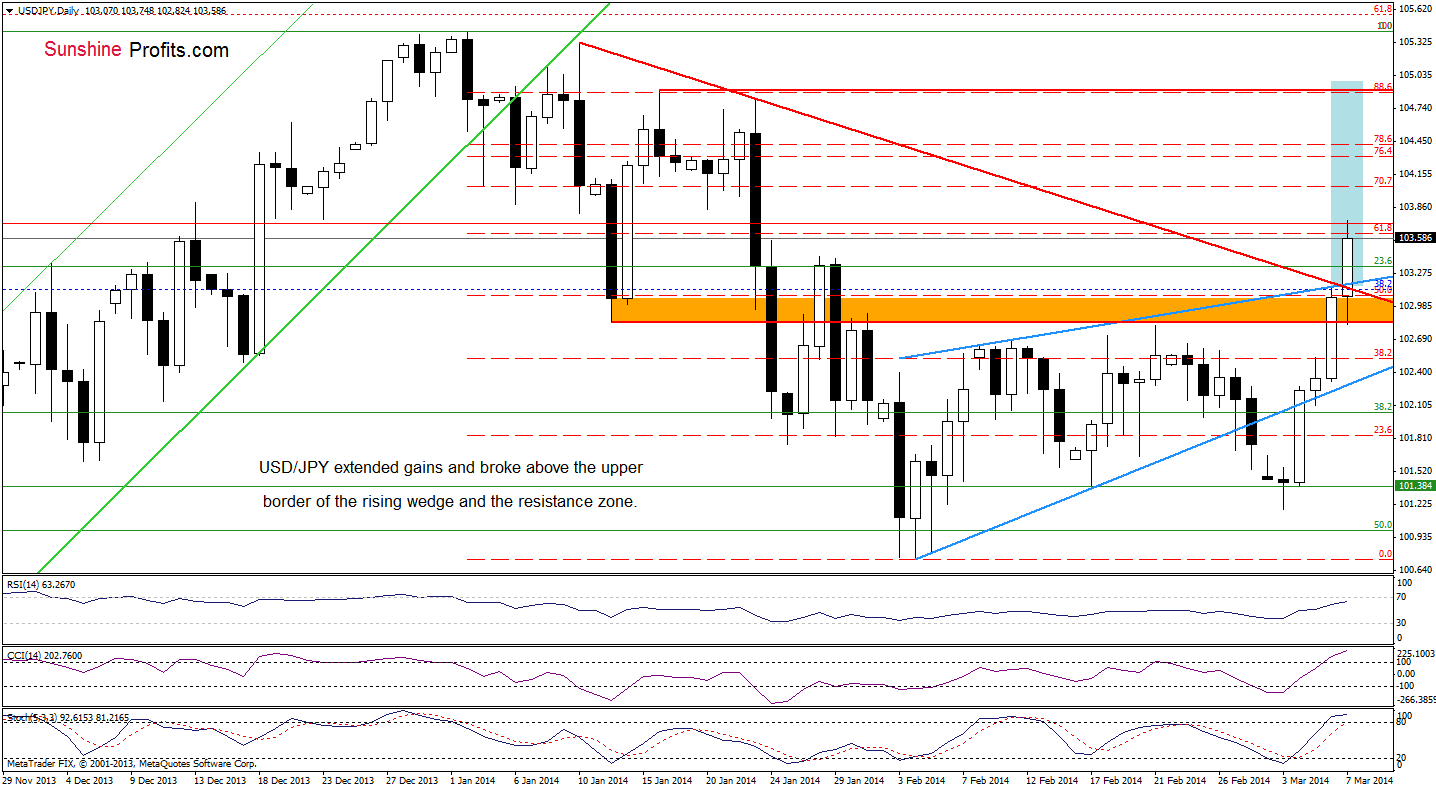
(…) the orange resistance zone is reinforced by the upper line of the rising wedge, the 50% Fibonacci retracement and the red declining resistance line. If this very strong resistance area encourages sellers to act, we will likely see a drop to the previously-broken Fibonacci retracement. However, if it is broke, we will likely see further improvement and an increase to (at least) the next Fibonacci retracement.
As you see on the above chart, we noticed such price action earlier today as USD/JPY extended gains and climbed to the 61.8% Fibonacci retracement level. At this point, it’s worth noting that the upside price target after a breakout above the rising wedge is around 104.96 (slightly above the 88.6% Fibonacci retracement and the Jan.16 high. Nevertheless, earlier this week we saw a drop below the lower border of the rising wedge and the downside target was not reached. Therefore, it seems justified to wait for a confirmation of the breakout before opening long positions. Additionally, the CCI and Stochastic Oscillator are overbought, which prescribe caution.
Very short-term outlook: bullish
Short-term outlook: mixed with bullish bias
MT outlook: bullish
LT outlook: bearish
Trading position (short-term): In our opinion, the situation is not enough bullish to go long at the moment. So, no positions are justified from the risk/reward perspective. We will keep you informed should anything change, or should we see a confirmation/invalidation of the above.
USD/CAD
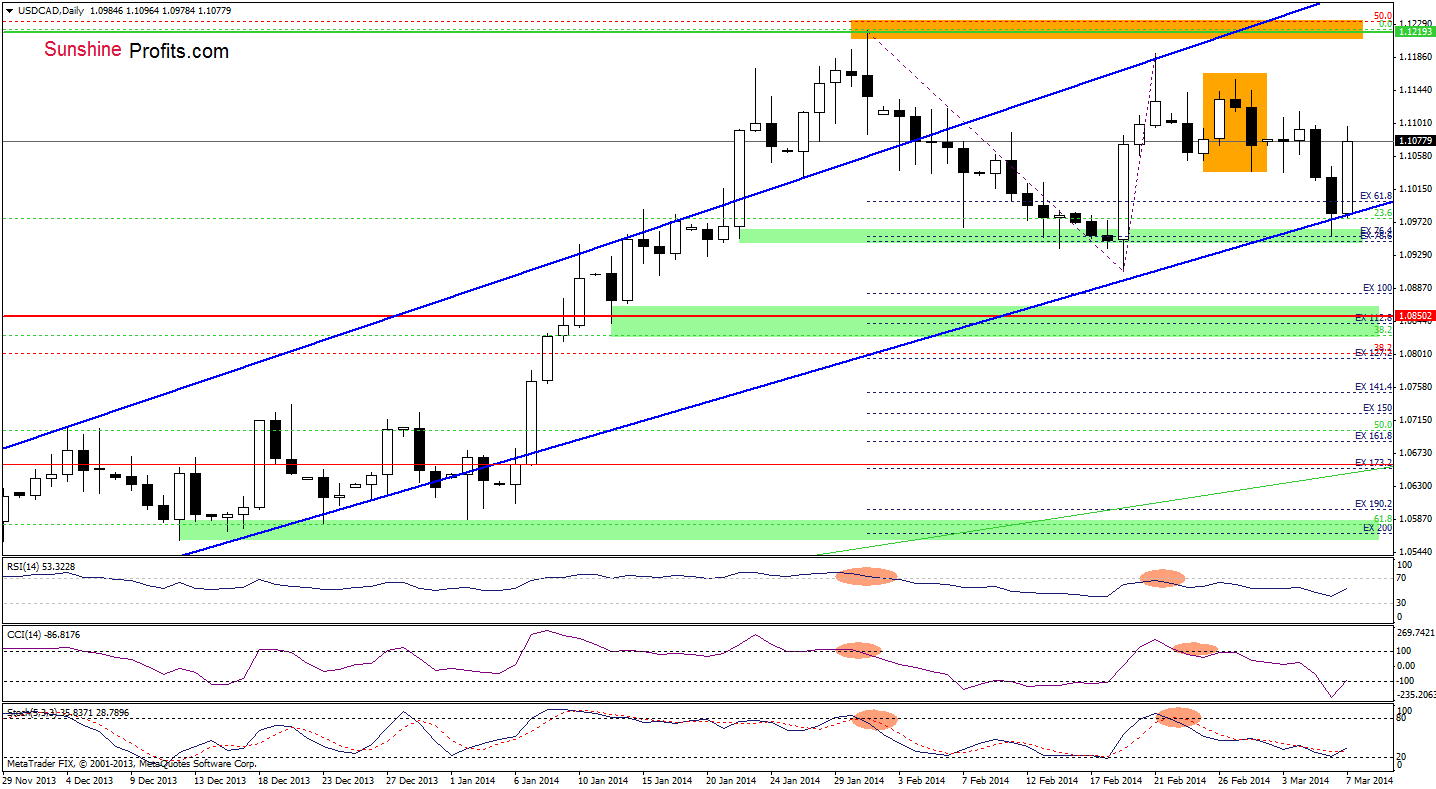
Looking at the above chart, we see that the lower border of the rising trend channel encouraged buyers to push the order button and the pair rebounded sharply earlier today. With this upswing, the exchange rate erased over 50% of earlier losses and it seems that we may see further improvement – especially when we factor in the current position of the indicators (the CCI and Stochastic Oscillator generated buy signals, which support buyers at the moment). If the buyers do not give up, we will likely see an increase to the March 3 high or even to the Feb.27 high (as a reminder this is also a top of a bearish candlestick pattern – an evening star) in the near future.
Very short-term outlook: bullish
Short-term outlook: mixed with bullish bias
MT outlook: bullish
LT outlook: bearish
Trading position (short-term): In our opinion no positions are justified from the risk/reward perspective. We will keep you informed should anything change, or should we see a confirmation/invalidation of the above.
USD/CHF
Quoting our previous Forex Trading Alert:
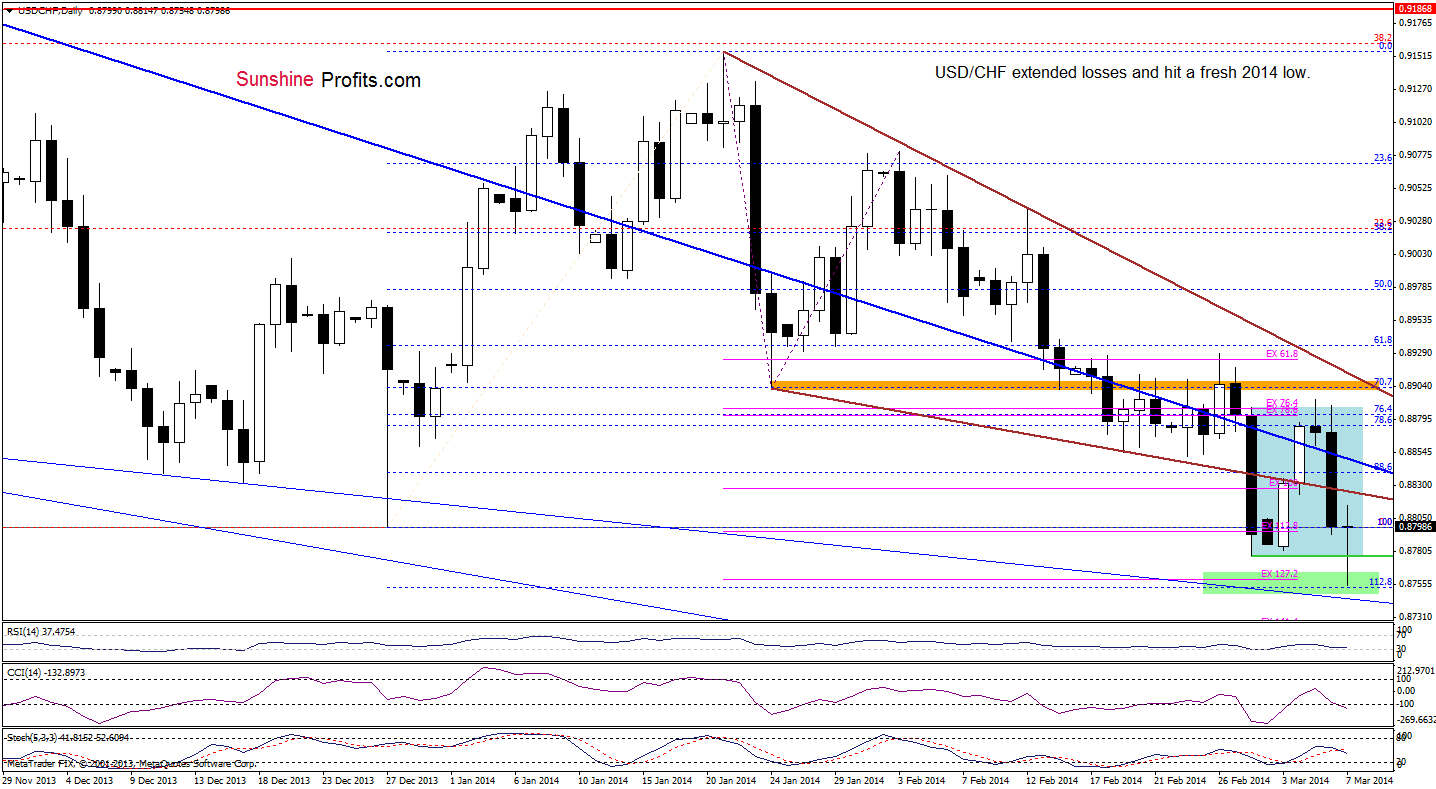
(…) it seems that we will likely see a re-test of the strength of the February low. If it holds, we may see another corrective upswing. However, if the buyers fail, we will likely see a drop to the support zone created by the 112.8% Fibonacci extension, the 127.2% Fibonacci projection and the medium-term thin blue support line, which successfully stopped declines in December.
As you see on the above chart, earlier today, USD/CHF declined sharply, broke below the February low and reached the support zone. If this support encourages buyers, we may see an attempt to break above the lower border of the declining wedge. However, if they fail, we will likely see a drop to the medium-term thin blue support line (currently around 0.8743).
Very short-term outlook: bearish
Short-term outlook: bearish
MT outlook: bearish
LT outlook: bearish
Trading position (short-term): In our opinion, the situation is too unclear to go long or short at the moment. We will keep you informed should anything change, or should we see a confirmation/invalidation of the above.
AUD/USD
Quoting our last Forex Trading Alert:
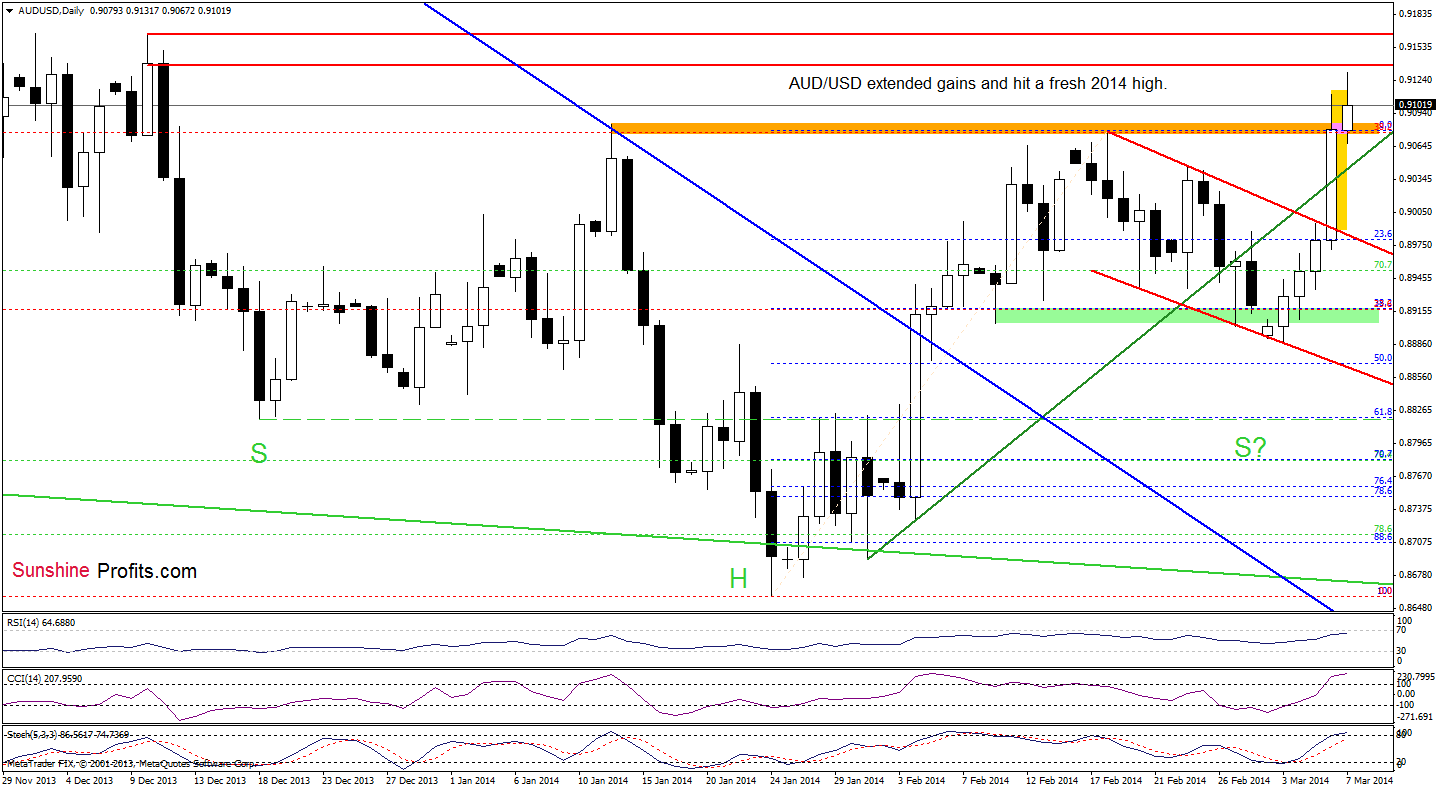
(…) the short-term outlook is bullish and further increases are quite likely. If this is the case, the nearest resistance zone is between 0.9139 and 0.9165 (the Dec.10 high in terms of intraday high and closing prices).
Looking at the above chart, we see that AUD/USD extended gains, hit a fresh 2014 high and approached the resistance zone. On one hand, if it encourages sellers to act, we will likely see a pullback to the previously-broken green line, which serves as support at the moment. On the other hand, if this resistance is broken, we may see further improvement ant the next upside target will be around 0.9206, where the 50% Fibonacci retracement level (based on the entire Oct.-Jan. decline) is. When we take a closer look at the position of the indicators, we see that the CCI and Stochastic Oscillator are overbought, which suggests that the space for further growth may be limited in the coming days.
Very short-term outlook: bullish
Short-term outlook: bullish
MT outlook: bearish
LT outlook: bearish
Trading position (short-term): In our opinion no positions are justified from the risk/reward perspective at the moment. We will keep you informed should anything change, or should we see a confirmation/invalidation of the above.
Thank you.
Nadia Simmons
Forex & Oil Trading Strategist
Forex Trading Alerts
Oil Investment Updates
Oil Trading Alerts

