
Earlier today, the U.S. dollar declined sharply against the euro after the release of positive euro zone economic reports, which supported demand for the common currency. Later in the day, the greenback extended losses against the euro and dropped to its lowest level since the beginning of the year after preliminary data showed that the U.S. gross domestic product rose 2.4% in the fourth quarter, missing expectations for a 2.5% growth. What happened with other currency pairs? What is their current outlook? We invite you to read our today's Forex Trading Alert.
In our opinion the following forex trading positions are justified - summary:
EUR/USD
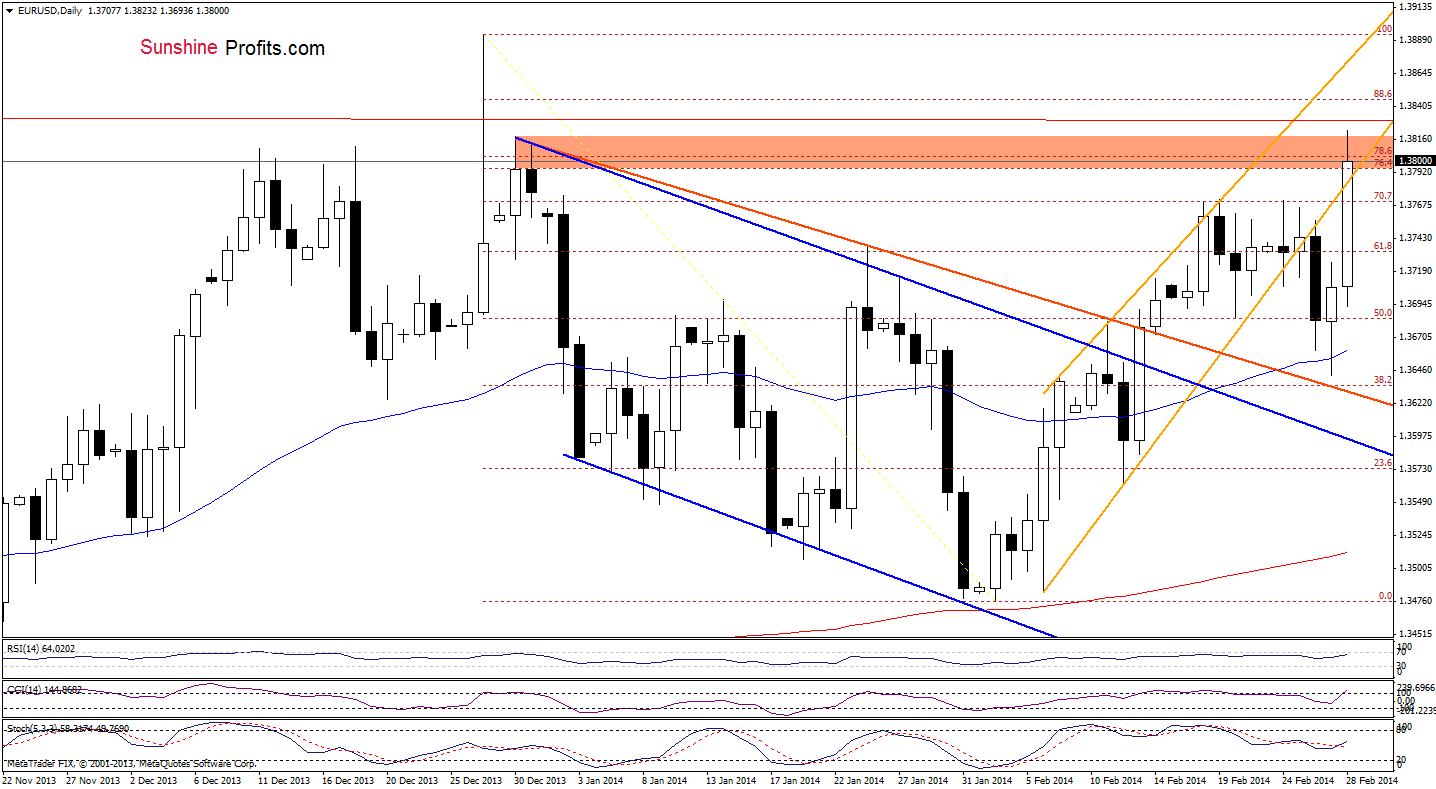
Earlier today, EUR/USD extended gains and came back above the previously-broken lower border of the rising trend channel. With this upswing, the pair also reached a strong resistance zone created by the 76.4% and 78.6% Fibonacci retracement levels based on the entire Dec.-Feb. decline (additionally this area is reinforced by the Dec.30 high). If the buyers do not give up and manage to break above this resistance zone successfully, we may see an attempt to reach the upper line of the rising trend channel, which corresponds to the December high at the moment. However, if they fail and the exchange rate declines below the lower border of the rising trend channel once again, we will likely see a decline to around yesterday’s low.
Very short-term outlook: bullish
Short-term outlook: mixed
MT outlook: mixed
LT outlook: bearish
Trading position (short-term; our opinion): The previous short position was closed at 1.3773 after we saw unexpected sharp decline in the US currency. In our opinion no positions are justified from the risk/reward perspective at the moment. We will keep you informed should anything change, or should we see a confirmation/invalidation of the above.
GBP/USD
Quoting our last Forex Trading Alert:
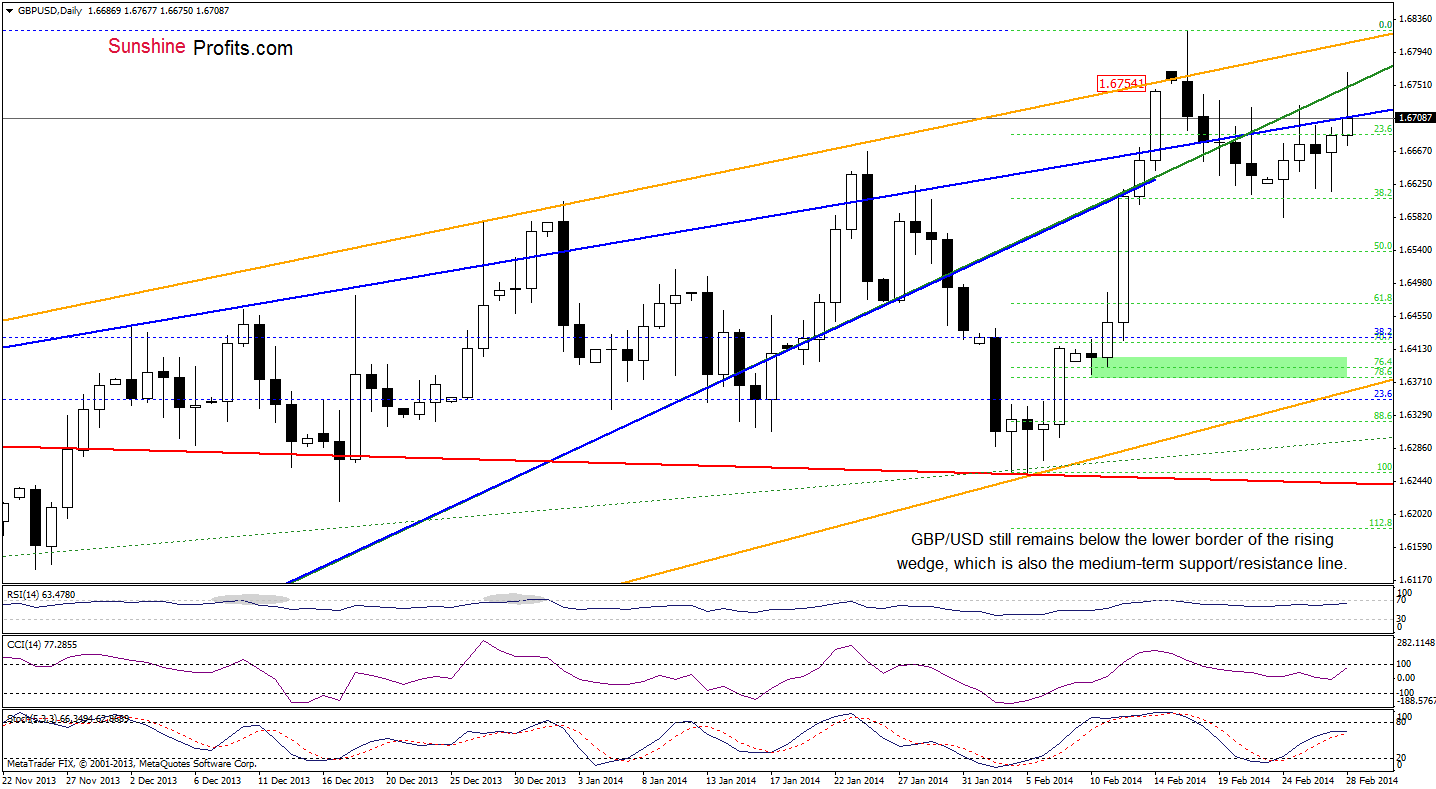
(…) the pair approached yesterday’s high and the upper line of the rising wedge. If this resistance zone is broken, we may see further improvement and the first target for the buyers would be the medium-term resistance line (marked with green).
Earlier today, we noticed such price action and GBP/USD moved slightly above its upside target. Despite this improvement, the medium-term resistance line decelerated further improvement and the exchange rate declined in the following hours reaching the upper line of the rising wedge. If this support line encourages buyers to push the order button, we may see another attempt to break above the major resistance line. If it is broken, the next upside target, will be the upper line of the rising trend channel (marked with orange). However, if the sellers manage to push the pair below this blue line, we will likely see another attempt to reach the 38.2% Fibonacci retracement. Looking at the position of the indicators, we see that the CCI and Stochastic Oscillator move in the same direction supporting buyers.
Very short-term outlook: mixed with bullish bias
Short-term outlook: mixed
MT outlook: mixed
LT outlook: mixed
Trading position (short-term): In our opinion no positions are justified from the risk/reward perspective at the moment as the current situation is unclear. We will keep you informed should anything change, or should we see a confirmation/invalidation of the above.
USD/JPY
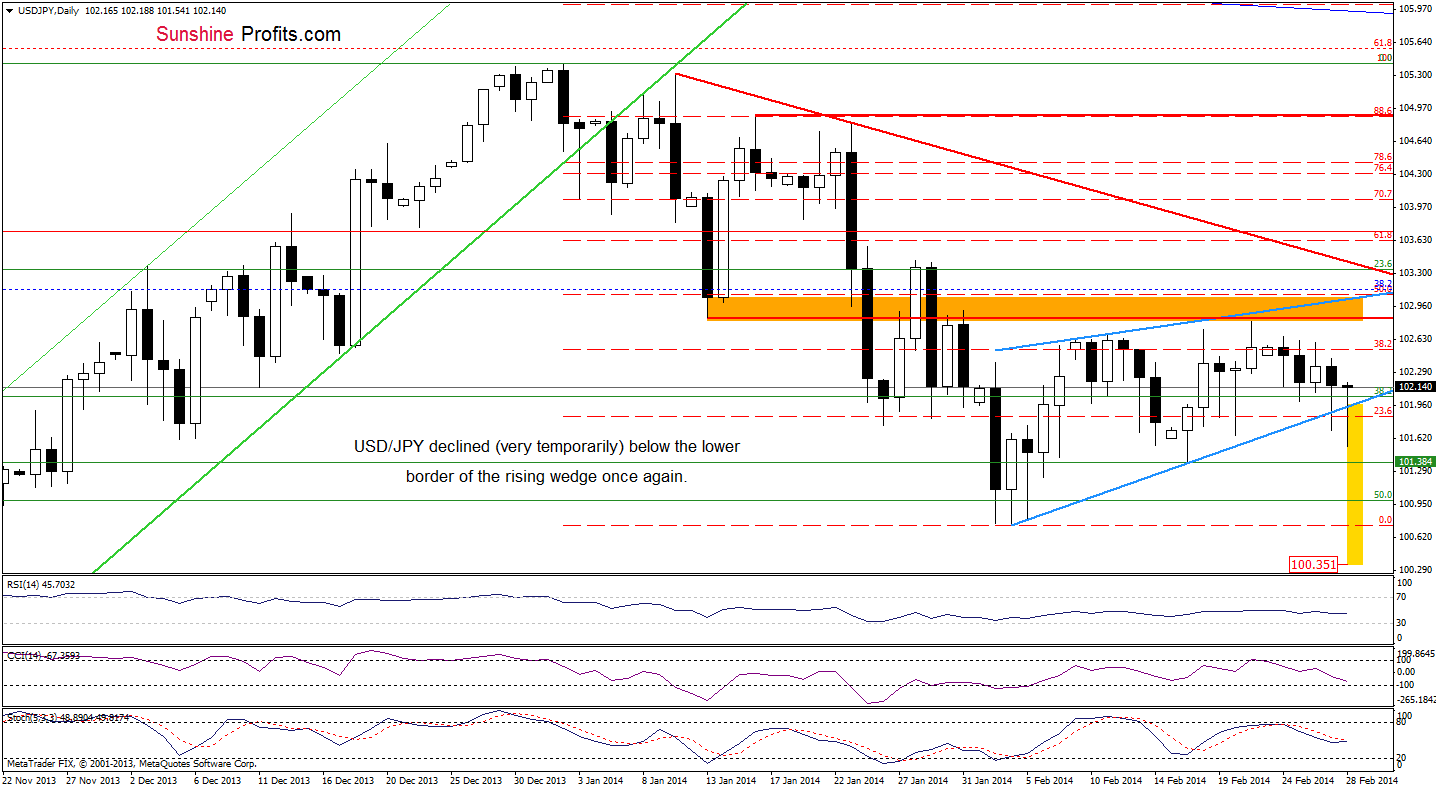
Earlier today, we noticed another attempt to move below the lower border of the rising wedge (marked with light blue). Similarly to what we saw yesterday, it turned out in the following hours that this deterioration was only temporary and the pair rebounded quickly. Just like a day before, with this upswing, the exchange rate came back to a narrow range between the 23.6% and 38.2% Fibonacci retracement level (based on the recent decline). Therefore, what we wrote in our previous Forex Trading Alert is up-to-date.
(…) as long as there is no breakout above the upper line (or a breakdown below the lower border) a bigger upswing (or downswing) is not likely to be seen. However, taking into account today’s decline, it’s worth noting that if the sellers successfully push the pair below the very short-term support line (the lower border of the rising wedge), we will probably see a re-test of the strength of the February low (as a reminder, the price target after a breakdown is a bit lower than the monthly low and we marked it with a yellow rectangle). Looking at the position of the indicators, we see that sell signals remain in place supporting further deterioration.
Very short-term outlook: mixed with bearish bias
Short-term outlook: mixed with bearish bias
MT outlook: bullish
LT outlook: bearish
Trading position (short-term): In our opinion, the situation is too unclear to go short or long at the moment. So, no positions are justified from the risk/reward perspective. We will keep you informed should anything change, or should we see a confirmation/invalidation of the above.
USD/CAD
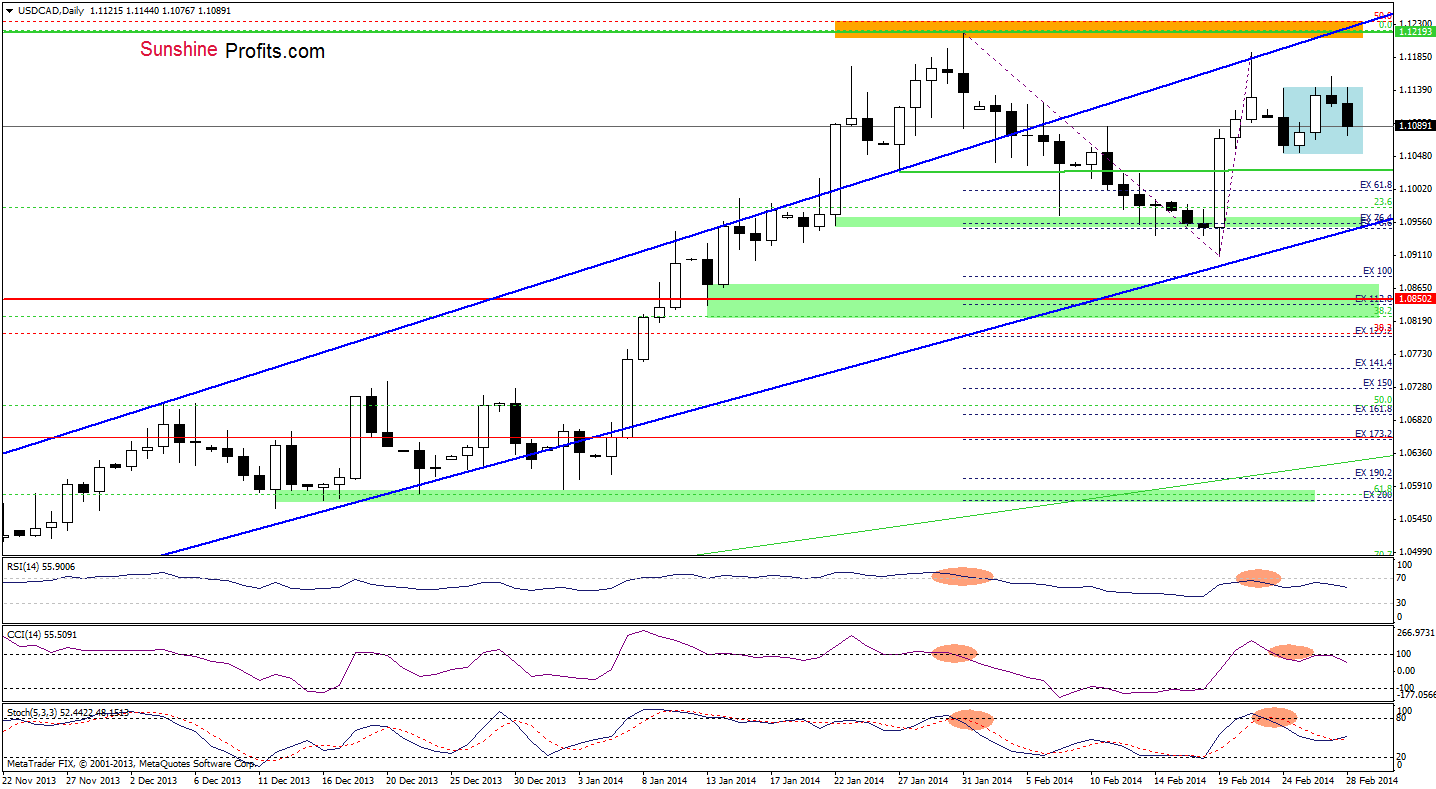
As you see on the daily chart, USD/CAD gave up the gains and pulled back to the consolidation range. Additionally, the RSI and CCI reversed, while the Stochastic Oscillator is close to generating a sell signal. Although the indicators support sellers at the moment, it seems that the situation is a bit unclear as the pair remains in a consolidation range. However, if sell signals remain in place and the exchange rate declines below the Feb.24 low, we may see further deterioration and a drop to the lower border of the rising trend channel, which corresponds to a support zone created by Jan.22, Feb.7 and Feb13 lows.
Very short-term outlook: mixed
Short-term outlook: mixed
MT outlook: bullish
LT outlook: bearish
Trading position (short-term): In our opinion no positions are justified from the risk/reward perspective. However, if sell signals remain in place and the exchange rate declines below the Feb.24 low, we will likely consider opening short positions. We will keep you informed should anything change, or should we see a confirmation/invalidation of the above.
USD/CHF
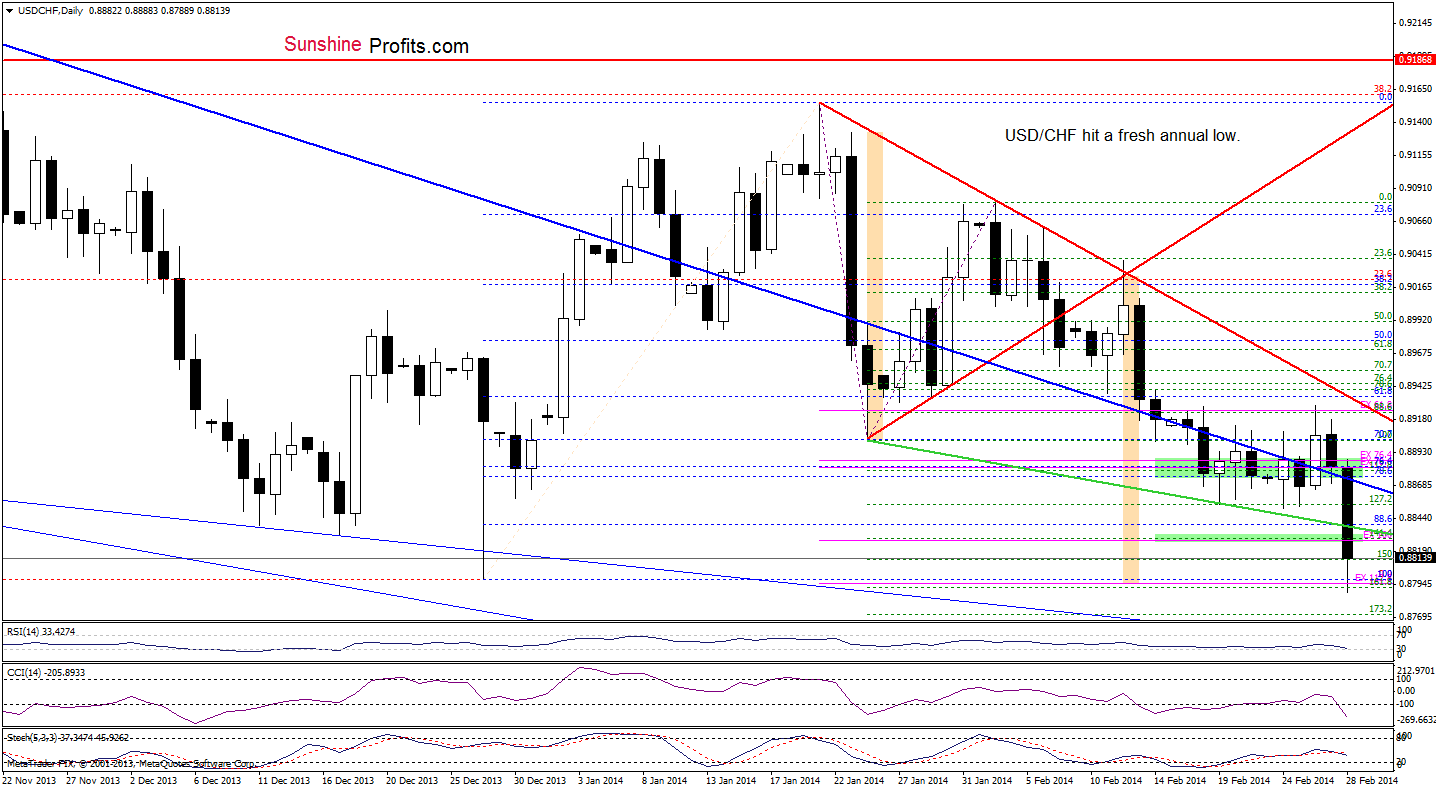
Yesterday, we wrote that if the exchange rate declined below the major support line, we would likely see further deterioration and a test of the strength of February low. As you see on the above chart, the monthly low didn’t managed to stop sellers and USD/CHF declined sharply earlier today. With this downswing, the exchange rate reached not only the next support zone (we wrote about it in our Forex Trading Alert posted on Tuesday), but also hit a fresh 27-month low. Additionally, the sellers realized a bearish scenario after a breakdown below the lower border of the triangle (marked with light orange). If this area encourages buyers to act, we may see a corrective upswing in the coming day (or days). However, if they do not push the pair above the declining resistance line (marked in green) in the near future, it seems that we may see further deterioration. In this case, the downside target will be around 0.8755, where the next declining support line intersects with the 112.8% Fibonacci extension level and the 127.2% Fibonacci projection.
Very short-term outlook: bearish
Short-term outlook: bearish
MT outlook: bearish
LT outlook: bearish
Trading position (short-term): In our opinion, the situation is too unclear to go long or short at the moment. We will keep you informed should anything change, or should we see a confirmation/invalidation of the above.
AUD/USD
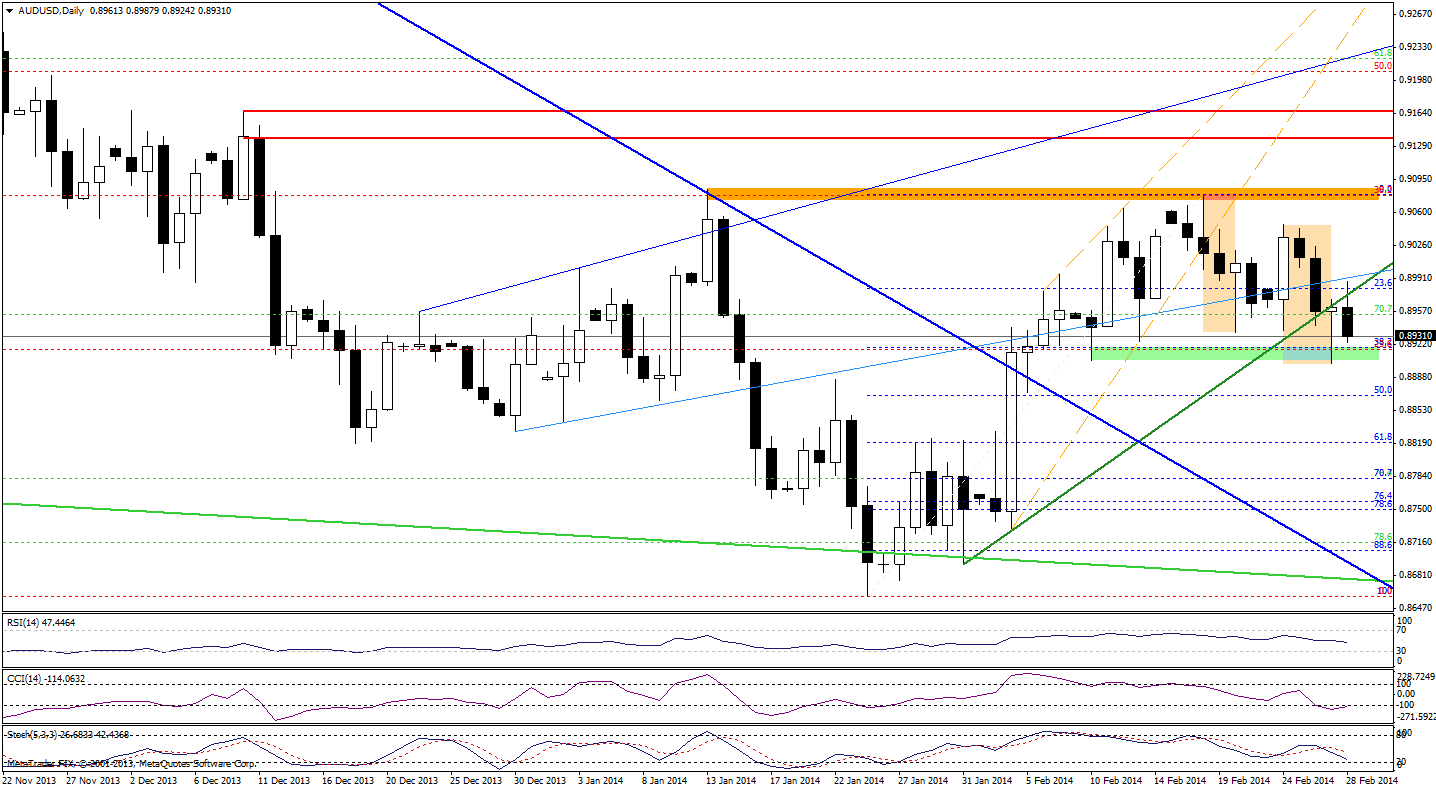
Earlier today, AUD/USD extended losses and dropped below the very short-term rising support line (marked with green) once again. Similarly to what we saw yesterday, this breakdown triggered a downswing, which approached the pair to a support zone created by the Feb.10 low and the 38.2% Fibonacci retracement level based on the recent rally. If history repeats itself once again and this strong support encourages buyers to act, we may see a corrective upswing to the green rising line. However, if this support area is broken, we may see further deterioration and the downside target would be around the 61.8% Fibonacci retracement. Why here? When we take a closer look at the daily chart, we may see a left shoulder and a head of potential reversed head and shoulders formation. If this is the case, a right shoulder will likely materialize around this Fibonacci retracement in the coming week.
Very short-term outlook: mixed
Short-term outlook: mixed
MT outlook: bearish
LT outlook: bearish
Trading position (short-term): In our opinion no positions are justified from the risk/reward perspective. However, if the support zone is broken, we will likely consider opening short positions. We will keep you informed should anything change, or should we see a confirmation/invalidation of the above.
Finishing today’s Forex Trading Alert, we would like to let you know that in order to increase the efficiency of the forex trades we will start including the 4-hour charts next week. There were many trading opportunities that turned out to be profitable (in hindsight) that we didn't take as they seemed too short-term oriented. It seems that the currency markets at this time provide much better risk/reward ratio for these shorter-term trades than what we have been featuring so far and we want you to help you take advantage of it.
Thank you.
Nadia Simmons
Forex & Oil Trading Strategist
Forex Trading Alerts
Oil Investment Updates
Oil Trading Alerts

